Hero MotoCorp: Post-Wave 3 Reset UnderwayFrom the 2020 low near 1,475, Hero MotoCorp on the weekly timeframe has been unfolding a higher-degree impulsive structure . The advance into the all-time high at 6,388.50 appears to have completed Wave 3 , with the internal structure cleanly subdividing into five waves (i)–(v) .
Wave (v) terminated near the 100% Fibonacci extension of Wave (i) measured from Wave (iv) , a typical exhaustion zone for a third wave of higher degree.
With the five-wave rally from 2,146.85 to the ATH now
Elliott Wave
BTCUSD: Holding Wave X or Slipping Lower?24 Nov 2025
27 Nov 2025
1 Dec 2025
17 Dec 2025
Bitcoin is still trading inside a falling channel, and the overall structure remains corrective. The recent bounce from lower levels lacks momentum and is overlapping, which signals consolidation rather than a trend reversal. Price continues to respect channel resistance, keeping the broader bias weak.
Wave X is acting as an important support zone around 83,822 , and as long as price holds above this level, further consolidation remai
NVIDIA: Double Bottom Flat at Support — Bounce Setup in PlayNVIDIA is currently testing a well-defined support zone near the prior lows, where price action is starting to compress rather than accelerate lower. The structure forming at this level resembles a double-bottom flat , suggesting that selling pressure is gradually losing momentum.
From an Elliott Wave perspective, the ongoing decline fits well as the final leg of a corrective phase. As long as this support zone holds, the odds favor the development of a Wave C move higher , which would mark a
Wave 4 Trap Complete as Bitcoin Prepares for Final Flush6 Days Ago
3 Days Ago
1 December 2025 :
BTC moved into the expected corrective zone last week but stayed inside the falling channel, showing that wave 4 was only a temporary bounce. Buyers failed to break any key resistance, and momentum kept fading. This kept the broader outlook bearish and hinted that wave 5 was still pending.
BTC has now broken below the short-term rising structure, confirming that wave 4 topped out near the 0.786 retracement. The rejection from that zone triggered a
ETHUSD Bull Trap? - Final Breakdown Setup Is Almost Locked InETH is still stuck inside a clear falling channel, and the entire pattern is behaving like a corrective downtrend. The recent bounce from 2620 looks sharp, but it’s still just a counter-trend move. Nothing here screams trend reversal yet.
Wave 3 ending at 2620 , and now the price is rising for a Wave 4 retracement. Wave 4 usually moves back toward the mid-channel and tests previous breakdown zones.
The red box around 3200–3300 is the key trap zone. This is where sellers can return because
Nifty Analysis for Dec 17, 2025Wrap-up:
After hitting low of 25904 counts have been changed. Now, wave 1 is completed at 26057 and wave 2 is treated as completed once nifty breaks and sustains above 25915. Thereafter, Nifty will head towards wave 3.
What I’m Watching for Dec 17, 2025 🔍
Buy nifty above 25915 sl 25833 for a target of 26012-26174-26198.
Disclaimer: Sharing my personal market view — only for educational purpose not financial advice.
NBCC (India) – Wave 3 Setup Backed by Strong Project PipelineAfter completing a textbook 5-wave advance into 130.70 , where Wave 5 aligned exactly with the 2.618 extension of Wave 1 projected from Wave 4, NBCC corrected into 98. That low now marks a clean green Wave 2.
The recent bounce to 117.20 formed Wave 1 of a higher-degree Wave 3.
Price has retraced into the 104–105 zone (0.618 Fib) with visible volume expansion, suggesting accumulation.
Invalidation/SL sits at 98 , making risk well-defined.
Breakout above 117.20 opens the path towar
S&P 500: Positioned for a Santa Rally?While tracking the global markets — especially the US indices — one thing stood out clearly.
The rally from 6521.92 to 6895.78 unfolded as a clean impulsive move , not a corrective grind. That structural behavior is what made me treat this leg as an impulsive rally (Wave 1/A) rather than just another bounce.
Since then, price action has cooled into a Wave 2/B reset , pulling back towards key Fibonacci retracement pocket . Structurally, this looks more like a pause before continuation t
BSE: Wave B Topped, C-Wave Path in FocusContext
BSE looks like it topped out at Wave B, and the price action since then is starting to align with a fresh downside leg.
Wave Count View
Wave A completed in five waves with extended wave 3, Wave B retraced as a controlled three, and the drop from 2960 fits the profile of a leading diagonal for Wave 1 of C.
Bearish Case
As long as 2960 holds, the bias stays firmly on the downside. A proper C-wave should unfold in five legs, and the early structure is already pointing that way.
C
Nifty Analysis for Dec 16, 2025Wrap-up:
As predicted Nifty achieved its wave 2 target at 25904 and now, heading towards its 3.
What I’m Watching for Dec 16, 2025 🔍
Sell Nifty if it breaks 26013 sl 26047 for a target of 25947-25959.
and, Buy nifty if it comes near 25947-25959 sl 25904 or if it does not come then buy above 26025 SL 26013 for a target of 26149-26174.
Disclaimer: Sharing my personal market view — only for educational purpose not financial advice.
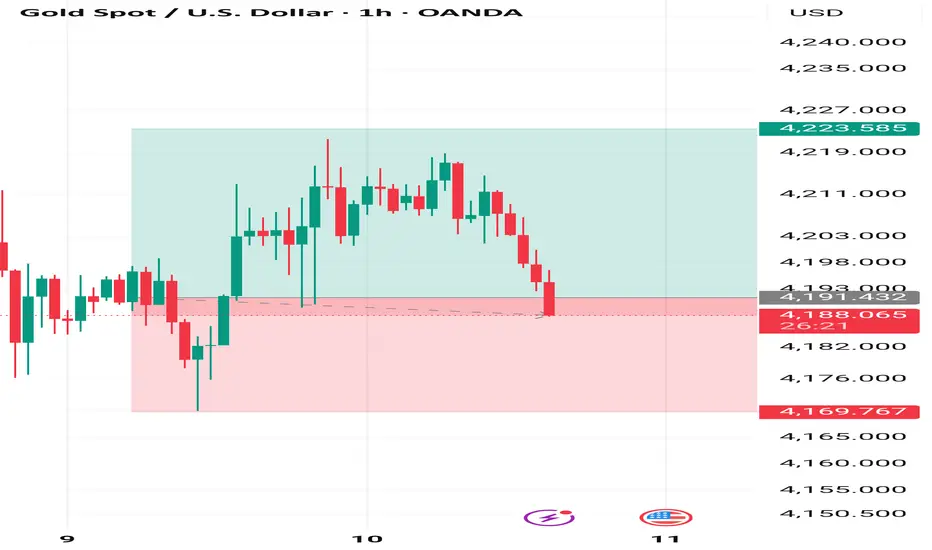
GOLD 4H | Liquidity Harvest Done… Now the Slide BeginsPrice engineered liquidity above the previous swing high and immediately delivered a sharp rejection, confirming a buy-side liquidity grab and the start of distribution.
Structure has now shifted bearish with a clear BOS from the premium zone. I’m expecting a mitigation leg before continuation lower.
The draw on liquidity sits inside the 4100–4080 demand imbalance, which aligns with unmitigated bullish orders from the prior accumulation phase.
If 4100 fails to hold on mitigation, the next liq
Nifty Analysis for Dec 15, 2025Wrap-up:
Nifty breaks and sustains above 25908. Therefore, b is completed at 25693 and now, Nifty will head towards its final wave c of wave y of wave 5 but before that it will retest the breakout level of 25908.
What I’m Watching for Dec 13, 2025 🔍
Sell nifty only intraday if it breaks and sustains below 26012 SL 26057 for a target of 25922-25904-25887.
Disclaimer: Sharing my personal market view — only for educational purpose not financial advice.
Panic Bottom only for long term investors.The chart is displayed on Log scale. As we can see it is a complete impulse wave where wave 1 is the longest. When wave 1 is the longest the correction ends at the bottom of wave 2 (which is also a long term SL). It is a panic bottom . Since Bear is established here it will take a long time to recover . But it is a buy for long term investors
Nifty Analysis for Dec 09/10/11, 2025Wrap-up:
Nifty is forming a wxy pattern in wave C of major wave 5 has completed wave w at 25153 and wave x at 24587 and heading towards internal wave y of wave 5. In wave y, wave a is completed at 26104 and b is expected to be completed at 25728 once nifty breaks and sustains above 25908. Thereafter, Nifty will head towards its final wave c of wave y of wave 5.
What I’m Watching for Dec 09/10/11, 2025 🔍
Buy nifty if it breaks and sustains above 25908 for at least 25 min. SL 25728 for a tar
Nifty Short term view from December, 2025 to March/April 2026Wrap up:-
After breaking ATH, Wave X of Nifty has been shifted further and whole of the pattern has been changed. Now, wave w of major wave X is treated as completed at 26277 and wave x of Major wave X is running of which wave a of x of X was completed at 23263 and wave b of x of X is running. Internal wave b of wave b of x of X is completed at 21743 and heading towards wave c.
Min. projection of final wave 5 of internal wave c is achieved at 25627 and heading towards its second target 26423
Positional View in Nifty till december, 2025 and January, 2026Wrap up:-
In wave 5 of c of b of X, Nifty is making wxy pattern. Wave w has been completed at 25153 and wave x at 24587 and heading towards internal wave y of wave 5.
In wave y of wave 5, Nifty has completed wave a at 26104 and b at 25728 and heading towards its wave c for a target of 27244.
Buy Nifty at cmp 25758 sl 25728 for a target of 27244 till december, 2025 or mid of january, 2026.
Disclaimer: Sharing my personal market view — only for educational purpose not financial advice.
Hindalco: Terminal Wedge, Reversal Risk HighStructural Context
Initially, I considered the decline from 864 toward 770 as a standard ABC correction. But the drop from Wave 2 was far too sharp and drove RSI into deep oversold territory — behaviour that aligns better with impulsive price action.
Because of this, the move is treated as a developing 1-2-3 rather than a corrective ABC.
This adjustment also aligns perfectly with the broader structure: a completed Wave 3 at 770.15, followed by a three-wave recovery into Wave 4.
Wave 4 Comple
Nifty Analysis for Dec 12, 2025Wrap-up:
Nifty breaks and sustains above 25908. Therefore, b is completed at 25695 and now, Nifty will head towards its final wave c of wave y of wave 5 but before that it will retest the breakout level of 25908.
What I’m Watching for Dec 12, 2025 🔍
Sell nifty only intraday if it breaks and sustains below 25965 SL 26038 for a target of 25916-25900-25887.
Disclaimer: Sharing my personal market view — only for educational purpose not financial advice.
Coforge: Ending Diagonal Signals Exhaustion Near Wave (D) HighCoforge has likely completed Wave c of (D) with a clean ending diagonal near the upper boundary of the multi-month triangle structure. This raises the probability of Wave (D) being complete — if price turns down from here.
Technical View
Ending Diagonal: The final leg into ₹1,986 shows a wedge structure — typical of terminal C-waves inside corrective patterns.
Structural Resistance: This move hits the B–D trendline, a natural pivot for Wave (D) completion.
Pivot Zone: The 52-week high
Why Nifty’s Ending Diagonal Turns the Bias BearishAfter my previous bullish take on Nifty (see linked related publications), the view has now flipped.
And no — it’s not because the US indices are cracking.
And no — it’s not because Bitcoin is collapsing and draining liquidity.
Those may add pressure, sure.
But the core reason I’m turning bearish is right on the chart — in the structure itself.
Daily Chart – Why the Tone Has Changed
The key shift came from the overlap at 25,448.95 , which strongly hints that the rally from 24,404.70 unf
Indus Towers: Channel Breakout Meets Wave TheoryA simple but powerful concept from classical technical analysis — the channel breakout target — plays out beautifully here.
This idea, also discussed by Dr. Sudhir Dixit in his book on breakout signals, gives traders a disciplined way to estimate post-breakout targets.
After a steady five-wave advance from ₹312.55 to ₹369.55, Indus Towers entered a clean descending channel , forming the corrective Wave 2.
The breakout that followed came with a strong volume surge , confirming a clear shif
Dixon Technologies: Watching a Key Reversal Zone AheadDisclaimer:
This analysis is for educational purposes only and does not constitute investment advice. Please do your own research (DYOR) before making any trading decisions.
Dixon’s decline is developing as a running flat within Wave 2. Wave A and B are already in place, with Wave B stretching above the Wave A origin, which is typical behaviour when the larger trend is still strong. The final leg, Wave C, is still unfolding.
Inside Wave C, waves (i) through (iv) look complete, and the market