Possible Elliott Wave counting of GoldCounting 1:
After a clear impulse, the price formed a Zig-zag correction (marked in red ABC).
If the correction is completed near 50% (near 3228 level), then the recent upmove is a new impulse.
Of which wave 1 is completed, reaching a high of 3435. The market is currently in wave 2, and the next possible moves are marked as impulse counting (blue 12345).
This analysis is based on Elliott Wave theory and Fibonacci study.
This analysis is for educational purposes only.
Elliott Wave
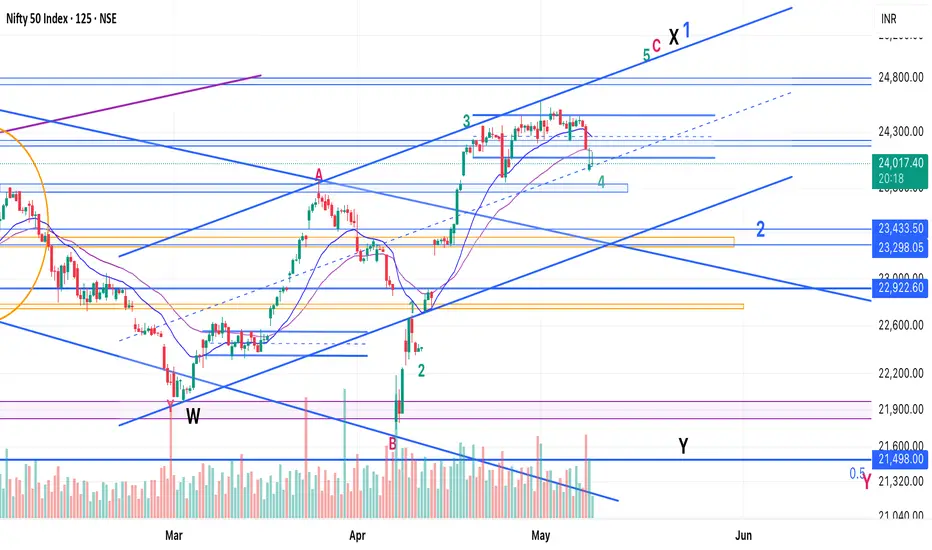
Nifty - Elliot Waves - Another PossibilityWell, Nifty is at a place that there are so many possibilities :)
This one is in line with the previous one, where I had mentioned that 5 up is pending and 25k can come.
I saw a few stocks making an expanded ED and turning, which gave the idea that Nifty could also be doing that.
So, here it goes - we go up in an E - 24800 is top of the expanded ED - we might even see a throw over to 25k - but unlikely) and then roll over.
After that there will be 2 options:
1. Bullish Scenario - We are just d
Nifty - Elliot Wave - Alternate counts - Bullish ScenarioI called a top on May 2nd as the buying looked like a trap - which usually acts as a good end of a trend move.
It worked out quite well, but we didn't get a selling momentum, that I expected.
So, contemplating if we are still in 4th and there's another leg up pending, which should be:
1. Bearish scenario - C of X - Y down should take us to new lows
2. Bullish Scenario - 1 of 5 (weekly) - We should have a 2 and then head up in waves 3 and 5 to 27-30k.
It's a tricky position to be in.
Plan: Keep
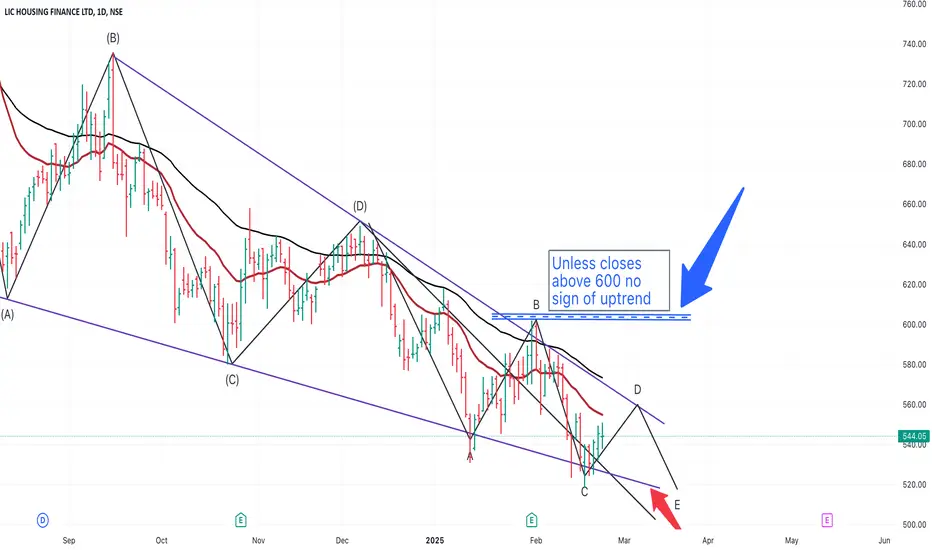
STAY AWAY FROM LIC HOUSING FINANCELIC Housing Finance is in down trend since July 2024. It has form a downward sloping triangle. we are in Big Wave E of a triangle and we are going to see one more triangle within a triangle, Once the small triangle which is forming in last leg of E is completed we will see uptrend, but the confirmation will come only after we close successfully above 600. Remember Stock movement is not linear, what that means is after the cross over above 600 we will see a pullback which will be the time to go
RELIANCE INDUSTRIES IN LAST LEG OF CORRECTION ??Reliance Industries has seen a lot in last few months. Its time for Reliance industries to complete its last leg of correction and then resume its upward journey.
2 possibilities in last leg of correction.
1) It can be an impulsive move which will be in 1-2-3-4-5, which will be overall Wave C
2) It could be a triangle in which case the downfall and so the correction will be limited but boring.
Check out my previous chart on Reliance Industries.
POWER GRID CORPORATION SHOWING POWERWe have completed the Corrective waves and Impulsive waves have begun.
I can think of 2 possibilities as of today:
1) We are in 5th wave which should get truncated and soon the corrective phase which will be either simple or complex will start
2) If we are still in wave 3 continuation then we will reach 339++.
In any case we are in uptrend and there is still long way to go.
First Immediate target expected it to be 315 and if we are in 2nd possibility then we will reach 330++ soon.
Disc
Nifty - Elliot Wave Analysis - Short Opportunity!We have had a good run-up from April lows. Today's buying seems like the last leg up which should end 5th up.
Now there are two possibilities:
1. Bullish Scenario: Nifty has completed correction in April first week and we have done Wave 1 in an impulse of 5 waves up. In this case we should retrace 38-50% of the move from April lows. So, expect 500-1000 points in Wave 2.
2. Bearish Scenario: The entire move up from April lows was corrective and part of larger X. X is formed by ABC where C is 5 w
XAU/USD Elliott Wave Count: Preparing for Final ImpulseXAU/USD appears to be in a textbook 5-wave impulsive structure on the 4H chart, with the market now completing Wave 4 as a classic ABC corrective flat/pennant.
The impulsive move from the Wave 2 low has formed clear internal substructures, with Wave 3 exhibiting extended price action, consistent with Elliott Wave guidelines.
Currently, price is consolidating in a contracting pattern labeled Wave 4 (A-B-C), which looks to be near completion. Based on wave symmetry and Fibonacci projections, a str
FAZE3Q LONGThe Elliott Wave analysis shows that the stock has completed waves (i), (ii), (iii), (iv), and (v), as represented by blue numbers on the daily chart.
Stock is in correction now.
Wave correction will go in waves (a), (b), and (c) in blue color on the chart.
Wave (a) is completed, and wave (b) is in progress.
Wave (b) will go in three sub-waves (a, b, and c in red color).
Wave a and b is completed and wave c is in progress.
wave c will unfold in five sub-waves (black circle) shown in the chart
JSFB LONGThe Elliott Wave Theory's description of the structure and pattern of price movements in financial markets is known as the Elliott Wave Structure.
The Elliott Wave analysis indicates that the stock has completed waves (i) and (ii), which are shown as blue numbers on the daily chart. Journey of Wave (iii) will start.
It is anticipated that wave (iii) will have about five subdivisions shown in red color.
wave i (in red color) of wave (iii) will unfold in five sub waves shown in black circle.
W
CHOLAMANDALAM NEEDS BREAK After a good run up any stock needs break. Cholamandalam Investment and Finance Company is no different. What you see on the chart is the completion of the Leading Diagonal, what's coming next is correction a-b-c. Now the question stands is how many days of break is needed before it could resume its upward Journey. If its closes below 1515, then the vacation is long.
Watchout for the levels in chart. when its ready it will be difficult to stop Cholamandalam's upward journey.
Please refer my