Long
Long
 Long
Long
 Short
Short
 Short
Short
 Short
Short
 Short
Short
XAUUSD: Wave 5 bearish may continue from sell zone.Gold is still trading inside a corrective bearish structure after failing to hold the earlier recovery momentum. From Kelly’s view, the current chart suggests that price may still be developing wave 5 lower, with the sell zone around 4,125–4,135 acting as the key resistance area.
The key idea is simple: gold is not showing a clean bullish continuation yet. As long as price stays below the sell zone, the wave 5 downside scenario remains active.
⟡ Market structure
The chart shows gold moving inside a descending channel after the previous strong upside move completed near the upper range. Price has already broken below the short-term rising trendline, then retested the lower resistance area without creating a strong bullish recovery.
The current reaction around 4,125 is important because price is sitting directly under the sell zone wave 5. If sellers continue to defend this area, gold may rotate lower again towards the support around 4,092 first.
Below that, the larger zone around 4,055–4,065 remains the main area where the Elliott 5-wave structure may complete.
➤ Key levels
◌ 4,125–4,135: sell zone wave 5 and short-term resistance
◌ 4,092: nearest support and first downside checkpoint
◌ 4,055–4,065: Elliott wave 5 completion zone
◌ 4,140: area where the sell setup begins to weaken
◌ Above 4,150: area where the bearish wave count needs reassessment
⌁ Elliott Wave view
From an Elliott Wave perspective, gold appears to be forming the final part of a bearish 5-wave decline inside the short-term channel.
Wave 1 started after price lost momentum from the upper range.
Wave 2 created a corrective rebound but failed to reclaim resistance.
Wave 3 pushed lower towards the 4,090 area.
Wave 4 is now reacting back into the sell zone.
If the sell zone holds, wave 5 may continue lower towards 4,055–4,065.
This is why Kelly would not chase buying while price remains below resistance. The current bounce still looks corrective unless buyers reclaim the sell zone with strength.
▸ Trading scenario
Preferred scenario: wait for price to reject from the 4,125–4,135 sell zone before expecting wave 5 continuation.
Sell zone: 4,125–4,135 if bearish confirmation appears
Stop loss: above 4,150 or above the confirmed rejection high
Take profit 1: 4,092
Take profit 2: 4,065
Take profit 3: 4,055 if wave 5 expands fully
Alternative scenario: if gold breaks above 4,150 and holds with strong acceptance, the bearish wave 5 setup weakens. In that case, price may need a new short-term structure before the next direction becomes clear.
⌁ Kelly’s view
For Kelly, this remains a sell-the-retest structure. Gold is still trading below the sell zone, and the Elliott count still allows one more downside leg before the full correction ends.
The cleaner plan is to wait for rejection around resistance, not sell blindly at support.
Gold is still under short-term pressure.
If 4,125–4,135 holds, wave 5 may continue towards the lower completion zone.
Share your view below.  Short
Short
 Long
Long
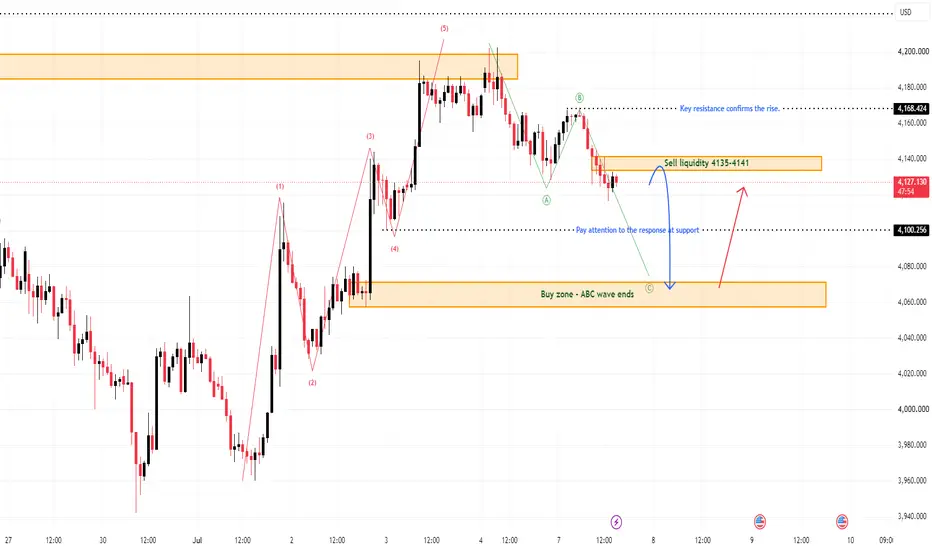
XAUUSD: Wave C pullback may signal next buy setupGold is currently moving inside a corrective ABC structure after the previous strong bullish recovery. From Kelly’s view, price is now developing wave C lower, and the next important setup may appear only when this corrective wave finishes around the support zone.
The key idea is simple: gold is correcting now, but if wave C ends cleanly near support, buyers may step back in for the next recovery phase.
⟡ Market structure
The chart shows gold rejected from the upper resistance area after completing a strong upside move. Price then started to form an ABC correction, with wave A pulling lower, wave B reacting near resistance, and wave C now moving down towards the buy zone.
The current price is trading below the sell liquidity area around 4,135–4,141, which means short-term pressure still remains. However, the larger recovery structure has not fully failed yet because the main reaction zone below is still waiting near 4,060–4,075.
This area is important because it is marked as the zone where the ABC wave may end.
➤ Key levels
◌ 4,135–4,141: sell liquidity and short-term resistance
◌ 4,127: current reaction area
◌ 4,100: support response level to watch
◌ 4,060–4,075: buy zone and possible ABC wave C completion
◌ 4,168: key resistance confirming stronger recovery
◌ Below 4,060: area where the bullish recovery setup weakens
⌁ Elliott Wave view
From an Elliott Wave perspective, gold appears to be correcting after completing the previous bullish 5-wave movement.
Wave A created the first pullback from the high.
Wave B reacted higher but failed to break the key resistance.
Wave C is now developing lower towards the buy zone.
If wave C finishes around 4,060–4,075 and price prints a bullish confirmation candle, the ABC correction may be complete. From there, gold could begin a new recovery attempt back towards 4,135–4,141 first, then 4,168 if momentum improves.
▸ Trading scenario
Preferred scenario: wait for wave C to complete around the buy zone before looking for buy confirmation.
Entry zone: 4,060–4,075 if bullish confirmation appears
Stop loss: below the confirmed wave C low
Take profit 1: 4,100
Take profit 2: 4,135–4,141
Take profit 3: 4,168
Alternative scenario: if gold breaks below 4,060 with strong bearish pressure, the ABC buy setup weakens and price may need to search for a deeper support base before recovery can continue.
⌁ Kelly’s view
For Kelly, this is not a buy-now structure yet. Gold is still moving inside wave C, so patience is important.
The cleaner setup is to wait for price to complete the correction near the buy zone, then watch whether buyers defend that support with a clear reaction.
Gold is correcting inside wave C.
If the buy zone holds, the next recovery phase may start from there.
Share your view below. Short 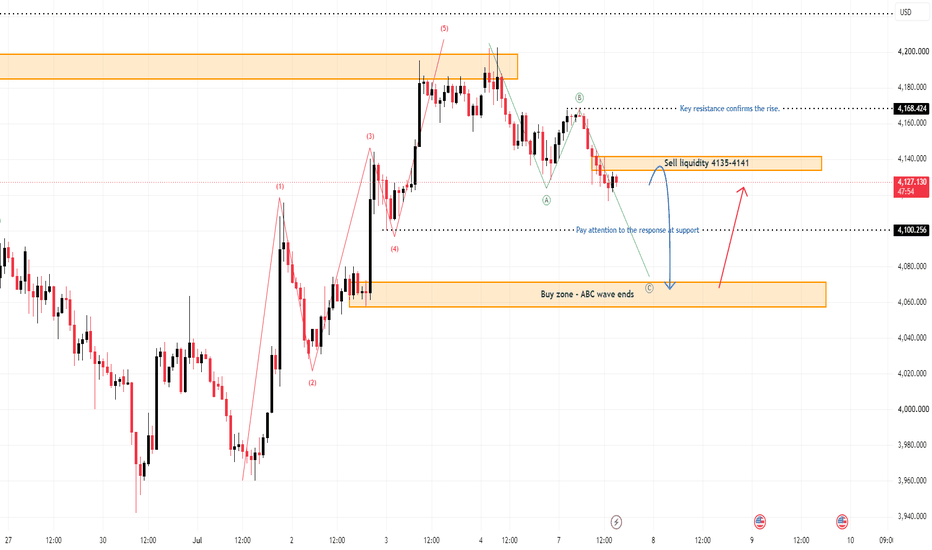
XAUUSD: Recovery Structure Maintains Above SupportGold is still holding a constructive recovery structure after the strong rebound from the lower zone. From Kelly’s view, price has already completed an impulsive recovery leg and is now moving into a corrective phase before the next possible upside move.
The key idea is simple: gold may pull back first, but the bullish recovery structure remains valid while support holds.
⟡ Market structure
The chart shows gold recovered strongly from the lower area near 3,960–3,980, then pushed higher into the 4,180–4,200 resistance zone. After reaching this upper area, price started to slow down and consolidate, which suggests that the market may need a corrective pullback before continuing higher.
The nearest strong support is around 4,155. As long as gold stays above this area, buyers still have control in the short term.
Below current price, the chart highlights two important reaction zones: the buy scalping wave A area around 4,120–4,130, and the deeper buy zone where the ABC correction may end around 4,065–4,080.
➤ Key levels
◌ 4,180–4,200: current resistance and recent rejection area
◌ 4,155: strong support and short-term decision level
◌ 4,120–4,130: buy scalping wave A zone
◌ 4,065–4,080: main buy zone and possible ABC completion area
◌ 4,221: upside target if recovery continues
◌ Below 4,065: area where the bullish recovery setup weakens
⌁ Elliott Wave view
From an Elliott Wave perspective, gold appears to have completed a short-term bullish 5-wave move from the lower base.
After a 5-wave recovery, the market often forms an ABC correction before the next larger move develops. The current structure may now be forming wave A lower, followed by a wave B rebound, then wave C into the main buy zone.
If wave C finishes around 4,065–4,080 and buyers defend that area, gold may begin a new upside sequence towards 4,155 first, then 4,221 if momentum expands.
▸ Trading scenario
Preferred scenario: wait for price to correct into the buy zone and show bullish confirmation.
Entry zone: 4,065–4,080 if bullish confirmation appears
Stop loss: below the confirmed reaction low or below 4,050
Take profit 1: 4,120–4,130
Take profit 2: 4,155
Take profit 3: 4,221
Alternative scenario: if gold breaks below 4,065 with strong bearish pressure, the ABC recovery setup weakens. In that case, price may need to build a new base before the bullish continuation becomes reliable again.
⌁ Kelly’s view
For Kelly, this is a buy-the-correction structure, not a chase-the-top setup. Gold already reacted strongly from the lower zone, but price is now near resistance, so waiting for a cleaner pullback makes more sense.
If the ABC correction holds above the buy zone, the recovery structure can continue.
Gold is still building a bullish recovery.
The better setup may come after a controlled pullback into support.
Share your view below. Short 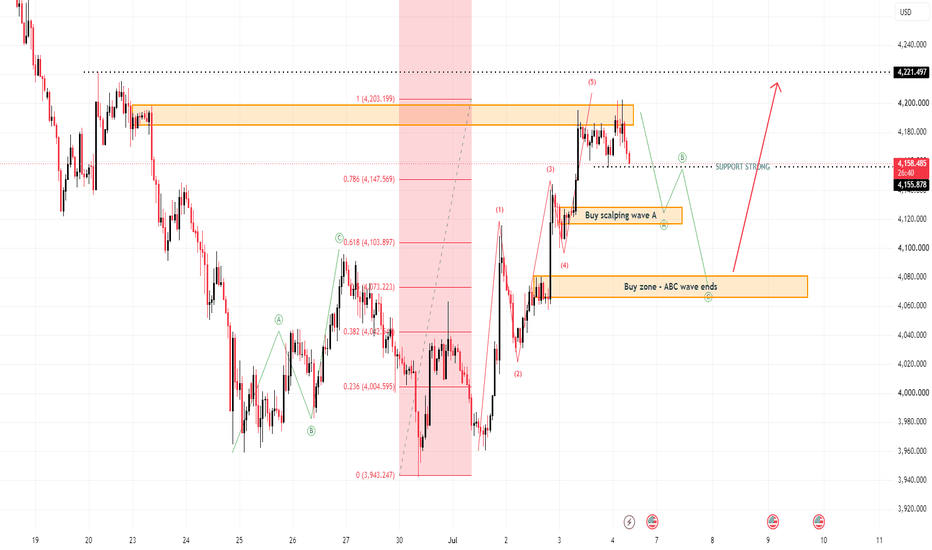
 Short
Short
 Short
Short
 Short
Short
 Long
Long
XAUUSD: Weekly recovery may continue from buy zone.Gold is showing a stronger recovery structure after reacting from the lower area near 3,960–4,000. From Kelly’s view, the market is now trying to build a bullish continuation setup for next week, with price holding above the buy zone and pushing back towards the Fibonacci target area.
The key idea is simple: gold still needs confirmation, but the current structure supports a potential recovery move if the buy zone continues to hold.
⟡ Market structure
The chart shows gold completed a strong bearish move before finding support around the lower base. After that, price started to form higher lows and a cleaner recovery structure.
Gold is now trading around 4,175 after breaking back above the short-term recovery area. The nearest buy zone sits around 4,090–4,120, and as long as price holds above this area, the bullish recovery view remains active.
The first important upside target is the 4,260–4,285 Fibonacci area. If momentum continues next week, gold may extend towards 4,330 and 4,395.
➤ Key levels
◌ 4,090–4,120: buy zone and key weekly support
◌ 4,175: current reaction area
◌ 4,219: first confirmation resistance
◌ 4,260–4,285: Fibonacci target zone
◌ 4,330: next upside resistance
◌ 4,395: higher weekly target
◌ Below 4,090: area where the recovery setup weakens
⌁ Elliott Wave view
From an Elliott Wave perspective, gold appears to be developing a new bullish recovery sequence after completing the previous bearish wave structure.
The current move may be forming the early stages of a 5-wave recovery. Price has already built a base, created the first upside leg, and is now trying to hold above the buy zone before the next wave expands higher.
If gold holds the 4,090–4,120 area, wave 3 may continue towards the Fibonacci target around 4,260–4,285. After that, a short pullback could form wave 4 before wave 5 attempts to reach the higher resistance area near 4,330–4,395.
▸ Trading scenario
Preferred scenario: wait for price to hold above the buy zone and confirm bullish continuation.
Entry zone: 4,090–4,120 if bullish confirmation appears
Stop loss: below the confirmed reaction low or below 4,060
Take profit 1: 4,219
Take profit 2: 4,260–4,285
Take profit 3: 4,330
Take profit 4: 4,395 if wave 5 expands strongly
Alternative scenario: if gold breaks below 4,090 and fails to reclaim the buy zone, the recovery structure weakens. In that case, price may return to the lower base before building a new bullish setup.
⌁ Kelly’s view
For Kelly, this is a bullish recovery structure for next week, but not a reason to chase price blindly. The cleanest setup comes from a controlled pullback into the buy zone, followed by confirmation that buyers are still defending the structure.
Gold is trying to recover from the lower base.
If the buy zone holds, the next weekly move may continue towards the Fibonacci targets above.
Share your view below. Long 
XAUUSD: ABC Wave Ends Near Sell ZoneGold is reacting near the upper resistance area after completing a short-term bullish Elliott structure inside the rising channel. From Kelly’s view, the current move looks like an ABC recovery that has already reached a sensitive completion zone, where buyers may start losing momentum.
The key idea is simple: gold has recovered well, but price is now testing the sell zone after the ABC structure appears complete.
⟡ Market structure
The chart shows gold moving inside a rising channel after a strong recovery from the lower base. Price created a clean bullish sequence, pushed into the upper resistance zone around 4,190–4,195, and then started to slow down.
This area is important because it aligns with the marked sell zone and the possible completion of the latest Elliott structure. Price has already touched the upper part of the channel, which means the risk of a corrective pullback is now higher.
The nearest support zones are 4,143 and 4,107. If gold starts rejecting from the current resistance, these areas may become the next reaction points.
➤ Key levels
◌ 4,190–4,195: sell zone and ABC completion area
◌ 4,179: current price reaction zone
◌ 4,143: buy scalping resistance / first pullback zone
◌ 4,107: lower support and wave C reaction zone
◌ Above 4,195: area where the sell reaction setup weakens
⌁ Elliott Wave view
From an Elliott Wave perspective, gold appears to have completed a 5-wave recovery into the upper channel zone. After that, the current structure can be read as an ABC corrective phase forming near resistance.
Wave A shows the first pullback from the high.
Wave B may be the rebound back into the sell zone.
Wave C may develop lower if sellers defend the 4,190–4,195 area.
If this wave count is correct, gold may start a corrective move back towards 4,143 first, then 4,107 if selling pressure expands.
▸ Trading scenario
Preferred scenario: wait for price reaction around the 4,190–4,195 sell zone.
Sell reaction zone: 4,190–4,195 if bearish confirmation appears
Stop loss: above the confirmed rejection high
Take profit 1: 4,143
Take profit 2: 4,107
Take profit 3: 4,080 if wave C expands deeper
Alternative scenario: if gold breaks above 4,195 and holds with strong acceptance, the ABC sell setup loses quality. In that case, price may continue extending inside the rising channel before forming a new structure.
⌁ Kelly’s view
For Kelly, this is not a clean place to chase buy anymore. The recovery has already reached the upper resistance area, and the ABC structure may be near completion.
The cleaner plan is to watch how gold reacts around 4,190–4,195. If rejection appears, a short-term corrective pullback can develop from this zone.
Gold has completed a strong recovery.
But near the sell zone, the next meaningful move may be a corrective wave lower.
Share your view below. Short 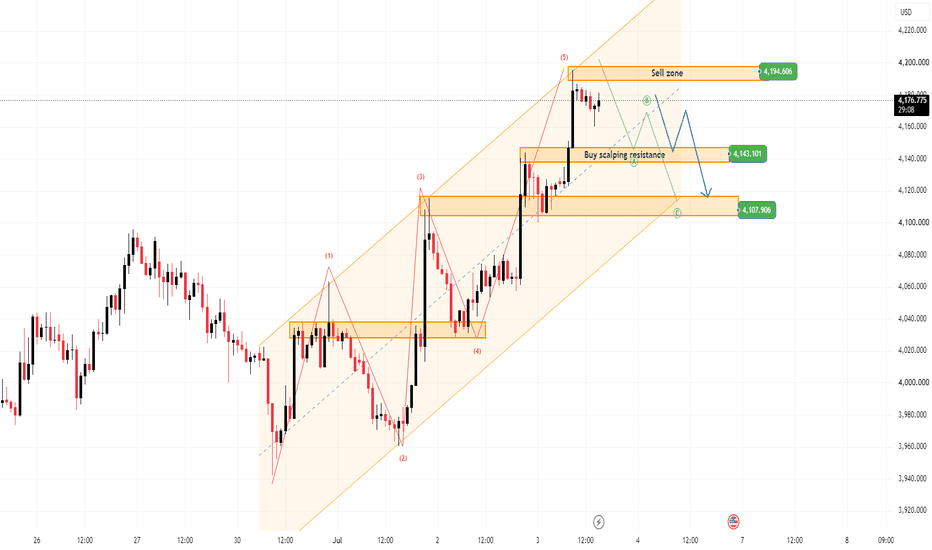
GOLD bullish Elliott Wave forming in rising channelXAUUSD: Bullish Elliott Wave Is Building Inside the Rising Channel
Gold is now showing a stronger recovery structure after breaking away from the previous bearish channel. From Kelly’s view, the market is developing a bullish Elliott Wave sequence, with price moving inside a rising channel and preparing for a possible continuation phase.
The key idea is simple: gold is bullish in the short term, but price may still pull back once more to test the rising trendline before the next upside wave expands.
⟡ Market structure
The chart shows a clear shift from the earlier downtrend into a rising channel. After forming the lower base near the end of June, gold created higher highs and higher lows, showing that buyers are gradually taking control.
Price is now trading around 4,067, after reacting from the buy wave 5 area. The structure remains constructive while gold holds above the lower channel support.
The current move may still need one more retest towards the rising trendline or the buy wave 5 zone before the next push higher. If buyers defend this area, the market may continue towards the liquidity resistance zone around 4,100–4,120.
➤ Key levels
◌ 4,025–4,040: buy wave 5 and trendline reaction zone
◌ 4,067: current price reaction area
◌ 4,100–4,120: liquidity resistance zone
◌ 4,175–4,210: higher resistance and wave 5 completion area
◌ Below 4,025: area where the bullish channel structure weakens
⌁ Elliott Wave view
From an Elliott Wave perspective, gold appears to be forming a bullish 5-wave structure after completing the previous bearish phase.
Wave 1 created the first upside push.
Wave 2 corrected back into the lower channel support.
Wave 3 expanded strongly into the liquidity zone.
Wave 4 is now developing as a short pullback.
If the trendline holds, wave 5 may begin from the buy zone and push price towards the upper channel area.
There is also a possible ABC path after wave 5 completes near resistance. For now, the bullish wave structure remains valid as long as price continues to respect the rising channel.
▸ Trading scenario
Preferred scenario: wait for price to retest the rising trendline or the 4,025–4,040 buy zone and show bullish confirmation.
Entry zone: 4,025–4,040 if bullish confirmation appears
Stop loss: below the confirmed trendline reaction low
Take profit 1: 4,100–4,120
Take profit 2: 4,175
Take profit 3: 4,210 if wave 5 expands strongly
Alternative scenario: if gold breaks below 4,025 and fails to reclaim the rising channel, the bullish Elliott setup weakens and the chart may need a new short-term reading.
⌁ Kelly’s view
For Kelly, this is a buy-the-pullback structure inside a rising channel. The market has already shifted away from the old bearish rhythm, but the cleaner setup may come after one more controlled retest of the trendline.
Gold is building a bullish Elliott structure.
If the rising channel holds, the next upside wave may continue towards the upper liquidity zone.
Share your view below. Long 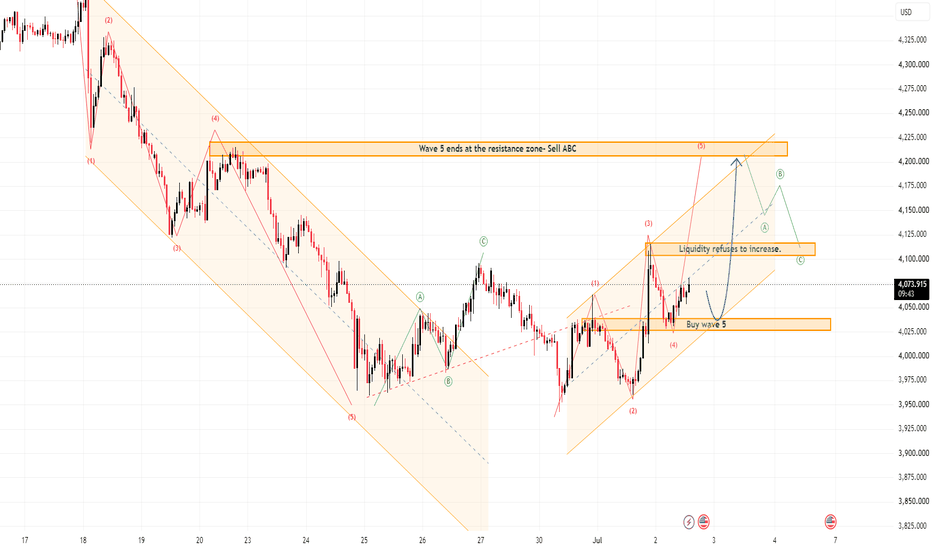
 Long
Long
 Long
Long
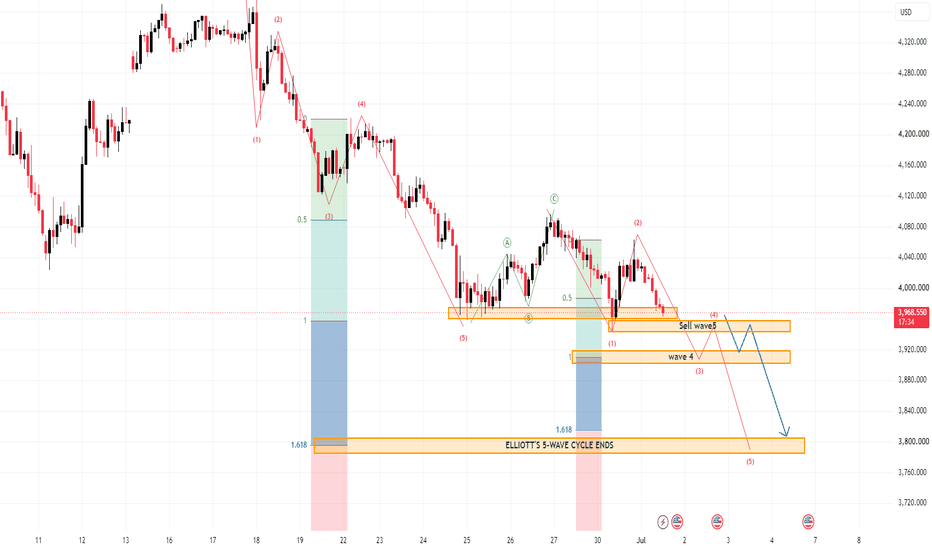
XAUUSD: Elliott bearish wave developing.Gold is still trading under pressure after failing to hold the recovery structure above the 4,000 area. From Kelly’s view, the current chart is forming a bearish Elliott wave sequence, and price is now moving inside the next downside phase.
The key idea is simple: gold remains weak while price stays below the 3,970–3,980 resistance area, and the lower Elliott wave target is still open.
⟡ Market structure
The chart shows gold moving in a clear lower-high and lower-low structure. After the previous rebound failed near the 4,080 area, price rotated lower and is now trading back around the 3,960 zone.
The current resistance around 3,970–3,980 is important because it sits near the sell wave 5 zone. If buyers cannot reclaim this area, the market may continue following the bearish structure towards the lower support zone.
The downside area around 3,790–3,800 remains the main Elliott wave completion zone on the chart.
➤ Key levels
◌ 3,970–3,980: near-term sell wave 5 resistance
◌ 3,930–3,940: wave 4 reaction area
◌ 3,960: current price reaction zone
◌ 3,790–3,800: Elliott 5-wave cycle target
◌ Above 4,000: area where the bearish structure starts to weaken
⌁ Elliott Wave view
From an Elliott Wave perspective, gold appears to be building a bearish 5-wave structure after the corrective recovery ended.
Wave 1 created the first downside move from resistance.
Wave 2 corrected higher but failed to reclaim the previous structure.
Wave 3 pushed price lower with stronger momentum.
Wave 4 may be forming as a small consolidation near the current area.
If resistance continues to hold, wave 5 may extend lower towards the 3,790–3,800 zone.
This is why Kelly would not treat the current reaction as a full bullish reversal yet. The market is still trading below resistance, and the Elliott structure still favors one more downside leg.
▸ Trading scenario
Preferred scenario: wait for price to reject from the 3,970–3,980 sell zone before expecting wave 5 continuation.
Sell zone: 3,970–3,980 if bearish confirmation appears
Stop loss: above 4,000 or above the confirmed rejection high
Take profit 1: 3,930
Take profit 2: 3,880
Take profit 3: 3,790–3,800
Alternative scenario: if gold breaks above 4,000 and holds with strong acceptance, the bearish wave 5 setup weakens and the chart may need a new short-term reading.
⌁ Kelly’s view
For Kelly, this is still a bearish Elliott structure. The market has not shown enough strength to confirm a reversal, and the current reaction is happening directly below resistance.
As long as gold stays below the sell wave 5 zone, the cleaner structure remains to the downside.
Gold is still forming a bearish wave sequence. If resistance holds, the final wave may continue towards the lower Elliott target.
Share your view below. Short