Fed Rate Cut and Impact on India's Bond Yields, INR and EquitiesThis video gives an overview of how Indian economy performed during the post covid era, vis-a-vis other countries and using that performance as a benchmark, it explains that as US starts to cut rates, how Indian economy, bonds, currency and equities will likely perform
ETF
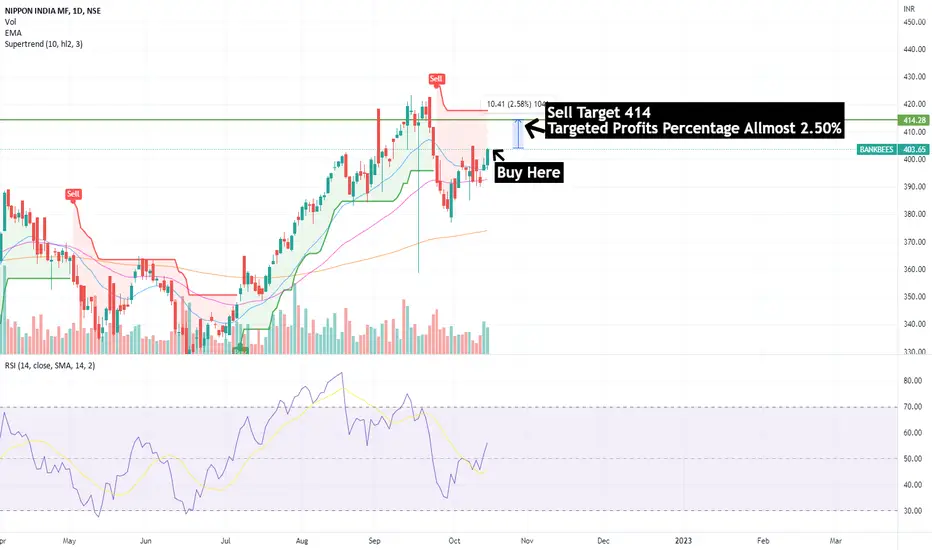
BankBees ETFHello,
For the conservatives and portfolio holders this is a BANKBEES technical chart analysis.
Pressure in the banks and take it to the channel bottom. More pressure can lower it to the yellow channel.
Upside looks excellent based on global cues and market sentiments.
Buying:
Closer to the channel bottom.
$BTC | 1H: Today PlanSellers have dominated the #Bitcoin today, leading to a bearish trend with more red candles expected.
However, a potential bounce is expected around the $61k POI as Bitcoin ETFs are set to launch in Hong Kong tomorrow. LFG!
Previous Day:
VAH: $63960
POC: $63667
VAL : $63440
Date: 29 Apr 2024
Hang Seng Tech - Defining MomentHSTECH has gone through a deep correction in last few years.
My wave counts suggest that the bottom has been made and it's the beginning of the next leg up/ or at least a big enough pullback of the entire fall - in any case a good bullish trade.
We have completed Wave 1 and 2 and Wave 3 has begun.
Within wave 3, just minor 1 and 2 have been done and we are in 3 of 3.
View negates if we break 2990.
MAHKTECH is an ETF in India for trading this index.
Disclaimer: Invested.
HLong
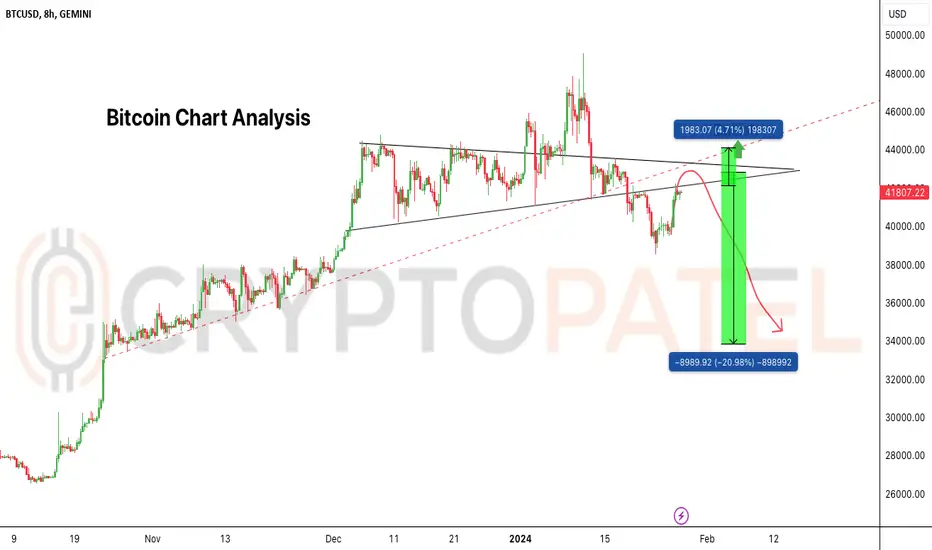
Bitcoin LTF Chart Analysis#BITCOIN LTF Bearish Update:
CRYPTOCAP:BTC Currently Trading in Bearish as per Fractals.
If this Bearish Fractals work then Next Stop will be at $36800
Current Sequence According This Fractals:
$40800 ➡️ $36800 ➡️ $38800 ➡️ $35000
Note: LTF Fractals Invalidated if #BTCUSDT 2H candle Closed above $41000
IBuyThe selling created in past 2 year which took support and in 2023 has formed a good trendline support.
Though it has good formed higher low pattern but the recent move was looking for a little breather before breaking out the near term resistance.
up move beyond resistance may not be challenging as supply area are less.
Bitcoin Bullish Triangle But High Volatile in next Few DaysAttention #Bitcoin traders!
Stay cautious, as the market is about to get super volatile. It's highly recommended to steer clear of leveraged positions to avoid potential risks.
What are your thoughts on #BitcoinETF? Share your insights and let's discuss!
Remember, always prioritize risk management in your trading strategies.
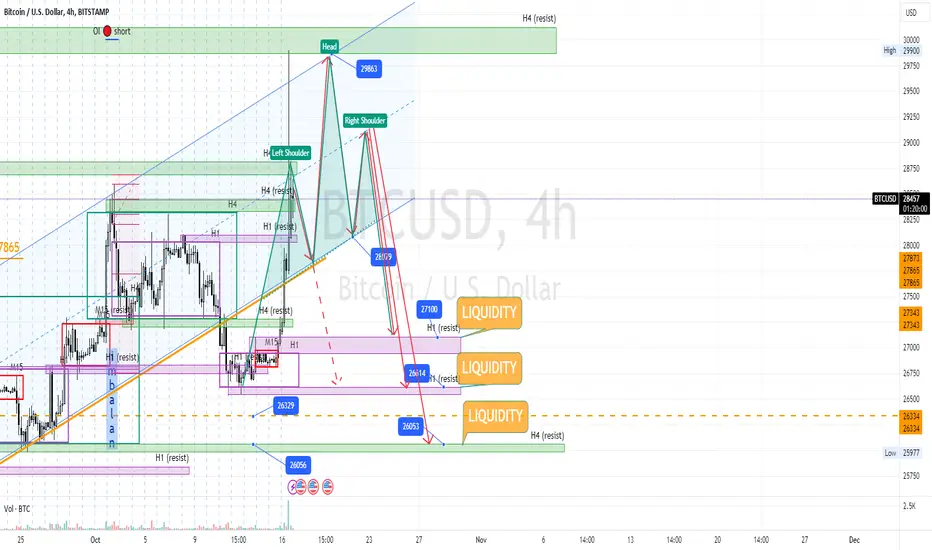
Bitcoin manipulation and scenarios of further price movement 🔥Monday started very stormy for the crypto market.🔥💥⚡️📉
And it showed that not only Elon Musk can manipulate the market. 😆 And while waiting for positive news, a random fake can create a storm in the desert. What happened today, when Mr. Bitcoin flew from 27.9k to 30k. The truth came out within 5 minutes, regarding BTC-ETF, and the price returned back, from where it started its flight "to heaven".
🗣What is my opinion: We have a lot of uncollected liquidity left at the bottom, which is needed, at
ETF: A Comprehensive Guide to Exchange Traded Funds in IndiaExchange Traded Funds, or ETFs, are investment funds traded on stock exchanges, much like individual stocks. They are designed to track the performance of a particular market index, such as the NIFTY 50 or Bank Nifty, or a specific sector, such as technology or healthcare.
17/10/2022 Research Report For BankbeesDisclaimer:
I am not SEBI registered person and this is not an investment advice and also please note this is only for education purpose. Also note we can use this research in my own portfolios. So don't influence yourself by this research. Please note before investing according to this educational research, please do own research and also do take advice from your financial adviser. Your any profits and loss are totally your liability. No one is liable for that. Also, please note we will not nev
Technical ANalysis of XLEDisclaimer: I don't own shares of XLE . This analysis is not a trading or investing recommendation & is only for educational purpose.
1. XLE has been going up slowly & steadily since Mar’20 after putting a bullish 1-2-3 pattern marked by the successful break of point#2 of the pattern.
2.In Jan 2022 price crossed a major downtrend resistance line (dotted line) that has been valid since July 2014.
3.Price then re-tested the resistance converted support in the week of 18-Jan-22 & failed to break t