GLOBUSSPR bearish Pattern on Weeklyit has formed evening star on weekly chart. rallied far away from 20WMA. so it seem mean reversion is happening now. it can fall upto 910 -1050 zone for support.
on daily chart we can see lower high formation. and if it starts trading below last close price. confirms it is forming lower lows.
Evening Star
JUBLINGREA Eveningstar on Montlyit is forming evening star on monthly chart. if it closes below 670 on monthly basis to confirm evening star. otherwise pattern invalid.
first monthly red candle after it's listing.
we may see a pull back or consolidation from here on.
big red candle today with volume.
700 acts as good support. if it breaks, it can go down till next fib retracement level.
Levels for - 27 Sep 2021EXPLANATION : This is a 1 hour time frame chart of HDFCBANK . It has formed Evening Star Doji Pattern , It signal a more bearish trend than the evening star pattern because of Doji that has appeared between the two bodies .
If you like this analysis of Stock give a Like // Follow for more updates , let me know in comments below :)
Trend reversal pattern signals seen in BajFinanceUpTrend reversal pattern signals seen in BajFinance
Reasons :
Daily chart trend closed below 5 MA
Evening star candle stick formation seen with today close
Earlier 2 inverted cross doji's formed and not activated yet
Rally is paused after 31st August
Volume Decreasing
RSI Decreasing
Trend is far away from 20 and 200 MA
For healthy uptrend, stock has to test retracement of 38.2/50/61.8 Fibanocci levels
Stock did not retrace since 16th August
What can happen next :
Scenario 1 : Below 7414, it can go till 6890/6711 (if we consider 7615 as retest on 6th Sep for the high made on 1st Sep 7674.50)
Scenario 2 : Can retest 7615/7675 before going down
For any further uptrend 0.382 levels needs to be tested..
Lets see..
Disclaimer : This analysis is only for educational purpose and not be considered as any trading idea/tip. Please consult your financial advisor before you take any trade and we are no way responsible for your profits/losses. Thank you!
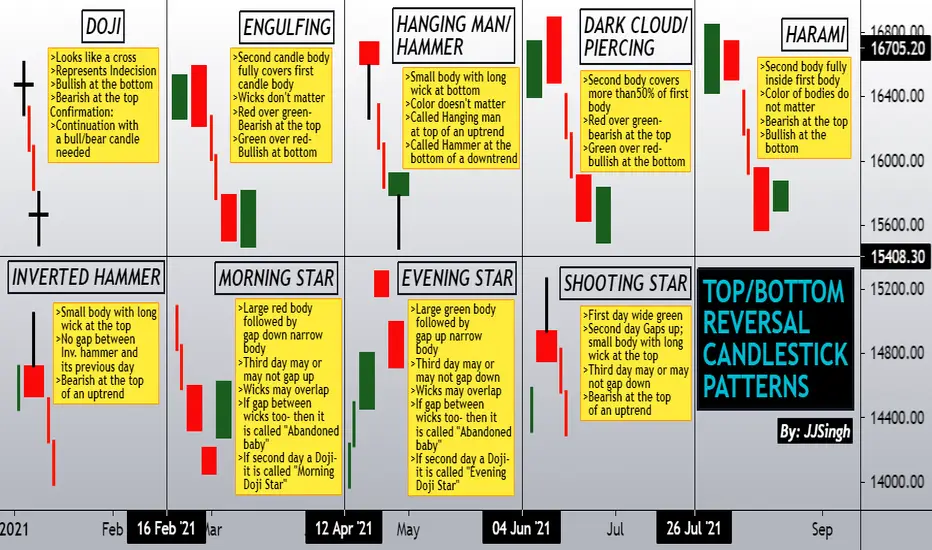
TOP/BOTTOM REVERSAL CANDLE PATTERNSHi
Its been a while since my last post. In this post I have represented selective candlestick reversal patterns.
In a candlestick, "body" represents the distance between candle OPEN and CLOSING price. Whereas "wicks" represent the entire range of the candle from TOP to the BOTTOM.
In most of these patterns only bodies are important. There are no conditions for wicks unless specifically mentioned like in abandoned baby star and (first two candles of) shooting star pattern. In an abandoned baby star pattern the wicks of the second day should not overlap with the wicks of first and third day. But there can be wick overlapping in morning and evening stars where the condition is for bodies only.
Similarly in shooting star, the second day should not overlap with the first day (not even wicks) whereas the third day may have some overlapping.
One should always try these patterns with some sort of confirmation in the form of volume or overbought/oversold scenarios etc. While taking a trade based on these patterns one should follow money management and trade management principles.
I hope this post will update your knowledge in one way or the other.
Do not forget to like and comment (for any doubts) to encourage writing on trading view.
Regards
JJSingh
WaveTalks-Nifty-The Evening Star / Wedge CollaborationThis short video explains how the evening star turns into a wedge pattern. If correct, downside 16590 was critical support, holding above Nifty could bounce back again to 16680-16700. On the upside, Holding below 16712 highs, It can attempt to fall back again to 16615-16625 & assuming that if Index falls below 16590-critical support, it can fall to 16500 / 16440 / 16400 levels
When you splash around the water, you get to hear a peculiar sound which you heard over the video at the start.
I have compared that sound of up & down in Nifty Index to water pool splash. This scenario in technical analysis is called a wedge pattern
What Is a Wedge?
A wedge is a price pattern marked by converging trend lines on a price chart. The two trend lines are drawn to connect the respective highs and lows of a price series throughout chosen periods. The lines show that the highs and the lows are either rising or falling giving the appearance of a wedge as the lines approach a convergence. Wedge-shaped trend lines are considered useful indicators of a potential reversal in price action.
Elliott Wave Analysis
These wedges are further classified as Type 1 / Type 2 diagonal (wedge). Depending on the position of the structure unfolding. They are called
(Type 1)Leading Diagonal – Start the price move
(Type 2)Ending Diagonal - End the price move
-------------------------------------------------------------------
Last Video Idea - Nifty Bearish Bat Harmonic Pattern
-------------------------------------------------------------------
DOUBLE TOP FOR BECTOR FOOD- POSSIBILITY OF SHORT TERM REVERSALBECTORFOOD has fallen to a low of 328 in March 2021 and has been Bullish since then. It has reached a High of 445 in June and has retraced from the resistance zone at 442-452 range to a low of 395.
Now it has reached the resistance zone again and has made a Bearish Pin Bar that is half of the Evening Star Candle Stick Pattern. There is also a Bearish Divergence. So short term the pattern is bearish.
To go long we have to wait for break of the resistance zone at 442-452 range and wait for a retest and can go long on a confirmation Bullish Candle for Targets of 502.
Hindalco Has Broken Out of Falling Wedge Pattern BullishHindalco has been falling from its ATH of 427.50 from 10th May onwards and has made a Falling Wedge Pattern.
It has broken above with good volumes but the point to note is that it has gapped up and made a spinning top like candle in the 1Hr and 2 Hr candles which is half of the Evening Star Candle Pattern. So in the short term it could see a reversal.
So it would be prudent to go long only after a retest of the trendline and a Bullish confirmation candle for the following targets.
T1-405.50
T2-427.50
Mentorship InstaView 16 June’21: Indeed an Evening Star
Nifty View: As expected today’s 100 points sell-off from the benchmark Nifty index has lead to an “Evening Star” pattern on the daily time frame. This three candlestick pattern is bearish and suggests further price weakness. A confirmation of this will come once the price breaks below today’s low of 15,766. Do not get too carried away with this bearishness as the index is still in a strong UP trend and these candlestick patterns are prone to failures. Having said this, keeping in mind the nature of today’s sell-off (especially in the final 30mins), an extension on the downside is very much likely for a test of 15,700 or further down. We will get a much clearer and confirmed picture once today’s low gets compromised. Till then it’ll be prudent to stay cautious (as advised since the past few sessions) and wait for better opportunities.
Thank you for following my work and please feel free to share your thoughts and suggestions.
Trade Well. Trade Wise.
Nifty InstaView 15 June’21: Evening Star?
Nifty View: Benchmark Nifty opened well in today’s session and that's all that it did. There was a dash of some intraday volatility, but overall the index faired well to hold onto the minor gap up with which it opened in today’s session. On the daily chart, we have a possibility of an “Evening Star” only and only if the index opens below 15,836 and stays below. But that is just anticipation. The facts of price support the underlying UP trend and with momentum one can expect further upsides. Price-momentum divergence persists which has so far not lead to any serious damage, but short term dips. Strategically makes sense to stay cautious with an overall positive bias. Banks, especially Private sector banks need to play an important role if upsides from Nifty has to continue.
Thank you for following my work and please feel free to share your thoughts and suggestions.
Trade Well. Trade Wise.
Evening star in HindalcoAfter a spectacular rally in Hindalco, we can see an evening star pattern being formed.
Look at the nice red candle formed after the evening star, confirming the pattern's validity.
In my view, it will not go in a reverse direction forever but will only take a pullback.
Target: 230.
(After that trail SL till 210)
SBI to reverse after an evening starSBI formed an evening start after an uptrend and is likely to fall till the next strong resistance.
Initiate short calls.
Sell at 193.5. Target at next resistance, ie, 182. Stop loss at 50 DMA, ie, 197.
NOTE: Supreme court to have a hearing on the interest waiver case. NSE:SBIN