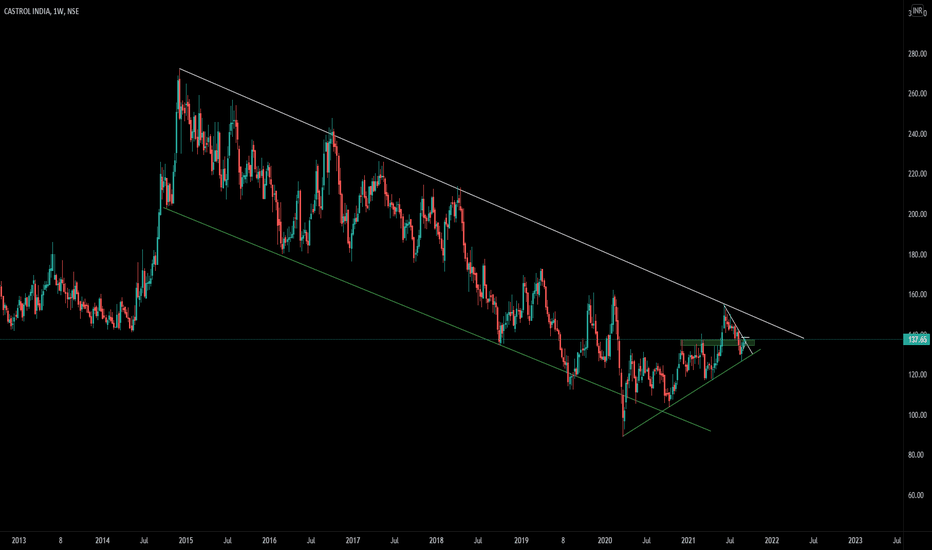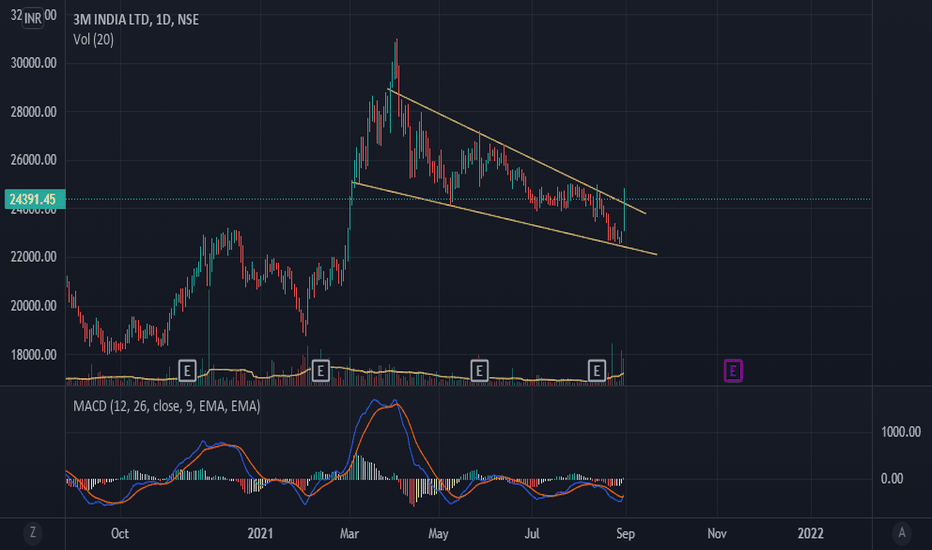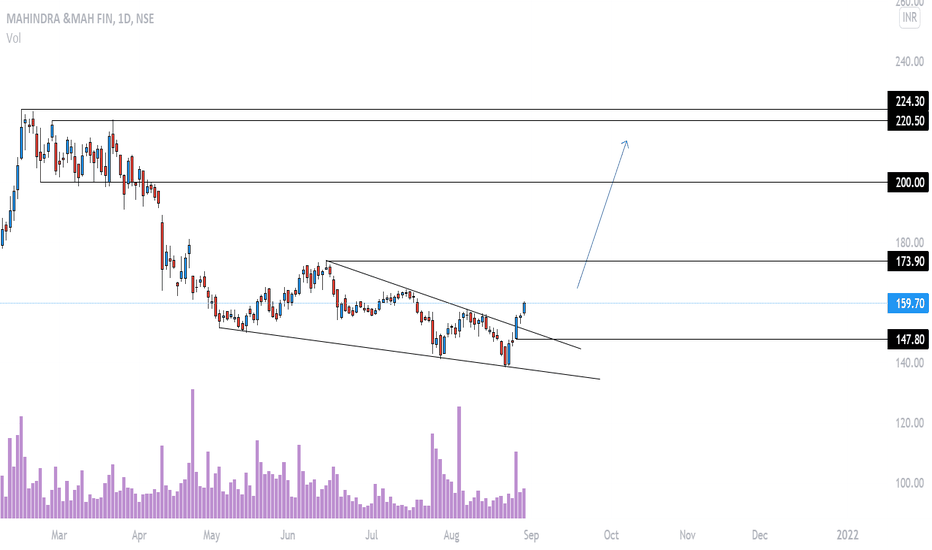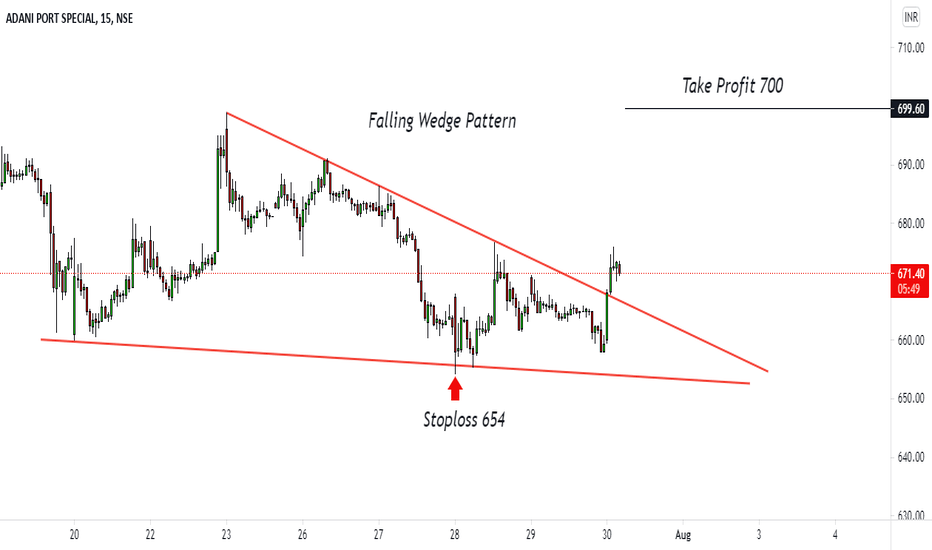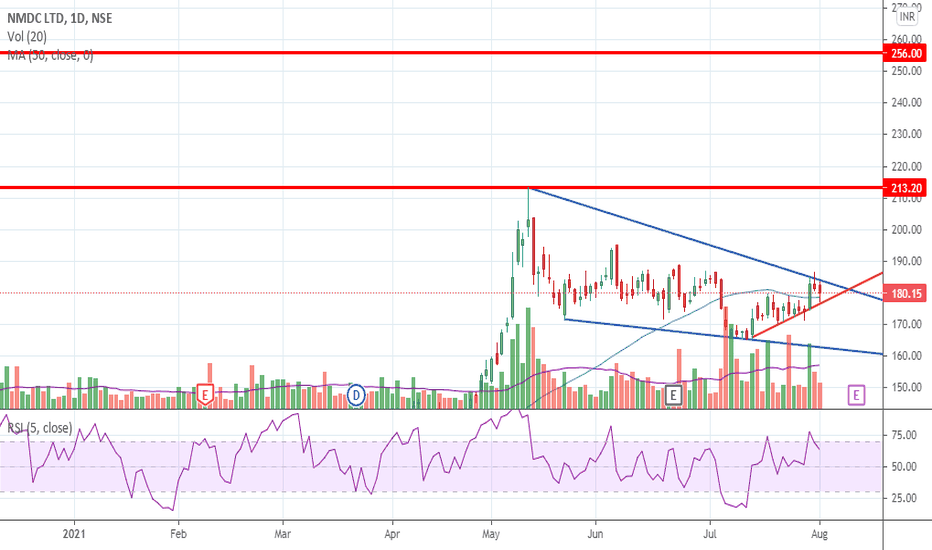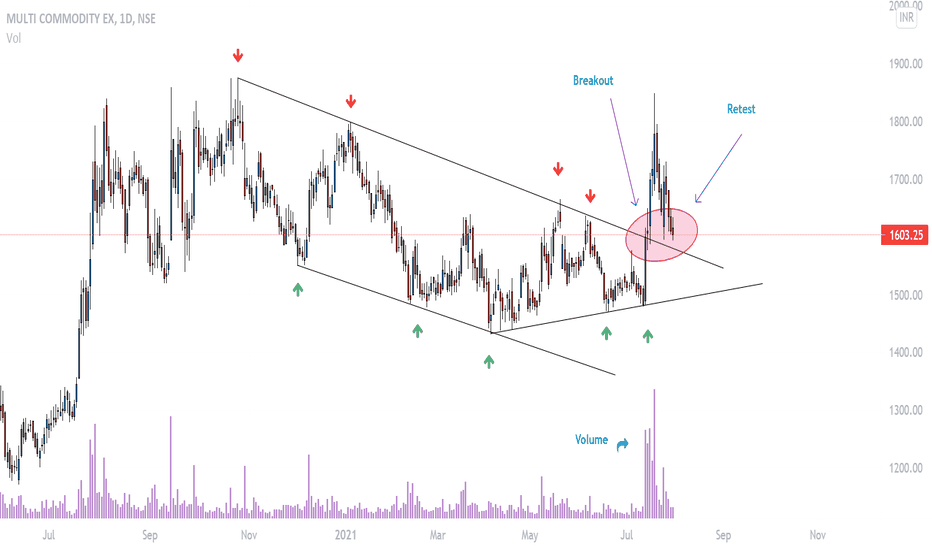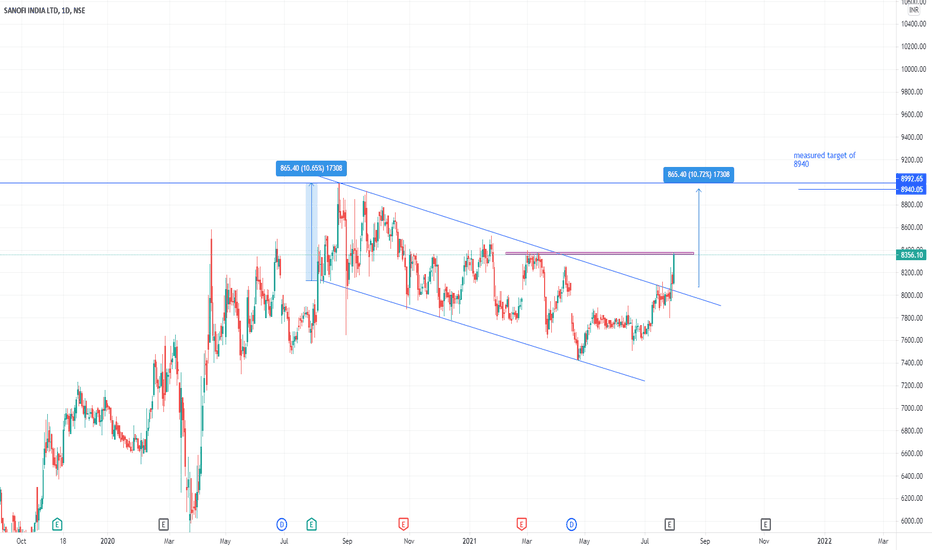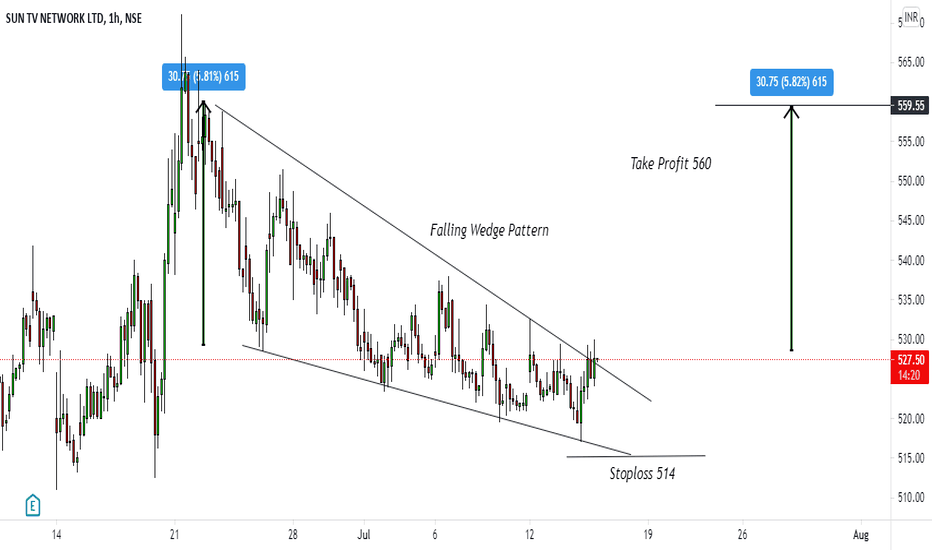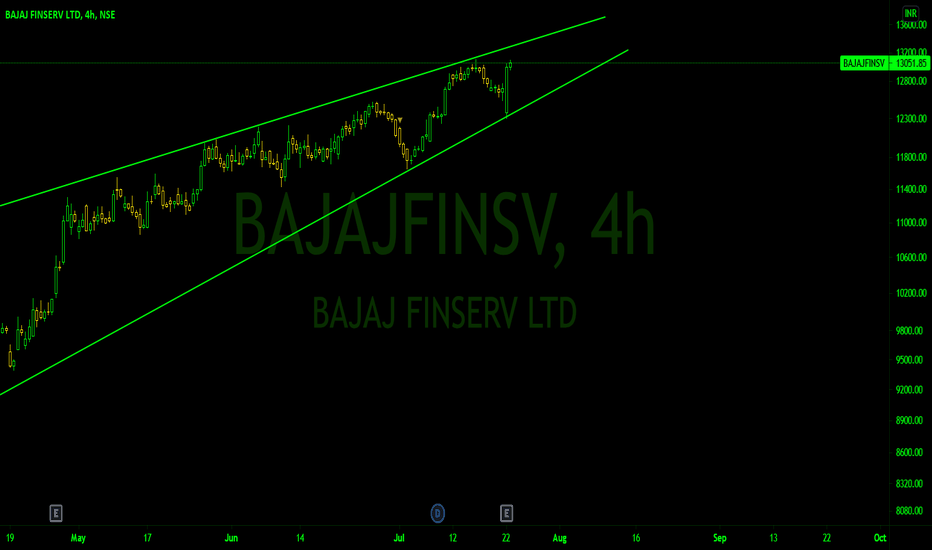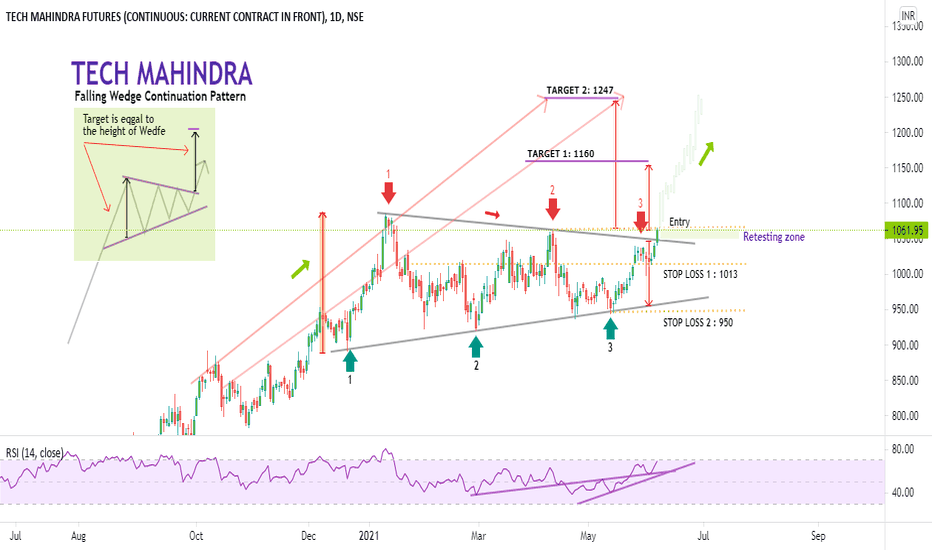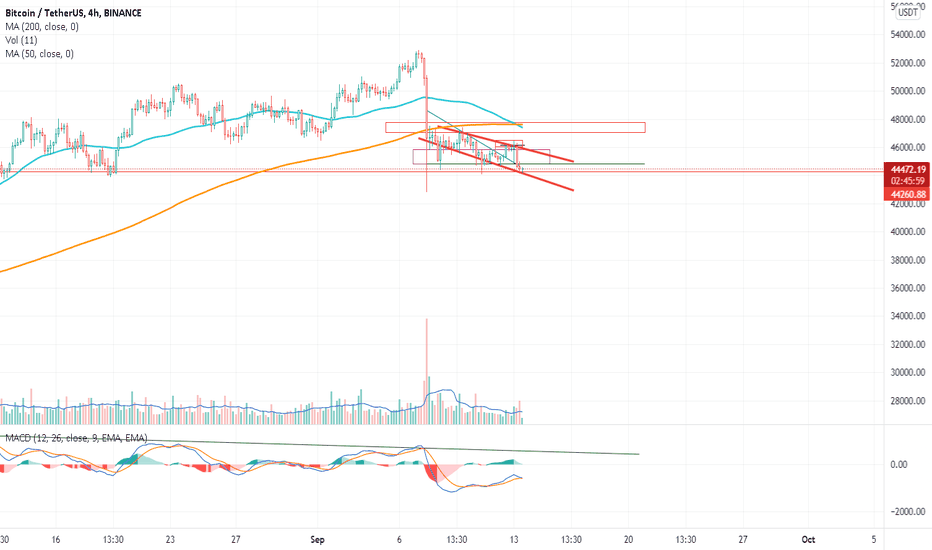
Falling Wedge
#WRX/USDT CHART Breakout Coming!!!Hello guys in chart you can see it is forming "Falling Wedge Pattern", if this pattern gets breakout than its take profit target would be $1.68....So guys just keep eyes on WRX.
WLong
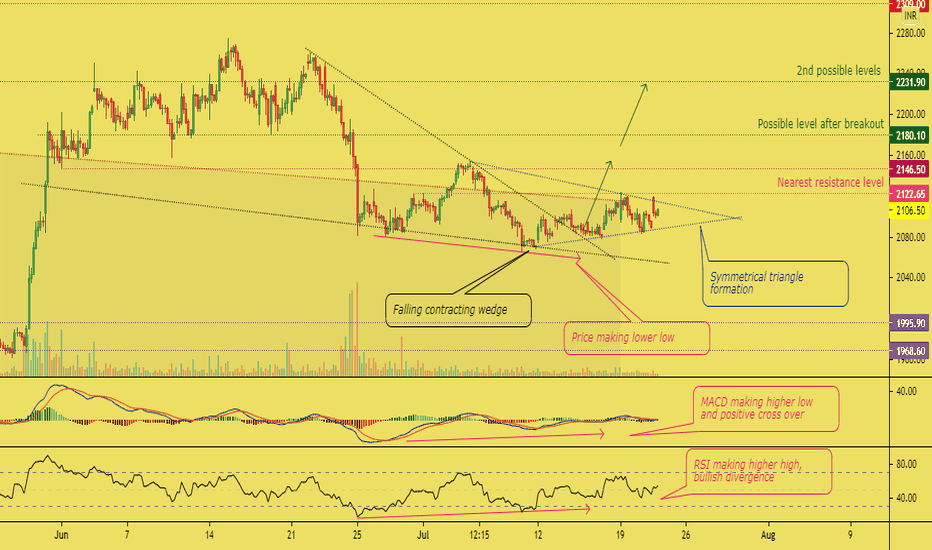
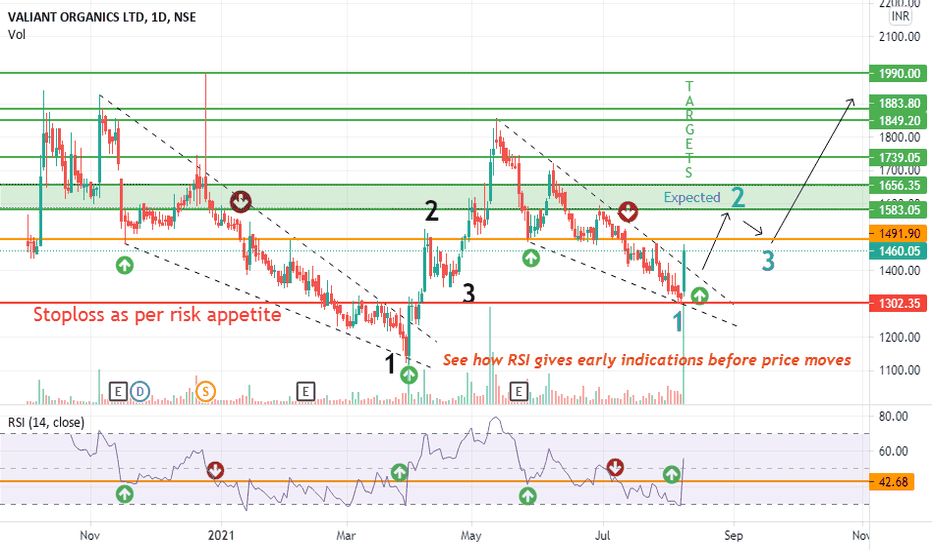
Reliance good long candidate conditional longReliance spot cmp 2105
counter have formation of falling contracting wedge ,, where the breakout and retest is done,, currently counter is trading in symmetrical triangle formation,, break out of which would lead to good up move,,
Rsi and MACD giving early indication with bullish divergence
MAcd positive Crossover,,
Good long criteria buildupp,,
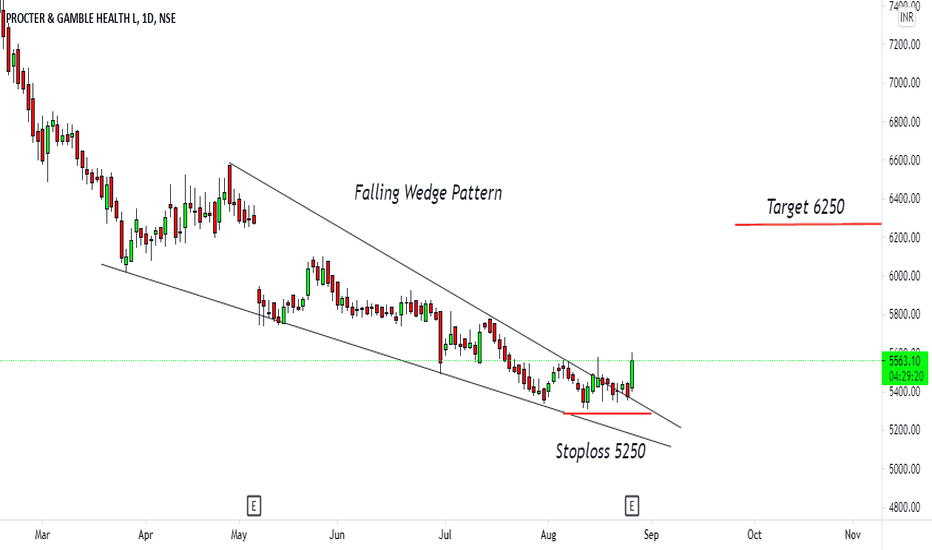
Bandhan Bank Trading in a Falling Wedge Pattern.Bandhan Bank Trading in a Falling Wedge Pattern.
Since the inception of this scrip, it has traded/followed the falling wedge pattern. There isn't any incentive to go long until there is a decisive breakout out of this falling wedge pattern. Decisive breakout means breakout out of the channel on upper side (for long), and then another candle confirming breakout on a weekly time frame. Also, you can see it has taken support and rejection from the dotted trendline drawn inside the wedge. If the breakout happens this week followed by a confirmation candle next week, go long. Immediate targets (remember its a weekly time frame) should be 365, 430, and 537.
I do see it breaking out very soon as lot of other indicators are in favor of breakout. But we never trade perceptions or predictions or for that matter opinion, we trade when price action tells us to.
Disclaimer: The information provided herein is for educational purpose. Please consult your financial advisor before making any decision.
If you like the idea, give me a thumbs up and share it with others. You can choose to follow me too.
Comments and Criticism are welcome.
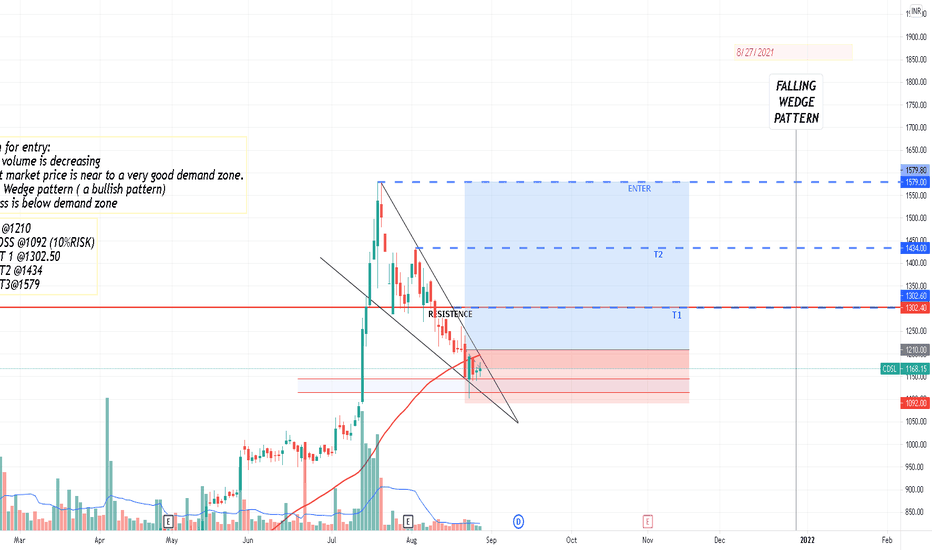
DONT MISS THIS TRADE IN CDSL!Chart pattern: FALLING WEDGE
The current market price(CMP) is below 50SMA which is Bearish.
Make sure you enter above 50SMA for an uptrend move.
The sellers volume is decreasing soon Bulls we can expect bulls to come
Can expect maximum 35%return with a risk of 10%
CDSL is Fundamentally strong company
Dividened date is on 5th September. 9rs per share
PIOTROSKI SCORE :8
Stock P/E 56.0
ROCE 32.4 %
Source screener.in
Disclaimer this is only for educational purpose.
Feel free to ask your doubts
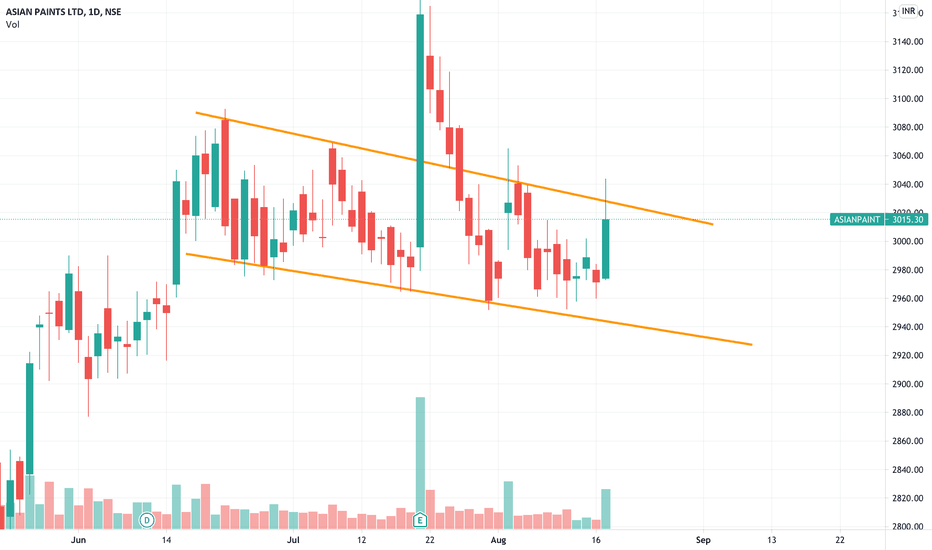
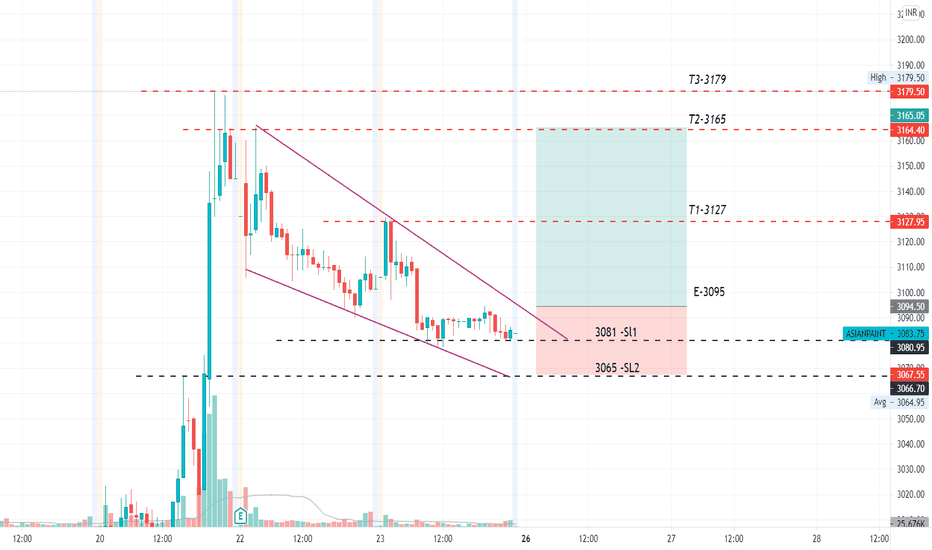
Falling Wedge Pattern on Asian PaintsAfter the Earnings Shoot-up, Asian paints has retracted a bit to its 0.5Fib levels forming a Double Bottom and a Falling wedge.
Asian Paints has an ideal condition where it never believes in having a proper breakout(*sarcasm*), so in the upcoming week if the bull run starts , a gap can be seen on Asian Paints at the starting of the day which can ideally be verified as a breakout but it will try to retest it 3097 which can be a good entry point as well.
Markets are a bit volatile these days for enter only if you see a proper breakout or a retest.
3127 and 3165 are good target levels. Keep Stop loss in place as well.
breakout done, bitcoin looks good to strong bullish impulse moveTechnical analysis:
Welcome to this quick update everyone,
In Daily timeframe Chart,
Falling WEDGE upside Breakout Already Done ✅
Finally, RSI Indicator Broke the 7 Months Downtrend ✅
bitcoin sentiment is turned into buying on dips mood, Bitcoin could break to the 50 DMA. This level may attract selling from the bears but if bulls can overcome the resistance and push the price above it, the relief rally could rise to $36,670 and then 41194
🥰If you find this helpful and want more FREE forecasts in Tradingview😍.
Please show your support back🙏,
Hit the 👍 LIKE button,
Drop some feedback below in the comment✍️!
❤️🤝 Your Support is very much 🙏 appreciated!❤️🤝
💎 Want me to help you become a better Crypto trader?
Now, It's your turn!
Be sure to leave a comment; let me know how you see this opportunity and forecast.
Trade well, 💪
#bitcoin #crypto #nextmove #bullmarket #sideways #btcusdt #dailyclosed