GIFTNIFTY Short Range /Intra-Swing Level Analysis 08th APR 2026GIFTNIFTY Short Range /Intra-Swing Level Analysis for 08th APR 2026
━━━━━🟥🟧🟨🟩🟦🟪⬛━━━━━
💥Level Interpretation / description:
✍🏻L#1: If the candle crossed & stays above the “Buy Gen”, it is treated / considered as Bullish bias. Cfm=> Confirmation.
L#2: Possibility / Probability of REVERSAL near 🔕RL/TF1 & 🔔RL/TF2
L#3: If the candle stays above “Sell Gen” but below “Buy Gen”, it is treated / considered as Sidewise. Aggressive Traders can take Long position near “Sell Gen” either retesting or crossed from Below & vice-versa i.e. can take Short position near “Buy Gen” either retesting or crossed downward from Above.
L#4: If the candle crossed & stays below the “Sell Gen”, it is treated / considered a Bearish bias.
L#5: Possibility / Probability of REVERSAL near 🔕RL/TF1 & 🔔RL/TF2
HZB (Buy side) & HZS (Sell side) => Hurdle Zone,
✍🏻 *** Specialty of “HZB#1, HZB#2 HZS#1 & HZS#2” is Sidewise (behaviour in Nature)
Rest Plotted and Mentioned on Chart
Color code Used:
Green, BLUE =. Positive bias.
Safron, RED =. Negative bias.
RED in Between Green means Trend Finder / Momentum Change
/ CYCLE Change and Vice Versa.
Notice One thing: HOW LEVELS are Working.
Use any Momentum Indicator / Oscillator or as you "USED to" to Take entry.
━━━━━🟥🟧🟨🟩🟦🟪⬛━━━━━
⚠️ DISCLAIMER:
The information, views, and ideas shared here are purely for educational and informational purposes only. They are not intended as investment advice or a recommendation to buy, sell, or hold any financial instruments. I am not a SEBI-registered financial adviser.
Trading and investing in the stock market involves risk, and you should do your own research and analysis. You are solely responsible for any decisions made based on this research.
"🔔As HARD EARNED MONEY IS YOUR's, So DECISION SHOULD HAVE TO BE YOUR's".
━━━━━🟥🟧🟨🟩🟦🟪⬛━━━━━
❇️ Follow notification about periodical View
💥 Do Comment for Stock WEEKLY Level Analysis.🚀
📊 Do you agree with this view?
✈️ HIT THE PLANE ICON if this technical observation resonates with you. It will Motivate me.
━━━━━🟥🟧🟨🟩🟦🟪⬛━━━━━
💡 If You LOOKING any CHART & want for Level and ANALYZE?
Share your desired stock names in the comments below! I will try to analyze the chart Levels, patterns and share my technical view (so far my Knowledge).
If Viewers think It can identify meaningful setups. Looking forward to hearing from all of you — let's keep this discussion going and help each other make better trading decisions.
___________🔕^^^⚫⚪^🙏🏼🙏🏼🙏🏼^⚪⚫^^^🔔___________  Short
Short
SENSEX Short Range Level Analysis for 08th APR 2026SENSEX Short Range Level Analysis for 08th APR 2026
Amid USA+Israel Vs. IRAN War.
━━━━━🟥🟧🟨🟩🟦🟪⬛━━━━━
💥Level Interpretation / description:
✍🏻L#1: If the candle crossed & stays above the “Buy Gen”, it is treated / considered as Bullish bias. Cfm=> Confirmation.
L#2: Possibility / Probability of REVERSAL near 🔕RL/TF1 & 🔔RL/TF2
L#3: If the candle stays above “Sell Gen” but below “Buy Gen”, it is treated / considered as Sidewise. Aggressive Traders can take Long position near “Sell Gen” either retesting or crossed from Below & vice-versa i.e. can take Short position near “Buy Gen” either retesting or crossed downward from Above.
L#4: If the candle crossed & stays below the “Sell Gen”, it is treated / considered a Bearish bias.
L#5: Possibility / Probability of REVERSAL near 🔕RL/TF1 & 🔔RL/TF2
HZB (Buy side) & HZS (Sell side) => Hurdle Zone,
✍🏻 *** Specialty of “HZB#1, HZB#2 HZS#1 & HZS#2” is Sidewise (behaviour in Nature)
Rest Plotted and Mentioned on Chart
Color code Used:
Green, BLUE =. Positive bias.
Safron, RED =. Negative bias.
RED in Between Green means Trend Finder / Momentum Change
/ CYCLE Change and Vice Versa.
Notice One thing: HOW LEVELS are Working.
Use any Momentum Indicator / Oscillator or as you "USED to" to Take entry.
━━━━━🟥🟧🟨🟩🟦🟪⬛━━━━━
⚠️ DISCLAIMER:
The information, views, and ideas shared here are purely for educational and informational purposes only. They are not intended as investment advice or a recommendation to buy, sell, or hold any financial instruments. I am not a SEBI-registered financial adviser.
Trading and investing in the stock market involves risk, and you should do your own research and analysis. You are solely responsible for any decisions made based on this research.
"🔔As HARD EARNED MONEY IS YOUR's, So DECISION SHOULD HAVE TO BE YOUR's".
━━━━━🟥🟧🟨🟩🟦🟪⬛━━━━━
❇️ Follow notification about periodical View
💥 Do Comment for Stock WEEKLY Level Analysis.🚀
📊 Do you agree with this view?
✈️ HIT THE PLANE ICON if this technical observation resonates with you. It will Motivate me.
━━━━━🟥🟧🟨🟩🟦🟪⬛━━━━━
💡 If You LOOKING any CHART & want for Level and ANALYZE?
Share your desired stock names in the comments below! I will try to analyze the chart Levels, patterns and share my technical view (so far my Knowledge).
If Viewers think It can identify meaningful setups. Looking forward to hearing from all of you — let's keep this discussion going and help each other make better trading decisions.
___________🔕^^^⚫⚪^🙏🏼🙏🏼🙏🏼^⚪⚫^^^🔔___________ XAUUSD: Bullish Trend ContinuesXAUUSD: Gold Holds Its Recovery Structure as Safe-Haven Demand Stays in Focus
Hello everyone, here is my view on the current XAUUSD setup.
Market Analysis
Gold continues to trade with a constructive tone as the broader market backdrop remains fragile. Even though equities usually benefit from the so-called April effect, the current environment looks much less supportive than usual. Rising energy-driven inflation risks, fading expectations for rate cuts, and concerns over the quality of corporate earnings are all creating pressure on risk sentiment. At the same time, geopolitical tension in the Middle East is adding another layer of uncertainty, which keeps safe-haven flows relevant for gold.
From a technical perspective, XAUUSD is still moving inside a rising channel, and that keeps the short-term bullish structure intact. The recent pullback did not break the broader trend. Instead, price found support again near the lower side of the structure and is now trying to recover back toward resistance.
The key point on this chart is the 4681 area. This is the near-term breakout level that needs to be cleared for the bullish continuation to look stronger. If buyers manage to push price above this zone and hold it, the next upside path opens toward the 4692–4707 resistance area, which is also marked as a liquidity sell zone on the chart.
Even if some selling pressure appears there first, the broader structure still suggests that gold may continue working higher as long as the rising support line remains valid. Above that, the bigger target remains near the monthly high zone around 4775–4800, which is the main upside objective shown on the chart.
So for now, the technical picture still supports a recovery bias. Gold is not breaking down. It is consolidating under resistance while still respecting trend support, and that usually keeps buyers interested unless the structure is lost.
Key Levels to Watch
Current price zone: around 4678
Buy confirmation level: above 4681
Near-term resistance / liquidity zone: 4692–4707
Main upside objective: monthly high around 4775–4800
Trend support / invalidation area: below 4599
My Scenario & Strategy
My preferred view remains bullish while gold continues to hold above the rising trendline. The cleanest setup would be a confirmed breakout above 4681, because that would show buyers are regaining control after the recent consolidation.
If price holds above that level, XAUUSD may continue toward the 4692–4707 resistance area first. A stable reaction there would be important, because if gold absorbs that supply well, the upside move could extend further toward the monthly high zone near 4775–4800.
However, if price slips back below the trendline and loses 4599, the bullish structure would weaken and the market could move into a deeper correction before any fresh recovery attempt develops.
For now, gold still looks supported, the rising structure remains in place, and the market continues to favor the upside as long as trend support is respected.
That’s the setup I’m watching for now. Thank you for reading, and always manage your risk carefully.  Short
Short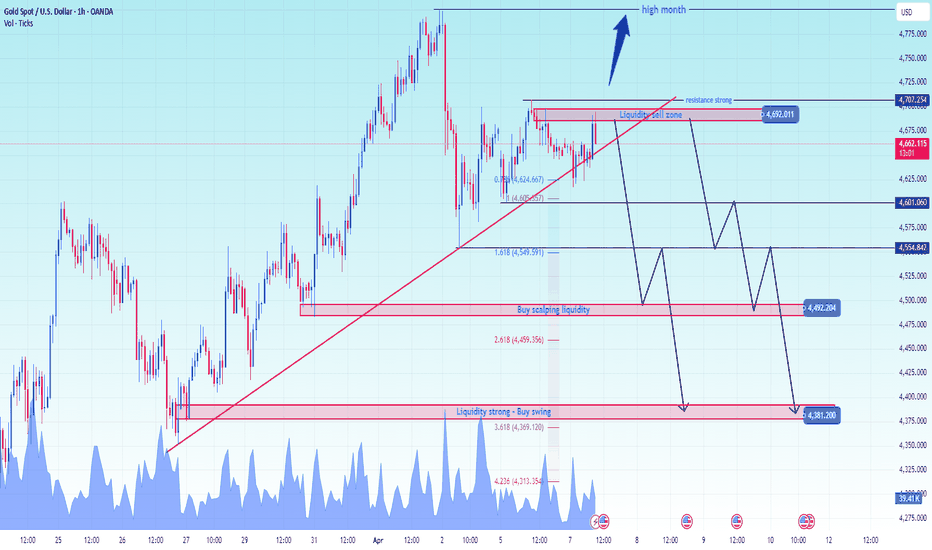
DowJones (DJI) Short Range Levels 07th-08th APR 2026 (1:30 am) DowJones (DJI) Short Range / Intra-Swing Levels 07th-08th APR 2026 (1:30 am)
possible REVERSAL Near 46317
━━━━━🟥🟧🟨🟩🟦🟪⬛━━━━━
💥Level Interpretation / description:
✍🏻L#1: If the candle crossed & stays above the “Buy Gen”, it is treated / considered as Bullish bias. Cfm=> Confirmation.
L#2: Possibility / Probability of REVERSAL near 🔕RL/TF1 & 🔔RL/TF2
L#3: If the candle stays above “Sell Gen” but below “Buy Gen”, it is treated / considered as Sidewise. Aggressive Traders can take Long position near “Sell Gen” either retesting or crossed from Below & vice-versa i.e. can take Short position near “Buy Gen” either retesting or crossed downward from Above.
L#4: If the candle crossed & stays below the “Sell Gen”, it is treated / considered a Bearish bias.
L#5: Possibility / Probability of REVERSAL near 🔕RL/TF1 & 🔔RL/TF2
HZB (Buy side) & HZS (Sell side) => Hurdle Zone,
✍🏻 *** Specialty of “HZB#1, HZB#2 HZS#1 & HZS#2” is Sidewise (behaviour in Nature)
Rest Plotted and Mentioned on Chart
Color code Used:
Green, BLUE =. Positive bias.
Safron, RED =. Negative bias.
RED in Between Green means Trend Finder / Momentum Change
/ CYCLE Change and Vice Versa.
Notice One thing: HOW LEVELS are Working.
Use any Momentum Indicator / Oscillator or as you "USED to" to Take entry.
━━━━━🟥🟧🟨🟩🟦🟪⬛━━━━━
⚠️ DISCLAIMER:
The information, views, and ideas shared here are purely for educational and informational purposes only. They are not intended as investment advice or a recommendation to buy, sell, or hold any financial instruments. I am not a SEBI-registered financial adviser.
Trading and investing in the stock market involves risk, and you should do your own research and analysis. You are solely responsible for any decisions made based on this research.
"🔔As HARD EARNED MONEY IS YOUR's, So DECISION SHOULD HAVE TO BE YOUR's".
━━━━━🟥🟧🟨🟩🟦🟪⬛━━━━━
❇️ Follow notification about periodical View
💥 Do Comment for Stock WEEKLY Level Analysis.🚀
📊 Do you agree with this view?
✈️ HIT THE PLANE ICON if this technical observation resonates with you. It will Motivate me.
━━━━━🟥🟧🟨🟩🟦🟪⬛━━━━━
💡 If You LOOKING any CHART & want for Level and ANALYZE?
Share your desired stock names in the comments below! I will try to analyze the chart Levels, patterns and share my technical view (so far my Knowledge).
If Viewers think It can identify meaningful setups. Looking forward to hearing from all of you — let's keep this discussion going and help each other make better trading decisions.
___________🔕^^^⚫⚪^🙏🏼🙏🏼🙏🏼^⚪⚫^^^🔔___________ NIFTY Short Range/ Intra-Swing Level Analysis for 07th APR 2026 NIFTY Short Range/ Intra-Swing Level Analysis for 07th APR 2026
━━━🟡WEEKLY EXP🟡━━━
🔔Monthly Bullish > SGMN Spl Lvl 23223.85
🔔Weekly Bearish < SGMN Spl Lvl 22635
✅Daily(07/04/2026) Bullish🔺 > SGMN Spl Lvl: 22859.95.
✅Daily(06/04/2026) Bearish 🔻< SGMN Spl Lvls: 🔔Follow "MIND" & "ADD NOTE"
━━━🟡🟢🔵 PCR Data Analysis🔵🟢🟡━━━
🟡 1st Weekly EXP (07th Apr 2026) PCR Analysis:
Put OI: 16,64,247, Call OI: 18,73,003, PCR: 0.89. Trend Strength: 🟠 Neutral with 🟠 Neutral Sentiment
Intraday Change in Weekly Basis Data =>
Put OI Cange: 4,24,314, Call OI Change: 3,80,553, Change OI PCR: 1.11 Trend Strength: 🟠 Neutral with 🟠 Neutral Sentiment
🟡 2nd Weekly EXP (13th Apr 2026) PCR Analysis:
Put OI: 4,22,196, Call OI: 4,53,580: PCR: 0.93. Trend Strength: 🟠 Neutral with 🟠 Neutral Sentiment
Intraday Change in Weekly Basis Data =>
Put OI Change: 2,64,368, Call OI Change: 2,50,750, Change OI PCR: 1.05. Trend Strength: 🟠 Neutral with 🟠 Neutral Sentiment
🟣 Monthly EXP - 28th Apr 2026. PCR Analysis:
Put OI: 6,92,170, Call OI: 7,22,772, PCR: 0.96. Trend Strength: 🟠 Neutral. 🟠 Neutral Sentiment.
Intraday Change in Monthly Basis Data =>
Put OI Change: -1,02,600, Call OI Change: -83,045, Change OI PCR: 1.24. Trend Strength:🟢 Bullish. 🟢 Bullish Sentiment
🔔 Notice one thing Monthly -VE Massive PUT OI Change (Compare to CALL OI Change)=> Near 2+ times PUT Unwinding.
━━━🟡🟢🔵Some Technical Parameter:🔵🟢🟡━━━
🛑 VWap vs Price: Price Below.
🟠 RSI(14): 41.26 (Oversold)
🟠 Stoch Bias(14): 46.78, 32.66. (UP but Oversold)
🛑 MACD Bias (12,26): -13.58, -594.65, -608.23.(Bearish)
🟡 Williams %R: -53.22 (Perfect Reversal Point Near -80)
🟠 ROC: -2.84
Time Frame basis Trend:
🟢Bullish: 1 Min, 5 Min, 15 Min, 30 Min, 1 Hour,2 Hour, Monthly.
🛑Bearish: 4 Hour, Daily, Weekly.
━━━🟡🟢🔵 MA (Moving Average) Analysis 🔵🟢🟡━━━
Except SMA9 & EMA9 All major Averages are Above Index Value.
⚫ Period ⚪SMA ⚪EMA
🟩 MA 9 - 22817.53 - 22915.38
🟥 MA 20 - 23364.54 - 23391.93
🟥 MA 50 - 24614.55 - 24280.35
🟥 MA 100 - 25286.22 - 24801.44
🟥 MA 200 - 25198.19 - 24891.30
✅ INTRADAY (06th APR 2026) MOVEMENT & PERIODICAL VIEW with UPDATE.
SGMN Spl MTLY Lvl: 23224, if closed above this for 2 consecutive days Bullish Bias retained.
Watch "MIND Section" for more periodical view.
━━━━━🟥🟧🟨🟩🟦🟪⬛━━━━━
💥Level Interpretation / description:
✍🏻L#1: If the candle crossed & stays above the “Buy Gen”, it is treated / considered as Bullish bias. Cfm=> Confirmation.
L#2: Possibility / Probability of REVERSAL near 🔕RL/TF1 & 🔔RL/TF2
L#3: If the candle stays above “Sell Gen” but below “Buy Gen”, it is treated / considered as Sidewise. Aggressive Traders can take Long position near “Sell Gen” either retesting or crossed from Below & vice-versa i.e. can take Short position near “Buy Gen” either retesting or crossed downward from Above.
L#4: If the candle crossed & stays below the “Sell Gen”, it is treated / considered a Bearish bias.
L#5: Possibility / Probability of REVERSAL near 🔕RL/TF1 & 🔔RL/TF2
HZB (Buy side) & HZS (Sell side) => Hurdle Zone,
✍🏻 *** Specialty of “HZB#1, HZB#2 HZS#1 & HZS#2” is Sidewise (behaviour in Nature)
Rest Plotted and Mentioned on Chart
Color code Used:
Green, BLUE =. Positive bias.
Safron, RED =. Negative bias.
RED in Between Green means Trend Finder / Momentum Change
/ CYCLE Change and Vice Versa.
Notice One thing: HOW LEVELS are Working.
Use any Momentum Indicator / Oscillator or as you "USED to" to Take entry.
━━━━━🟥🟧🟨🟩🟦🟪⬛━━━━━
⚠️ DISCLAIMER:
The information, views, and ideas shared here are purely for educational and informational purposes only. They are not intended as investment advice or a recommendation to buy, sell, or hold any financial instruments. I am not a SEBI-registered financial adviser.
Trading and investing in the stock market involves risk, and you should do your own research and analysis. You are solely responsible for any decisions made based on this research.
"🔔As HARD EARNED MONEY IS YOUR's, So DECISION SHOULD HAVE TO BE YOUR's".
━━━━━🟥🟧🟨🟩🟦🟪⬛━━━━━
❇️ Follow notification about periodical View
💥 Do Comment for Stock WEEKLY Level Analysis.🚀
📊 Do you agree with this view?
✈️ HIT THE PLANE ICON if this technical observation resonates with you. It will Motivate me.
━━━━━🟥🟧🟨🟩🟦🟪⬛━━━━━
💡 If You LOOKING any CHART & want for Level and ANALYZE?
Share your desired stock names in the comments below! I will try to analyze the chart Levels, patterns and share my technical view (so far my Knowledge).
If Viewers think It can identify meaningful setups. Looking forward to hearing from all of you — let's keep this discussion going and help each other make better trading decisions.
___________🔕^^^⚫⚪^🙏🏼🙏🏼🙏🏼^⚪⚫^^^🔔___________ Dow Future (DJI) Intra-Swing Levels 07th-08th Apr2026 (2:30 am)Dow Future (DJI) Intra-Swing Levels for 07th-08th Apr2026 (2:30 am)
━━━━━🟥🟧🟨🟩🟦🟪⬛━━━━━
💥Level Interpretation / description:
✍🏻L#1: If the candle crossed & stays above the “Buy Gen”, it is treated / considered as Bullish bias.
L#2: Possibility / Probability of REVERSAL near 🔕RLB#1 & 🔔UBTgt
L#3: If the candle stays above “Sell Gen” but below “Buy Gen”, it is treated / considered as Sidewise. Aggressive Traders can take Long position near “Sell Gen” either retesting or crossed from Below & vice-versa i.e. can take Short position near “Buy Gen” either retesting or crossed downward from Above.
L#4: If the candle crossed & stays below the “Sell Gen”, it is treated / considered a Bearish bias.
L#5: Possibility / Probability of REVERSAL near 🔕RLS#1 & 🔔USTgt
HZB (Buy side) & HZS (Sell side) => Hurdle Zone,
✍🏻 *** Specialty of “HZB#1, HZB#2 HZS#1 & HZS#2” is Sidewise (behaviour in Nature)
Rest Plotted and Mentioned on Chart
Color code Used:
Green =. Positive bias.
Red =. Negative bias.
RED in Between Green means Trend Finder / Momentum Change
/ CYCLE Change and Vice Versa.
Notice One thing: HOW LEVELS are Working.
Use any Momentum Indicator / Oscillator or as you "USED to" to Take entry.
━━━━━🟥🟧🟨🟩🟦🟪⬛━━━━━
⚠️ DISCLAIMER:
The information, views, and ideas shared here are purely for educational and informational purposes only. They are not intended as investment advice or a recommendation to buy, sell, or hold any financial instruments. I am not a SEBI-registered financial adviser.
Trading and investing in the stock market involves risk, and you should do your own research and analysis. You are solely responsible for any decisions made based on this research.
"🔔As HARD EARNED MONEY IS YOUR's, So DECISION SHOULD HAVE TO BE YOUR's".
━━━━━🟥🟧🟨🟩🟦🟪⬛━━━━━
❇️ Follow notification about periodical View
💥 Do Comment for Stock WEEKLY Level Analysis.🚀
📊 Do you agree with this view?
✈️ HIT THE PLANE ICON if this technical observation resonates with you. It will Motivate me.
━━━━━🟥🟧🟨🟩🟦🟪⬛━━━━━
💡 If You LOOKING any CHART & want for Level and ANALYZE?
Share your desired stock names in the comments below! I will try to analyze the chart Levels, patterns and share my technical view (so far my Knowledge).
If Viewers think It can identify meaningful setups. Looking forward to hearing from all of you — let's keep this discussion going and help each other make better trading decisions.
___________🔕^^^⚫⚪^🙏🏼🙏🏼🙏🏼^⚪⚫^^^🔔___________ GIFTNIFTY Short Range /Intra-Swing Level Analysis 07th APR 2026GIFTNIFTY Short Range /Intra-Swing Level Analysis for 07th APR 2026
━━━━━🟥🟧🟨🟩🟦🟪⬛━━━━━
💥Level Interpretation / description:
✍🏻L#1: If the candle crossed & stays above the “Buy Gen”, it is treated / considered as Bullish bias.
L#2: Possibility / Probability of REVERSAL near 🔕RLB#1 & 🔔UBTgt
L#3: If the candle stays above “Sell Gen” but below “Buy Gen”, it is treated / considered as Sidewise. Aggressive Traders can take Long position near “Sell Gen” either retesting or crossed from Below & vice-versa i.e. can take Short position near “Buy Gen” either retesting or crossed downward from Above.
L#4: If the candle crossed & stays below the “Sell Gen”, it is treated / considered a Bearish bias.
L#5: Possibility / Probability of REVERSAL near 🔕RLS#1 & 🔔USTgt
HZB (Buy side) & HZS (Sell side) => Hurdle Zone,
✍🏻 *** Specialty of “HZB#1, HZB#2 HZS#1 & HZS#2” is Sidewise (behaviour in Nature)
Rest Plotted and Mentioned on Chart
Color code Used:
Green =. Positive bias.
Red =. Negative bias.
RED in Between Green means Trend Finder / Momentum Change
/ CYCLE Change and Vice Versa.
Notice One thing: HOW LEVELS are Working.
Use any Momentum Indicator / Oscillator or as you "USED to" to Take entry.
━━━━━🟥🟧🟨🟩🟦🟪⬛━━━━━
⚠️ DISCLAIMER:
The information, views, and ideas shared here are purely for educational and informational purposes only. They are not intended as investment advice or a recommendation to buy, sell, or hold any financial instruments. I am not a SEBI-registered financial adviser.
Trading and investing in the stock market involves risk, and you should do your own research and analysis. You are solely responsible for any decisions made based on this research.
"🔔As HARD EARNED MONEY IS YOUR's, So DECISION SHOULD HAVE TO BE YOUR's".
━━━━━🟥🟧🟨🟩🟦🟪⬛━━━━━
❇️ Follow notification about periodical View
💥 Do Comment for Stock WEEKLY Level Analysis.🚀
📊 Do you agree with this view?
✈️ HIT THE PLANE ICON if this technical observation resonates with you. It will Motivate me.
━━━━━🟥🟧🟨🟩🟦🟪⬛━━━━━
💡 If You LOOKING any CHART & want for Level and ANALYZE?
Share your desired stock names in the comments below! I will try to analyze the chart Levels, patterns and share my technical view (so far my Knowledge).
If Viewers think It can identify meaningful setups. Looking forward to hearing from all of you — let's keep this discussion going and help each other make better trading decisions.
___________🔕^^^⚫⚪^🙏🏼🙏🏼🙏🏼^⚪⚫^^^🔔___________ RELIANCE: Triple Support Confluence at 1,304 – Bounce or Break?Technical Context
Reliance Industries Limited (RELIANCE) is moving inside a large "Megaphone" shape (a Broadening Wedge ) on the weekly chart. This means the price swings are getting bigger and more volatile. After falling from its high point of 1,611 , the stock has landed exactly at a major "floor" near 1,304 .
This 1,304 level is very important because three things are happening at once:
200-WMA: The price is touching a long-term moving average that big banks and funds usually protect.
0.618 Fibonacci: It is at a "Golden Ratio" support level, which is a common place for a bounce.
Hidden Bullish Divergence: Even though the RSI (momentum) looks low at 37 , the price is staying higher than its previous low. This often means the uptrend is still alive.
Bullish Scenario
Thesis: The buyers will defend the 1,304 floor, leading to a strong bounce back toward the top of the megaphone.
Trigger: A strong weekly close above 1,350 .
Targets: First target is 1,450 , with a long-term goal of 1,650 or higher.
Invalidation: If the price closes the week below 1,290 , this "buy the dip" idea is cancelled.
Bearish Scenario
Thesis: If the floor at 1,304 breaks, the stock will fall quickly toward the bottom green line.
Trigger: A weekly close below 1,290 .
Targets: First drop to 1,215 (green support line), and then down to 1,114 .
Invalidation: If the price quickly climbs back above 1,400 .
Summary
RELIANCE is at a "make or break" moment. The 1,300 level is the most important price to watch right now. Because of the Hidden Bullish Divergence and the 200-WMA , there is a high chance of a bounce. However, if the price falls below 1,300 , it could lead to much lower prices.
Disclaimer: This analysis is for educational purposes only and does not constitute investment advice. Please make your own decisions before making any trading decisions. XAUUSD trendline support maintains bullish structureHello everyone, here is my view on the current XAUUSD setup.
Market Analysis
Gold is trading in a constructive structure while broader market uncertainty continues to build. Although April is often seen as a supportive month for equities, the current backdrop is becoming more fragile as investors face three major pressures: inflation risks linked to higher energy prices, weaker expectations for interest rate cuts, and concerns that corporate earnings may not be strong enough to fully support risk appetite. At the same time, geopolitical tension in the Middle East is adding another layer of instability, which may continue to support safe-haven demand for gold.
From the chart, XAUUSD is still moving inside a rising channel, and the most important detail right now is that price continues to react above the ascending trendline support. The recent pullback did not damage the broader recovery structure. Instead, it looks more like a controlled retracement within an ongoing bullish formation.
The first key level is the 4681 resistance area. This is the breakout point that needs to be cleared to confirm that buyers are regaining momentum. If price can break and hold above that zone, the next upside targets come in around 4800, then 4850, while the broader bullish objective remains near the 4975 Fibonacci resistance area.
On the other hand, the rising trendline remains the key technical filter. As long as price respects this support, the bullish view stays valid. If gold falls back below the trendline and loses the 4599 area, the market could shift into a deeper correction and the buy scenario would weaken.
Key Levels to Watch
Buy confirmation: above 4681
Trendline support: still holding
Bullish invalidation: below 4599
Upside targets: 4800, 4850
Main bullish objective: 4975
My Scenario & Strategy
My preferred view remains bullish while gold stays above the rising trendline. The cleanest setup would be a confirmed breakout above 4681, because that would suggest the correction has already stabilized and the market is ready to continue higher.
If buyers hold control above that level, XAUUSD may extend toward 4800 first, followed by 4850. If bullish momentum continues to build, the broader upside path could remain open toward the 4975 Fibonacci resistance zone.
However, if price slips back below the trendline and loses 4599, the buy setup would no longer look attractive in the short term, and the market could move into a deeper pullback before forming a new recovery base.
That’s the setup I’m watching for now. Thank you for reading, and always manage your risk carefully. Long 
NIFTY Short Range/ Intra-Swing Level Analysis for 06th APR 2026 NIFTY Short Range/ Intra-Swing Level Analysis for 06th APR 2026
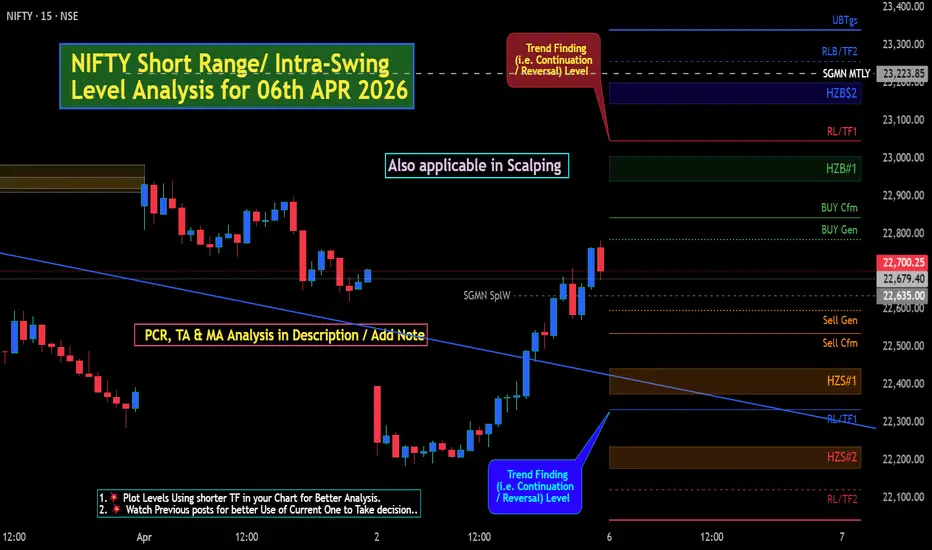
✅ INTRADAY (02nd APR 2026) MOVEMENT & PERIODICAL VIEW with UPDATE.
Watch "MIND Section" for more periodical view.
━━━━━🟥🟧🟨🟩🟦🟪⬛━━━━━
💥Level Interpretation / description:
✍🏻L#1: If the candle crossed & stays above the “Buy Gen”, it is treated / considered as Bullish bias. Cfm=> Confirmation.
L#2: Possibility / Probability of REVERSAL near 🔕RL/TF1 & 🔔RL/TF2
L#3: If the candle stays above “Sell Gen” but below “Buy Gen”, it is treated / considered as Sidewise. Aggressive Traders can take Long position near “Sell Gen” either retesting or crossed from Below & vice-versa i.e. can take Short position near “Buy Gen” either retesting or crossed downward from Above.
L#4: If the candle crossed & stays below the “Sell Gen”, it is treated / considered a Bearish bias.
L#5: Possibility / Probability of REVERSAL near 🔕RL/TF1 & 🔔RL/TF2
HZB (Buy side) & HZS (Sell side) => Hurdle Zone,
✍🏻 *** Specialty of “HZB#1, HZB#2 HZS#1 & HZS#2” is Sidewise (behaviour in Nature)
Rest Plotted and Mentioned on Chart
Color code Used:
Green, BLUE =. Positive bias.
Safron, RED =. Negative bias.
RED in Between Green means Trend Finder / Momentum Change
/ CYCLE Change and Vice Versa.
Notice One thing: HOW LEVELS are Working.
Use any Momentum Indicator / Oscillator or as you "USED to" to Take entry.
━━━━━🟥🟧🟨🟩🟦🟪⬛━━━━━
⚠️ DISCLAIMER:
The information, views, and ideas shared here are purely for educational and informational purposes only. They are not intended as investment advice or a recommendation to buy, sell, or hold any financial instruments. I am not a SEBI-registered financial adviser.
Trading and investing in the stock market involves risk, and you should do your own research and analysis. You are solely responsible for any decisions made based on this research.
"🔔As HARD EARNED MONEY IS YOUR's, So DECISION SHOULD HAVE TO BE YOUR's".
━━━━━🟥🟧🟨🟩🟦🟪⬛━━━━━
❇️ Follow notification about periodical View
💥 Do Comment for Stock WEEKLY Level Analysis.🚀
📊 Do you agree with this view?
✈️ HIT THE PLANE ICON if this technical observation resonates with you. It will Motivate me.
━━━━━🟥🟧🟨🟩🟦🟪⬛━━━━━
💡 If You LOOKING any CHART & want for Level and ANALYZE?
Share your desired stock names in the comments below! I will try to analyze the chart Levels, patterns and share my technical view (so far my Knowledge).
If Viewers think It can identify meaningful setups. Looking forward to hearing from all of you — let's keep this discussion going and help each other make better trading decisions.
___________🔕^^^⚫⚪^🙏🏼🙏🏼🙏🏼^⚪⚫^^^🔔___________ GIFTNIFTY Short Range /Intra-Swing Level Analysis 06th APR 2026GIFTNIFTY Short Range /Intra-Swing Level Analysis for 06th APR 2026
━━━━━🟥🟧🟨🟩🟦🟪⬛━━━━━
💥Level Interpretation / description:
✍🏻L#1: If the candle crossed & stays above the “Buy Gen”, it is treated / considered as Bullish bias. Cfm=> Confirmation.
L#2: Possibility / Probability of REVERSAL near 🔕RL/TF1 & 🔔RL/TF2
L#3: If the candle stays above “Sell Gen” but below “Buy Gen”, it is treated / considered as Sidewise. Aggressive Traders can take Long position near “Sell Gen” either retesting or crossed from Below & vice-versa i.e. can take Short position near “Buy Gen” either retesting or crossed downward from Above.
L#4: If the candle crossed & stays below the “Sell Gen”, it is treated / considered a Bearish bias.
L#5: Possibility / Probability of REVERSAL near 🔕RL/TF1 & 🔔RL/TF2
HZB (Buy side) & HZS (Sell side) => Hurdle Zone,
✍🏻 *** Specialty of “HZB#1, HZB#2 HZS#1 & HZS#2” is Sidewise (behaviour in Nature)
Rest Plotted and Mentioned on Chart
Color code Used:
Green, BLUE =. Positive bias.
Safron, RED =. Negative bias.
RED in Between Green means Trend Finder / Momentum Change
/ CYCLE Change and Vice Versa.
Notice One thing: HOW LEVELS are Working.
Use any Momentum Indicator / Oscillator or as you "USED to" to Take entry.
━━━━━🟥🟧🟨🟩🟦🟪⬛━━━━━
⚠️ DISCLAIMER:
The information, views, and ideas shared here are purely for educational and informational purposes only. They are not intended as investment advice or a recommendation to buy, sell, or hold any financial instruments. I am not a SEBI-registered financial adviser.
Trading and investing in the stock market involves risk, and you should do your own research and analysis. You are solely responsible for any decisions made based on this research.
"🔔As HARD EARNED MONEY IS YOUR's, So DECISION SHOULD HAVE TO BE YOUR's".
━━━━━🟥🟧🟨🟩🟦🟪⬛━━━━━
❇️ Follow notification about periodical View
💥 Do Comment for Stock WEEKLY Level Analysis.🚀
📊 Do you agree with this view?
✈️ HIT THE PLANE ICON if this technical observation resonates with you. It will Motivate me.
━━━━━🟥🟧🟨🟩🟦🟪⬛━━━━━
💡 If You LOOKING any CHART & want for Level and ANALYZE?
Share your desired stock names in the comments below! I will try to analyze the chart Levels, patterns and share my technical view (so far my Knowledge).
If Viewers think It can identify meaningful setups. Looking forward to hearing from all of you — let's keep this discussion going and help each other make better trading decisions.
___________🔕^^^⚫⚪^🙏🏼🙏🏼🙏🏼^⚪⚫^^^🔔___________ BLUESTARCO: Vibration Stock. Intra- Positional - Swing Levels.BLUESTARCO: Vibration Stock. Intra- Positional - Swing Levels.
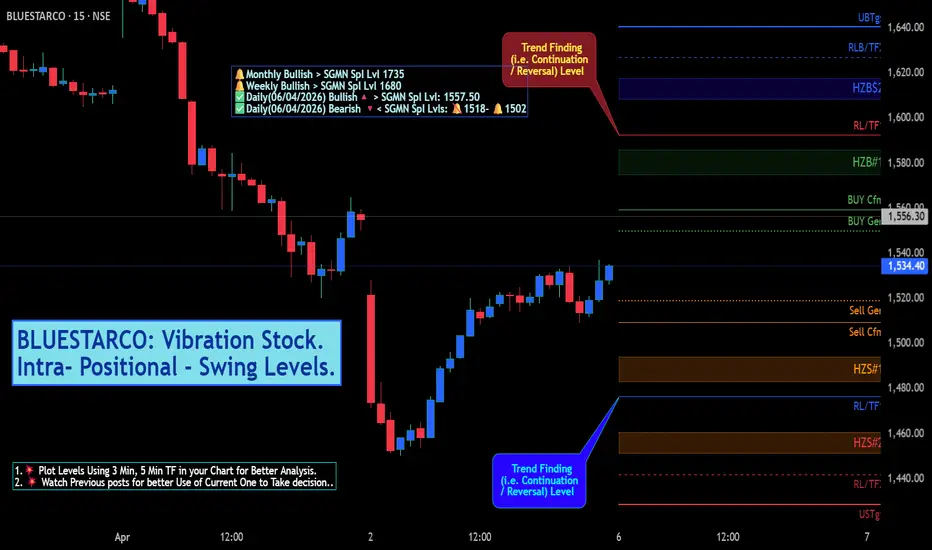
🔔Monthly Bullish > SGMN Spl Lvl 1735
🔔Weekly Bullish > SGMN Spl Lvl 1680
✅Daily(06/04/2026) Bullish🔺 > SGMN Spl Lvl: 1557.50
✅Daily(06/04/2026) Bearish 🔻< SGMN Spl Lvls: 🔕1518- 🔔1502.
━━━━━🟥🟧🟨🟩🟦🟪⬛━━━━━
💥Level Interpretation / description:
✍🏻L#1: If the candle crossed & stays above the “Buy Gen”, it is treated / considered as Bullish bias. Cfm=> Confirmation.
L#2: Possibility / Probability of REVERSAL near 🔕RL/TF1 & 🔔RL/TF2
L#3: If the candle stays above “Sell Gen” but below “Buy Gen”, it is treated / considered as Sidewise. Aggressive Traders can take Long position near “Sell Gen” either retesting or crossed from Below & vice-versa i.e. can take Short position near “Buy Gen” either retesting or crossed downward from Above.
L#4: If the candle crossed & stays below the “Sell Gen”, it is treated / considered a Bearish bias.
L#5: Possibility / Probability of REVERSAL near 🔕RL/TF1 & 🔔RL/TF2
HZB (Buy side) & HZS (Sell side) => Hurdle Zone,
✍🏻 *** Specialty of “HZB#1, HZB#2 HZS#1 & HZS#2” is Sidewise (behaviour in Nature)
Rest Plotted and Mentioned on Chart
Color code Used:
Green, BLUE =. Positive bias.
Safron, RED =. Negative bias.
RED in Between Green means Trend Finder / Momentum Change
/ CYCLE Change and Vice Versa.
Notice One thing: HOW LEVELS are Working.
Use any Momentum Indicator / Oscillator or as you "USED to" to Take entry.
━━━━━🟥🟧🟨🟩🟦🟪⬛━━━━━
⚠️ DISCLAIMER:
The information, views, and ideas shared here are purely for educational and informational purposes only. They are not intended as investment advice or a recommendation to buy, sell, or hold any financial instruments. I am not a SEBI-registered financial adviser.
Trading and investing in the stock market involves risk, and you should do your own research and analysis. You are solely responsible for any decisions made based on this research.
"🔔As HARD EARNED MONEY IS YOUR's, So DECISION SHOULD HAVE TO BE YOUR's".
━━━━━🟥🟧🟨🟩🟦🟪⬛━━━━━
❇️ Follow notification about periodical View
💥 Do Comment for Stock WEEKLY Level Analysis.🚀
📊 Do you agree with this view?
✈️ HIT THE PLANE ICON if this technical observation resonates with you. It will Motivate me.
━━━━━🟥🟧🟨🟩🟦🟪⬛━━━━━
💡 If You LOOKING any CHART & want for Level and ANALYZE?
Share your desired stock names in the comments below! I will try to analyze the chart Levels, patterns and share my technical view (so far my Knowledge).
If Viewers think It can identify meaningful setups. Looking forward to hearing from all of you — let's keep this discussion going and help each other make better trading decisions.
___________🔕^^^⚫⚪^🙏🏼🙏🏼🙏🏼^⚪⚫^^^🔔___________  Long
Long
BANKNIFTY Short Range/ Intra-Swing Level Analysis 06th Apr 2026BANKNIFTY Short Range/ Intra-Swing Level Analysis for 06th Apr 2026
Amid USA + Israel Vs. IRAN War.
━━━🟡🟢🔵 PCR Data Analysis🔵🟢🟡━━━
🟣 Monthly EXP- 28th Apr 2026. PCR Analysis:
Put OI: 3,18,127, Call OI: 3,72,209, PCR: 0.85. Trend Strength: 🟠 Neutral with 🟠 Neutral Sentiment.
Intraday Change in Monthly Basis Data =>
Put OI Change: 32,877, Call OI Chgange: 33,973, Change OI PCR: 0.97. Trend Strength: 🟠 Neutral with with 🟠 Neutral Sentiment.
━━━🟡🟢🔵Some Technical Parameter:🔵🟢🟡━━━
🛑 VWap vs Price: Price Below.
🟠 RSI(14): 35.13.
🟠 Stoch Bias(14): 28.05, 16.71..(UP but Oversold).
🛑 MACD Bias (12,26): -206.85, -2029.07, -1822.17(Bearish)
🟡 Williams %R: -71.95. (Perfect Reversal Point Near -80)
🟠 ROC: -7.51.
Time Frame basis Trend:
🟢Bullish: 1 Min, 5 Min, 15 Min, 30 Min, Monthly
🛑Bearish: 1 Hour,2 Hour, 4 Hour, Daily, Weekly.
━━━🟡🟢🔵 MA (Moving Average) Analysis 🔵🟢🟡━━━
All major Averages are Above Index Value.
⚫ Period ⚪SMA ⚪EMA
🟥 MA 9 - 52241.88 - 52399.91
🟥 MA 20 - 54397.59 - 54209.54
🟥 MA 50 - 57863.32 - 56628.16
🟥 MA 100 - 58550.89 - 57435.24
🟥 MA 200 - 57313.67 - 56831.83
━━━━━🟥🟧🟨🟩🟦🟪⬛━━━━━
💥Level Interpretation / description:
✍🏻L#1: If the candle crossed & stays above the “Buy Gen”, it is treated / considered as Bullish bias. Cfm=> Confirmation.
L#2: Possibility / Probability of REVERSAL near 🔕RL/TF1 & 🔔RL/TF2
L#3: If the candle stays above “Sell Gen” but below “Buy Gen”, it is treated / considered as Sidewise. Aggressive Traders can take Long position near “Sell Gen” either retesting or crossed from Below & vice-versa i.e. can take Short position near “Buy Gen” either retesting or crossed downward from Above.
L#4: If the candle crossed & stays below the “Sell Gen”, it is treated / considered a Bearish bias.
L#5: Possibility / Probability of REVERSAL near 🔕RL/TF1 & 🔔RL/TF2
HZB (Buy side) & HZS (Sell side) => Hurdle Zone,
✍🏻 *** Specialty of “HZB#1, HZB#2 HZS#1 & HZS#2” is Sidewise (behaviour in Nature)
Rest Plotted and Mentioned on Chart
Color code Used:
Green, BLUE =. Positive bias.
Safron, RED =. Negative bias.
RED in Between Green means Trend Finder / Momentum Change
/ CYCLE Change and Vice Versa.
Notice One thing: HOW LEVELS are Working.
Use any Momentum Indicator / Oscillator or as you "USED to" to Take entry.
━━━━━🟥🟧🟨🟩🟦🟪⬛━━━━━
⚠️ DISCLAIMER:
The information, views, and ideas shared here are purely for educational and informational purposes only. They are not intended as investment advice or a recommendation to buy, sell, or hold any financial instruments. I am not a SEBI-registered financial adviser.
Trading and investing in the stock market involves risk, and you should do your own research and analysis. You are solely responsible for any decisions made based on this research.
"🔔As HARD EARNED MONEY IS YOUR's, So DECISION SHOULD HAVE TO BE YOUR's".
━━━━━🟥🟧🟨🟩🟦🟪⬛━━━━━
❇️ Follow notification about periodical View
💥 Do Comment for Stock WEEKLY Level Analysis.🚀
📊 Do you agree with this view?
✈️ HIT THE PLANE ICON if this technical observation resonates with you. It will Motivate me.
━━━━━🟥🟧🟨🟩🟦🟪⬛━━━━━
💡 If You LOOKING any CHART & want for Level and ANALYZE?
Share your desired stock names in the comments below! I will try to analyze the chart Levels, patterns and share my technical view (so far my Knowledge).
If Viewers think It can identify meaningful setups. Looking forward to hearing from all of you — let's keep this discussion going and help each other make better trading decisions.
___________🔕^^^⚫⚪^🙏🏼🙏🏼🙏🏼^⚪⚫^^^🔔___________  Long
Long
SENSEX Weekly Level Analysis from 06th-10th APR 2026SENSEX Weekly Level Analysis from 06th-10th APR 2026
Amid USA+Israel Vs. IRAN War.
━━━🟡🟢🔵 PCR Data Analysis🔵🟢🟡━━━
🟡 1st Weekly EXP (09th Apr 2026) PCR Weekly Basis Analysis =>
Put OI: 1,72,047, Call OI: 1,64,780, PCR: 1.04. 🟠 Neutral with 🟠 Neutral Sentiment.
Intraday Change in Weekly Basis Data =>
Put OI Change: 1,31,501, Call OI Change: 1,27,590, Change OI PCR: 1.03. Trend Strength:🟠 Neutral with 🟠 Neutral Sentiment.
🟣 Monthly EXP.(30th APR 2026) PCR Analysis:
Put OI: 6,291, Call OI: 7,901, PCR: 0.80. Trend Strength: 🟠 Neutral with 🟠 Neutral Sentiment
Intraday Change in Monthly Basis Data =>
Put OI Change: 978, Call OI Change: 164, Change OI PCR: 5.96. Trend Strength: 🟢 Bullish with 🟢Bullish Sentiment .
🔔 Notice one thing Monthly -VE Call OI Change (Compare to PUT OI Change)=> Near 4+ times Call Unwinding.
━━━🟡🟢🔵Some Technical Parameter:🔵🟢🟡━━━ 0
🛑 VWap vs Price: Price Below.
🟠 RSI(14): 37.57.
🟠 Stoch Bias(14): 32.52, 18.62(UP but OVERSOLD)
🛑 MACD Bias (12,26): -51.09 -2124.57, -2073.48. (Nearing BULLISH)
🟡 Williams %R: -67.48.(Perfect Reversal Point Near -80)
🟠 ROC: -4.61
Time Frame basis Trend:
🟢Bullish: 5 Min, 15 Min, 30 Min, Monthly.
🛑Bearish: 1 Min, 1 Hour,2 Hour, 4 Hour, Daily, Weekly.
━━━🟡🟢🔵 MA (Moving Average) Analysis 🔵🟢🟡━━━
All major Averages are Above Index Value.
⚫ Period ⚪SMA ⚪EMA
🟥 MA 9 - 73640.35 - 73888.50
🟥 MA 20 - 75616.31 - 75652.35
🟥 MA 50 - 79847.23 - 78759.96
🟥 MA 100 - 82316.77 - 80645.59
🟥 MA 200 - 82201.57 - 81171.45
━━━━━🟥🟧🟨🟩🟦🟪⬛━━━━━
💥Level Interpretation / description:
✍🏻L#1: If the candle crossed & stays above the “Buy Gen”, it is treated / considered as Bullish bias. Cfm=> Confirmation.
L#2: Possibility / Probability of REVERSAL near 🔕RL/TF1 & 🔔RL/TF2
L#3: If the candle stays above “Sell Gen” but below “Buy Gen”, it is treated / considered as Sidewise. Aggressive Traders can take Long position near “Sell Gen” either retesting or crossed from Below & vice-versa i.e. can take Short position near “Buy Gen” either retesting or crossed downward from Above.
L#4: If the candle crossed & stays below the “Sell Gen”, it is treated / considered a Bearish bias.
L#5: Possibility / Probability of REVERSAL near 🔕RL/TF1 & 🔔RL/TF2
HZB (Buy side) & HZS (Sell side) => Hurdle Zone,
✍🏻 *** Specialty of “HZB#1, HZB#2 HZS#1 & HZS#2” is Sidewise (behaviour in Nature)
Rest Plotted and Mentioned on Chart
Color code Used:
Green, BLUE =. Positive bias.
Safron, RED =. Negative bias.
RED in Between Green means Trend Finder / Momentum Change
/ CYCLE Change and Vice Versa.
Notice One thing: HOW LEVELS are Working.
Use any Momentum Indicator / Oscillator or as you "USED to" to Take entry.
━━━━━🟥🟧🟨🟩🟦🟪⬛━━━━━
⚠️ DISCLAIMER:
The information, views, and ideas shared here are purely for educational and informational purposes only. They are not intended as investment advice or a recommendation to buy, sell, or hold any financial instruments. I am not a SEBI-registered financial adviser.
Trading and investing in the stock market involves risk, and you should do your own research and analysis. You are solely responsible for any decisions made based on this research.
"🔔As HARD EARNED MONEY IS YOUR's, So DECISION SHOULD HAVE TO BE YOUR's".
━━━━━🟥🟧🟨🟩🟦🟪⬛━━━━━
❇️ Follow notification about periodical View
💥 Do Comment for Stock WEEKLY Level Analysis.🚀
📊 Do you agree with this view?
✈️ HIT THE PLANE ICON if this technical observation resonates with you. It will Motivate me.
━━━━━🟥🟧🟨🟩🟦🟪⬛━━━━━
💡 If You LOOKING any CHART & want for Level and ANALYZE?
Share your desired stock names in the comments below! I will try to analyze the chart Levels, patterns and share my technical view (so far my Knowledge).
If Viewers think It can identify meaningful setups. Looking forward to hearing from all of you — let's keep this discussion going and help each other make better trading decisions.
___________🔕^^^⚫⚪^🙏🏼🙏🏼🙏🏼^⚪⚫^^^🔔___________ SENSEX Short Range/ Intra-Swing Level Analysis for 06th APR 20 SENSEX Short Range/ Intra-Swing Level Analysis for 06th APR 2026
Amid USA+Israel Vs. IRAN War.
SGMN Spl Level 72880 (Bearish below) & by day closing < 73025 m(Bearish BIAS)
━━━🟡🟢🔵 PCR Data Analysis🔵🟢🟡━━━
🟡 1st Weekly EXP (09th Apr 2026) PCR Weekly Basis Analysis =>
Put OI: 1,72,047, Call OI: 1,64,780, PCR: 1.04. 🟠 Neutral with 🟠 Neutral Sentiment.
Intraday Change in Weekly Basis Data =>
Put OI Change: 1,31,501, Call OI Change: 1,27,590, Change OI PCR: 1.03. Trend Strength:🟠 Neutral with 🟠 Neutral Sentiment.
🟣 Monthly EXP.(30th APR 2026) PCR Analysis:
Put OI: 6,291, Call OI: 7,901, PCR: 0.80. Trend Strength: 🟠 Neutral with 🟠 Neutral Sentiment
Intraday Change in Monthly Basis Data =>
Put OI Change: 978, Call OI Change: 164, Change OI PCR: 5.96. Trend Strength: 🟢 Bullish with 🟢Bullish Sentiment .
🔔 Notice one thing Monthly -VE Call OI Change (Compare to PUT OI Change)=> Near 4+ times Call Unwinding.
━━━🟡🟢🔵Some Technical Parameter:🔵🟢🟡━━━ 0
🛑 VWap vs Price: Price Below.
🟠 RSI(14): 37.57. (Near OVERSOLD)
🟠 Stoch Bias(14): 32.52, 18.62(UP but OVERSOLD)
🛑 MACD Bias (12,26): -51.09 -2124.57, -2073.48. (Nearing BULLISH)
🟡 Williams %R: -67.48.(Perfect Reversal Point Near -80)
🟠 ROC: -4.61
Time Frame basis Trend:
🟢Bullish: 5 Min, 15 Min, 30 Min, Monthly.
🛑Bearish: 1 Min, 1 Hour,2 Hour, 4 Hour, Daily, Weekly.
━━━🟡🟢🔵 MA (Moving Average) Analysis 🔵🟢🟡━━━
All major Averages are Above Index Value.
⚫ Period ⚪SMA ⚪EMA
🟥 MA 9 - 73640.35 - 73888.50
🟥 MA 20 - 75616.31 - 75652.35
🟥 MA 50 - 79847.23 - 78759.96
🟥 MA 100 - 82316.77 - 80645.59
🟥 MA 200 - 82201.57 - 81171.45
━━━━━🟥🟧🟨🟩🟦🟪⬛━━━━━
💥Level Interpretation / description:
✍🏻L#1: If the candle crossed & stays above the “Buy Gen”, it is treated / considered as Bullish bias. Cfm=> Confirmation.
L#2: Possibility / Probability of REVERSAL near 🔕RL/TF1 & 🔔RL/TF2
L#3: If the candle stays above “Sell Gen” but below “Buy Gen”, it is treated / considered as Sidewise. Aggressive Traders can take Long position near “Sell Gen” either retesting or crossed from Below & vice-versa i.e. can take Short position near “Buy Gen” either retesting or crossed downward from Above.
L#4: If the candle crossed & stays below the “Sell Gen”, it is treated / considered a Bearish bias.
L#5: Possibility / Probability of REVERSAL near 🔕RL/TF1 & 🔔RL/TF2
HZB (Buy side) & HZS (Sell side) => Hurdle Zone,
✍🏻 *** Specialty of “HZB#1, HZB#2 HZS#1 & HZS#2” is Sidewise (behaviour in Nature)
Rest Plotted and Mentioned on Chart
Color code Used:
Green, BLUE =. Positive bias.
Safron, RED =. Negative bias.
RED in Between Green means Trend Finder / Momentum Change
/ CYCLE Change and Vice Versa.
Notice One thing: HOW LEVELS are Working.
Use any Momentum Indicator / Oscillator or as you "USED to" to Take entry.
━━━━━🟥🟧🟨🟩🟦🟪⬛━━━━━
⚠️ DISCLAIMER:
The information, views, and ideas shared here are purely for educational and informational purposes only. They are not intended as investment advice or a recommendation to buy, sell, or hold any financial instruments. I am not a SEBI-registered financial adviser.
Trading and investing in the stock market involves risk, and you should do your own research and analysis. You are solely responsible for any decisions made based on this research.
"🔔As HARD EARNED MONEY IS YOUR's, So DECISION SHOULD HAVE TO BE YOUR's".
━━━━━🟥🟧🟨🟩🟦🟪⬛━━━━━
❇️ Follow notification about periodical View
💥 Do Comment for Stock WEEKLY Level Analysis.🚀
📊 Do you agree with this view?
✈️ HIT THE PLANE ICON if this technical observation resonates with you. It will Motivate me.
━━━━━🟥🟧🟨🟩🟦🟪⬛━━━━━
💡 If You LOOKING any CHART & want for Level and ANALYZE?
Share your desired stock names in the comments below! I will try to analyze the chart Levels, patterns and share my technical view (so far my Knowledge).
If Viewers think It can identify meaningful setups. Looking forward to hearing from all of you — let's keep this discussion going and help each other make better trading decisions.
___________🔕^^^⚫⚪^🙏🏼🙏🏼🙏🏼^⚪⚫^^^🔔___________ DowJones (DJI) Short Range Levels 03rd-04th APR 2026 (1:30 am)DowJones (DJI) Short Range / Intra-Swing Levels 03rd-04th APR 2026 (1:30 am)
━━━━━🟥🟧🟨🟩🟦🟪⬛━━━━━
💥Level Interpretation / description:
✍🏻L#1: If the candle crossed & stays above the “Buy Gen”, it is treated / considered as Bullish bias. Cfm=> Confirmation.
L#2: Possibility / Probability of REVERSAL near 🔕RL/TF1 & 🔔RL/TF2
L#3: If the candle stays above “Sell Gen” but below “Buy Gen”, it is treated / considered as Sidewise. Aggressive Traders can take Long position near “Sell Gen” either retesting or crossed from Below & vice-versa i.e. can take Short position near “Buy Gen” either retesting or crossed downward from Above.
L#4: If the candle crossed & stays below the “Sell Gen”, it is treated / considered a Bearish bias.
L#5: Possibility / Probability of REVERSAL near 🔕RL/TF1 & 🔔RL/TF2
HZB (Buy side) & HZS (Sell side) => Hurdle Zone,
✍🏻 *** Specialty of “HZB#1, HZB#2 HZS#1 & HZS#2” is Sidewise (behaviour in Nature)
Rest Plotted and Mentioned on Chart
Color code Used:
Green, BLUE =. Positive bias.
Safron, RED =. Negative bias.
RED in Between Green means Trend Finder / Momentum Change
/ CYCLE Change and Vice Versa.
Notice One thing: HOW LEVELS are Working.
Use any Momentum Indicator / Oscillator or as you "USED to" to Take entry.
━━━━━🟥🟧🟨🟩🟦🟪⬛━━━━━
⚠️ DISCLAIMER:
The information, views, and ideas shared here are purely for educational and informational purposes only. They are not intended as investment advice or a recommendation to buy, sell, or hold any financial instruments. I am not a SEBI-registered financial adviser.
Trading and investing in the stock market involves risk, and you should do your own research and analysis. You are solely responsible for any decisions made based on this research.
"🔔As HARD EARNED MONEY IS YOUR's, So DECISION SHOULD HAVE TO BE YOUR's".
━━━━━🟥🟧🟨🟩🟦🟪⬛━━━━━
❇️ Follow notification about periodical View
💥 Do Comment for Stock WEEKLY Level Analysis.🚀
📊 Do you agree with this view?
✈️ HIT THE PLANE ICON if this technical observation resonates with you. It will Motivate me.
━━━━━🟥🟧🟨🟩🟦🟪⬛━━━━━
💡 If You LOOKING any CHART & want for Level and ANALYZE?
Share your desired stock names in the comments below! I will try to analyze the chart Levels, patterns and share my technical view (so far my Knowledge).
If Viewers think It can identify meaningful setups. Looking forward to hearing from all of you — let's keep this discussion going and help each other make better trading decisions.
___________🔕^^^⚫⚪^🙏🏼🙏🏼🙏🏼^⚪⚫^^^🔔___________ Dow Future (DJI) Intra-Swing Levels 03rd-04th Apr2026 (2:30 am)Dow Future (DJI) Intra-Swing Levels for 03rd-04th Apr2026 (2:30 am)
💥Level Interpretation / description:
✍🏻L#1: If the candle crossed & stays above the “Buy Gen”, it is treated / considered as Bullish bias. Cfm=> Confirmation.
L#2: Possibility / Probability of REVERSAL near 🔕RL/TF1 & 🔔RL/TF2
L#3: If the candle stays above “Sell Gen” but below “Buy Gen”, it is treated / considered as Sidewise. Aggressive Traders can take Long position near “Sell Gen” either retesting or crossed from Below & vice-versa i.e. can take Short position near “Buy Gen” either retesting or crossed downward from Above.
L#4: If the candle crossed & stays below the “Sell Gen”, it is treated / considered a Bearish bias.
L#5: Possibility / Probability of REVERSAL near 🔕RL/TF1 & 🔔RL/TF2
HZB (Buy side) & HZS (Sell side) => Hurdle Zone,
✍🏻 *** Specialty of “HZB#1, HZB#2 HZS#1 & HZS#2” is Sidewise (behaviour in Nature)
Rest Plotted and Mentioned on Chart
Color code Used:
Green, BLUE =. Positive bias.
Safron, RED =. Negative bias.
RED in Between Green means Trend Finder / Momentum Change
/ CYCLE Change and Vice Versa.
Notice One thing: HOW LEVELS are Working.
Use any Momentum Indicator / Oscillator or as you "USED to" to Take entry.
━━━━━🟥🟧🟨🟩🟦🟪⬛━━━━━
⚠️ DISCLAIMER:
The information, views, and ideas shared here are purely for educational and informational purposes only. They are not intended as investment advice or a recommendation to buy, sell, or hold any financial instruments. I am not a SEBI-registered financial adviser.
Trading and investing in the stock market involves risk, and you should do your own research and analysis. You are solely responsible for any decisions made based on this research.
"🔔As HARD EARNED MONEY IS YOUR's, So DECISION SHOULD HAVE TO BE YOUR's". USDINR: RBI's $149 Billion MasterstrokeRBI's $149 Billion Masterstroke! (April 2026)
The Reserve Bank of India (RBI) has taken one of its toughest actions in over a decade to defend the Indian rupee against heavy speculative pressure.
What Did RBI Do?
On April 1-2, 2026, the RBI announced strict new measures targeting the offshore rupee market:
Ban on NDF Contracts: Indian banks (Authorised Dealers) are now prohibited from offering Non-Deliverable Forward (NDF) contracts involving the rupee to both resident and non-resident clients. This is effective immediately.
Ban on Rebooking: Banks cannot rebook any cancelled foreign exchange derivative contracts (deliverable or non-deliverable).
Position Limit: Banks’ net open rupee position in the onshore market is capped at $100 million per day.
These steps directly hit the massive $149 billion-a-day offshore NDF market (mainly in Singapore, London, New York, and Hong Kong), which is roughly twice the size of India’s onshore rupee trading volume.
Why This “Masterstroke”?
The rupee had been weakening sharply due to global tensions (especially the US-Israel-Iran conflict), hitting repeated record lows.
Foreign speculators and some corporates were heavily using the offshore NDF market to place short bets against the rupee (betting it would fall further).
Banks were running large arbitrage trades (buying dollars onshore and selling offshore), which added more pressure on the rupee.
Earlier RBI interventions (selling dollars) were partly offset by these loopholes, so the central bank decided to close the channels directly.
This move forced banks to unwind an estimated $30 billion+ in arbitrage positions quickly.
Immediate Impact
The rupee surged sharply — recording its biggest single-day gain in over 12 years (around 1.4% to 1.8% in a day).
It moved from near 95+ levels back toward the 93–94 range in a single session.
Volatility spiked, and the clearing house imposed higher margins on forward contracts.
Bank stocks fell to near one-year lows due to concerns over potential losses from unwinding positions.
Why Is It Called a “Masterstroke”?
Positive Side:
It effectively curbs speculative short-selling of the rupee.
Reduces pressure on RBI’s foreign exchange reserves.
Sends a strong signal that the RBI will not allow unchecked speculation.
Helps restore some stability to the currency in the short term.
Potential Downsides:
May reduce liquidity in the offshore rupee market.
Increases hedging costs for corporates and foreign investors.
Banks and some companies may face short-term losses while unwinding positions.
Could create temporary disruptions in normal forex flows.
Bottom Line
This is being widely described as RBI’s “Forex War” or “$149 Billion Crackdown” because it directly attacks the huge offshore market that was being used to bet against the Indian rupee.
Analysts say it is one of the most aggressive administrative controls on currency trading in recent memory. Whether the rupee’s recovery sustains will depend on global oil prices, geopolitical developments, and how quickly the unwind of positions is completed (deadline for some limits is April 10, 2026).
Would you like more details on:
Current rupee exchange rate?
Impact on banks or stock market?
What this means for importers/exporters?
Possible future RBI steps?
⚠️ DISCLAIMER:
The information, views, and ideas shared here are purely for educational and informational purposes only. They are not intended as investment advice or a recommendation to buy, sell, or hold any financial instruments. I am not a SEBI-registered financial adviser.
Trading and investing in the stock market involves risk, and you should do your own research and analysis. You are solely responsible for any decisions made based on this research.
"🔔As HARD EARNED MONEY IS YOUR's, So DECISION SHOULD HAVE TO BE YOUR's". GIFTNIFTY Short Range /Intra-Swing Level Analysis 03rd APR 2026GIFTNIFTY Short Range /Intra-Swing Level Analysis for 03rd APR 2026
SGMN Zone for the day => 22655 - 22669 (🟢Bullish Above)
━━━━━🟥🟧🟨🟩🟦🟪⬛━━━━━
💥Level Interpretation / description:
✍🏻L#1: If the candle crossed & stays above the “Buy Gen”, it is treated / considered as Bullish bias. Cfm=> Confirmation.
L#2: Possibility / Probability of REVERSAL near 🔕RL/TF1 & 🔔RL/TF2
L#3: If the candle stays above “Sell Gen” but below “Buy Gen”, it is treated / considered as Sidewise. Aggressive Traders can take Long position near “Sell Gen” either retesting or crossed from Below & vice-versa i.e. can take Short position near “Buy Gen” either retesting or crossed downward from Above.
L#4: If the candle crossed & stays below the “Sell Gen”, it is treated / considered a Bearish bias.
L#5: Possibility / Probability of REVERSAL near 🔕RL/TF1 & 🔔RL/TF2
HZB (Buy side) & HZS (Sell side) => Hurdle Zone,
✍🏻 *** Specialty of “HZB#1, HZB#2 HZS#1 & HZS#2” is Sidewise (behaviour in Nature)
Rest Plotted and Mentioned on Chart
Color code Used:
Green, BLUE =. Positive bias.
Safron, RED =. Negative bias.
RED in Between Green means Trend Finder / Momentum Change
/ CYCLE Change and Vice Versa.
Notice One thing: HOW LEVELS are Working.
Use any Momentum Indicator / Oscillator or as you "USED to" to Take entry.
━━━━━🟥🟧🟨🟩🟦🟪⬛━━━━━
⚠️ DISCLAIMER:
The information, views, and ideas shared here are purely for educational and informational purposes only. They are not intended as investment advice or a recommendation to buy, sell, or hold any financial instruments. I am not a SEBI-registered financial adviser.
Trading and investing in the stock market involves risk, and you should do your own research and analysis. You are solely responsible for any decisions made based on this research.
"🔔As HARD EARNED MONEY IS YOUR's, So DECISION SHOULD HAVE TO BE YOUR's".
━━━━━🟥🟧🟨🟩🟦🟪⬛━━━━━
❇️ Follow notification about periodical View
💥 Do Comment for Stock WEEKLY Level Analysis.🚀
📊 Do you agree with this view?
✈️ HIT THE PLANE ICON if this technical observation resonates with you. It will Motivate me.
━━━━━🟥🟧🟨🟩🟦🟪⬛━━━━━
💡 If You LOOKING any CHART & want for Level and ANALYZE?
Share your desired stock names in the comments below! I will try to analyze the chart Levels, patterns and share my technical view (so far my Knowledge).
If Viewers think It can identify meaningful setups. Looking forward to hearing from all of you — let's keep this discussion going and help each other make better trading decisions.
___________🔕^^^⚫⚪^🙏🏼🙏🏼🙏🏼^⚪⚫^^^🔔___________