NIFTY DAILY / Short Range Level Analysis for 16th Jul 2026🔕 SGMN SplD BULLISH Above => 24153.
🔕 SGMN SplD Bearish BELOW => 24007.
Mentioned analysis based on 2 consecutive candle close in 15 min Time Frame.
━━━━━🟥🟧🟨🟩🟦🟪⬛━━━━━
💥Level Interpretation / description:
✍🏻L#1: If the candle crossed & stays above the “Buy Gen”, it is treated / considered as Bullish bias. Cfm=> Confirmation.
L#2: Possibility / Probability of REVERSAL near 🔕RL/TF1 & 🔔RL/TF2
L#3: If the candle stays above “Sell Gen” but below “Buy Gen”, it is treated / considered as Sidewise. Aggressive Traders can take Long position near “Sell Gen” either retesting or crossed from Below & vice-versa i.e. can take Short position near “Buy Gen” either retesting or crossed downward from Above.
L#4: If the candle crossed & stays below the “Sell Gen”, it is treated / considered a Bearish bias.
L#5: Possibility / Probability of REVERSAL near 🔕RL/TF1 & 🔔RL/TF2
HZB (Buy side) & HZS (Sell side) => Hurdle Zone,
✍🏻 *** Specialty of “HZB#1, HZB#2 HZS#1 & HZS#2” is Sidewise (behaviour in Nature)
Rest Plotted and Mentioned on Chart
Color code Used:
Green, BLUE =. Positive bias.
Safron, RED =. Negative bias.
RED in Between Green means Trend Finder / Momentum Change
/ CYCLE Change and Vice Versa.
Notice One thing: HOW LEVELS are Working.
Use any Momentum Indicator / Oscillator or as you "USED to" to Take entry.
━━━━━🟥🟧🟨🟩🟦🟪⬛━━━━━
⚠️ DISCLAIMER:
The information, views, and ideas shared here are purely for educational and informational purposes only. They are not intended as investment advice or a recommendation to buy, sell, or hold any financial instruments. I am not a SEBI-registered financial adviser.
Trading and investing in the stock market involves risk, and you should do your own research and analysis. You are solely responsible for any decisions made based on this research.
"🔔As HARD EARNED MONEY IS YOUR's, So DECISION SHOULD HAVE TO BE YOUR's".
━━━━━🟥🟧🟨🟩🟦🟪⬛━━━━━
❇️ Follow notification about periodical View
💥 Do Comment for Stock WEEKLY Level Analysis.🚀
📊 Do you agree with this view?
✈️ HIT THE PLANE ICON if this technical observation resonates with you. It will Motivate me.
━━━━━🟥🟧🟨🟩🟦🟪⬛━━━━━
💡 If You LOOKING any CHART & want for Level and ANALYZE?
Share your desired stock names in the comments below! I will try to analyze the chart Levels, patterns and share my technical view (so far my Knowledge).
If Viewers think It can identify meaningful setups. Looking forward to hearing from all of you — let's keep this discussion going and help each other make better trading decisions.
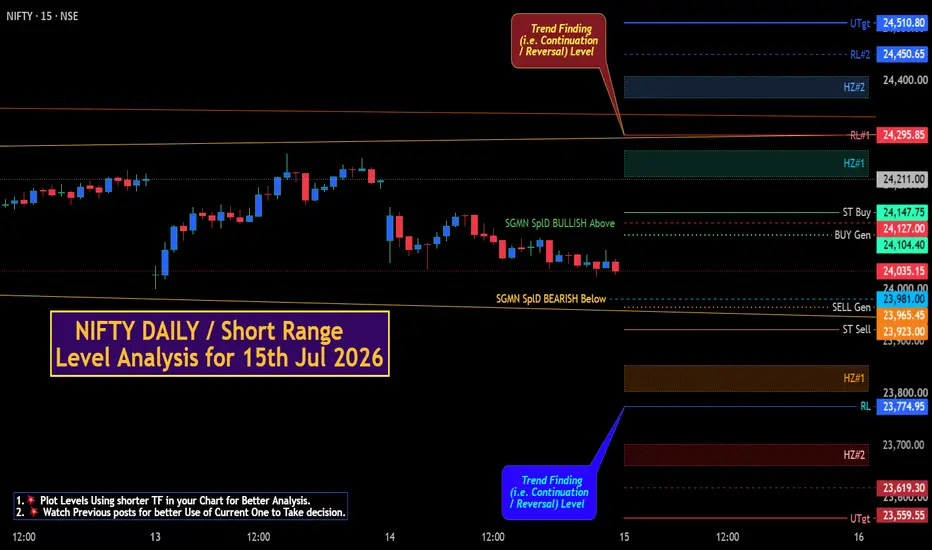
___________🔕^^^⚫⚪^🙏🏼🙏🏼🙏🏼^⚪⚫^^^🔔___________ NIFTY DAILY / Short Range Level Analysis for 15th Jul 2026.NIFTY DAILY / Short Range Level Analysis for 15th Jul 2026.
🔕 SGMN SplD BULLISH Above => 24127.
🔕 SGMN SplD Bearish BELOW => 23981.
Mentioned analysis based on 2 consecutive candle close in 15 min Time Frame.
━━━━━🟥🟧🟨🟩🟦🟪⬛━━━━━
💥Level Interpretation / description:
✍🏻L#1: If the candle crossed & stays above the “Buy Gen”, it is treated / considered as Bullish bias. Cfm=> Confirmation.
L#2: Possibility / Probability of REVERSAL near 🔕RL/TF1 & 🔔RL/TF2
L#3: If the candle stays above “Sell Gen” but below “Buy Gen”, it is treated / considered as Sidewise. Aggressive Traders can take Long position near “Sell Gen” either retesting or crossed from Below & vice-versa i.e. can take Short position near “Buy Gen” either retesting or crossed downward from Above.
L#4: If the candle crossed & stays below the “Sell Gen”, it is treated / considered a Bearish bias.
L#5: Possibility / Probability of REVERSAL near 🔕RL/TF1 & 🔔RL/TF2
HZB (Buy side) & HZS (Sell side) => Hurdle Zone,
✍🏻 *** Specialty of “HZB#1, HZB#2 HZS#1 & HZS#2” is Sidewise (behaviour in Nature)
Rest Plotted and Mentioned on Chart
Color code Used:
Green, BLUE =. Positive bias.
Safron, RED =. Negative bias.
RED in Between Green means Trend Finder / Momentum Change
/ CYCLE Change and Vice Versa.
Notice One thing: HOW LEVELS are Working.
Use any Momentum Indicator / Oscillator or as you "USED to" to Take entry.
━━━━━🟥🟧🟨🟩🟦🟪⬛━━━━━
⚠️ DISCLAIMER:
The information, views, and ideas shared here are purely for educational and informational purposes only. They are not intended as investment advice or a recommendation to buy, sell, or hold any financial instruments. I am not a SEBI-registered financial adviser.
Trading and investing in the stock market involves risk, and you should do your own research and analysis. You are solely responsible for any decisions made based on this research.
"🔔As HARD EARNED MONEY IS YOUR's, So DECISION SHOULD HAVE TO BE YOUR's".
━━━━━🟥🟧🟨🟩🟦🟪⬛━━━━━
❇️ Follow notification about periodical View
💥 Do Comment for Stock WEEKLY Level Analysis.🚀
📊 Do you agree with this view?
✈️ HIT THE PLANE ICON if this technical observation resonates with you. It will Motivate me.
━━━━━🟥🟧🟨🟩🟦🟪⬛━━━━━
💡 If You LOOKING any CHART & want for Level and ANALYZE?
Share your desired stock names in the comments below! I will try to analyze the chart Levels, patterns and share my technical view (so far my Knowledge).
If Viewers think It can identify meaningful setups. Looking forward to hearing from all of you — let's keep this discussion going and help each other make better trading decisions.
___________🔕^^^⚫⚪^🙏🏼🙏🏼🙏🏼^⚪⚫^^^🔔___________  Long
Long
XAUUSD — Is 4,080 the Sell Trap?Gold is still moving inside a descending price channel.
Price is trading around 4,050 - 4,060, right near the middle zone of the channel.
This is not a clean buy area.
And it is not the best place to chase a sell either.
For me, today’s chart is about one question:
Will gold retest the sell zone first before dropping deeper?
The simple read
Gold remains under short-term bearish pressure while price stays inside the descending channel.
The nearest sell reaction area is around 4,080 - 4,091.
This zone also lines up with the Fibonacci reaction area and the upper part of the current correction.
If gold pushes into this zone and shows rejection, sellers may try to take control again.
The first downside area to watch is 4,043 - 4,027.
If that support fails, the next deeper target becomes 3,985, then the key support zone near 3,945.
Key price zones
Current price area: 4,050 - 4,060
Middle channel zone: 4,050
Sell reaction zone: 4,080 - 4,091
First support: 4,043 - 4,027
Fibo extension support: 3,985
Key support zone: 3,945
Bearish pressure weakens above: 4,091
Trading plan
📉 Sell reaction scenario
If gold retests 4,080 - 4,091 and shows clear rejection:
Sellers may try to push price back toward 4,043 - 4,027.
If this support zone breaks, the next downside area to watch is 3,985.
A deeper move may target the key support zone near 3,945.
I prefer waiting for rejection confirmation instead of selling randomly in the middle.
📈 Short-term bounce scenario
If gold holds above 4,043 - 4,027:
A small recovery may appear.
Price could retest 4,080 - 4,091 again.
But this bounce is still only a reaction while gold remains inside the descending channel.
A stronger bullish view needs price to break and hold above 4,091.
📉 Deeper correction scenario
If 4,027 fails clearly:
The correction structure becomes stronger.
Gold may continue toward 3,985, where the Fibonacci extension support is waiting.
If buyers still fail to react there, the key support zone near 3,945 becomes important.
Gold is not giving a clean reversal signal yet.
The chart is still respecting the descending channel.
That means I do not want to chase the current price.
I want to see either:
A clean rejection from 4,080 - 4,091.
Or a confirmed reaction from 4,043 - 4,027.
Main view:
Gold remains cautious below 4,091.
4,080 - 4,091 is the sell reaction zone.
4,043 - 4,027 is the first support.
3,985 and 3,945 are the deeper zones if the correction continues.
Reaction first.
Confirmation second.
Trade last.
No confirmation = no trade.
Do you think gold will reject from 4,080 - 4,091, or break the channel first?  Short
Short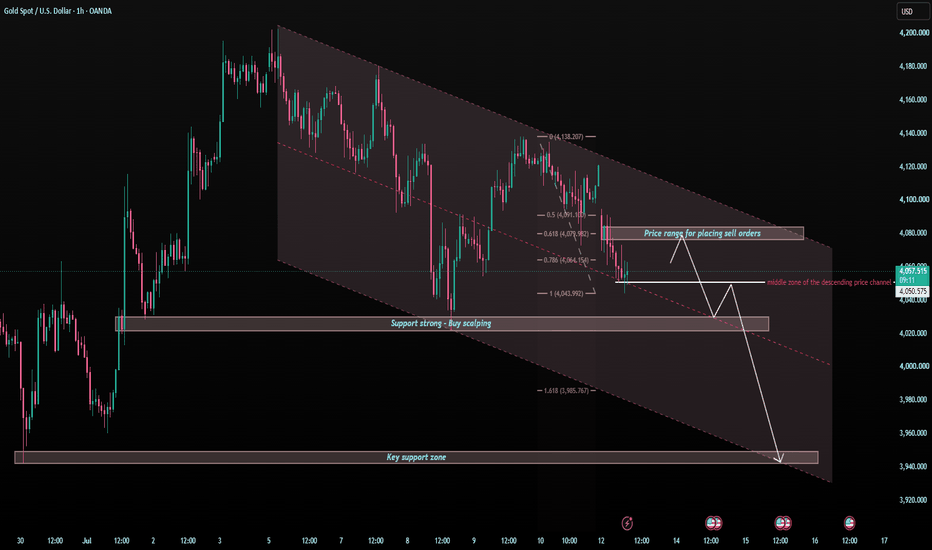
XAUUSD — Bearish Pressure Below Liquidity Sell Zone
Fundamental Analysis
Gold remains sensitive to USD momentum, Treasury yields, and upcoming U.S. macro data. For now, the market is still showing defensive price action, with sellers controlling the structure after price failed to hold above the previous trendline.
Technical Analysis
On the 1H chart, XAUUSD is trading around 4,026 after breaking below the short-term uptrend structure. The nearest reaction area is the liquidity buy scalping zone at 3,998 - 4,004, where price may create a short bounce. However, the main area to watch is 4,074 - 4,080. This zone aligns with previous liquidity, Fibonacci reaction, and the broken trendline retest. If gold recovers into this area and rejects, the bearish continuation setup remains valid toward the lower target around 3,890.
Important Key Levels
Current price: 4,026
Buy scalping zone: 3,998 - 4,004
Liquidity sell test zone: 4,074 - 4,080
Short-term resistance: 4,040 - 4,050
Main downside target: 3,890 - 3,885
Invalidation: above 4,080
Trading Scenario
Main Sell Setup
Entry: 4,074 - 4,080
Stop Loss: 4,105
Take Profit 1: 4,004
Take Profit 2: 3,950
Take Profit 3: 3,890 - 3,885
Sell Condition
Wait for gold to recover into the 4,074 - 4,080 liquidity sell test zone. A valid sell setup needs bearish rejection, such as a long upper wick, failed reclaim, bearish engulfing candle, or price closing back below the zone. If price rejects and breaks below 3,998 - 4,004, downside momentum may expand toward 3,950 and 3,890. If price breaks and holds above 4,080, the sell setup becomes weaker.
Overall View
The main view remains bearish while XAUUSD trades below the broken trendline and under the liquidity sell test zone. Gold may bounce first from 3,998 - 4,004, but the preferred plan is to wait for a cleaner sell reaction around 4,074 - 4,080 before looking for continuation toward the lower Fibonacci target.
Do you share the same bearish view on gold, or are you waiting for a stronger rejection from the 4,074 - 4,080 zone?
Short 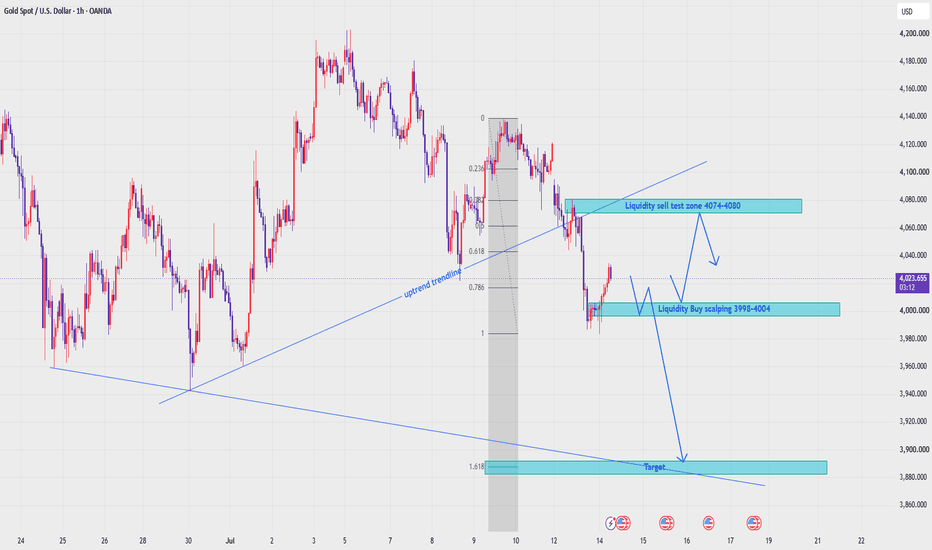
Short 
MASON XAUUSD – Bearish Trend Targets Fibonacci Range
XAUUSD is trading around 4,017 after breaking below the rising trendline support. The short-term structure has shifted back into bearish pressure, and price is now moving below the broken support area.
The priority view remains sell with the current bearish structure, especially if gold retests the 4,040–4,045 zone and fails to recover above it.
Technical View
Gold has broken below the rising trendline that previously supported the recovery structure. This is an important bearish signal because the buyers failed to defend the trendline, and the market is now trading under the broken structure.
After the breakdown, price dropped sharply and is now consolidating around the 4,001–4,006 buy order zone. This area may create a short-term reaction, but the overall structure still favors sellers while price stays below the broken trendline and Fibonacci resistance.
The 4,040–4,045 area is the key sell zone on the chart. This zone is important because it was previous support, now turning into resistance, and it also aligns with the Fibonacci reaction area. If gold retests this zone and rejects, it may confirm the next lower high before another bearish leg.
The 4,001–4,006 area is the nearest support. If price breaks below this zone, selling pressure may continue toward the expected price range around 3,945–3,955, which aligns with the deeper Fibonacci 2.618 extension.
The main idea is simple: as long as gold stays below 4,040–4,045, the recovery remains weak, and the downside path remains active.
Key Zones
Current price: 4,017
Sell zone: 4,040–4,045
Broken trendline resistance: 4,040–4,060
Nearest support: 4,001–4,006
Fibonacci 1.618 reaction: around 4,017
Expected price range: 3,945–3,955
Fibonacci 2.618 target: 3,945–3,955
Invalidation: above 4,065
Trading Plan
Sell Priority: 4,040–4,045
Condition: wait for bearish rejection, failed recovery above the broken trendline, or price staying below the Fibonacci resistance zone.
SL: above 4,065
TP1: 4,001–4,006
TP2: 3,970–3,980
TP3: 3,945–3,955
Alternative Scenario
If gold breaks below 4,001 directly, wait for a retest of this area as resistance before looking for sell continuation toward 3,970 and the expected Fibonacci range around 3,945–3,955.
Buy View
Buy is not the priority while price remains below the broken trendline and below the 4,040–4,045 sell zone. A short-term buy reaction may appear around 4,001–4,006, but it should only be treated as a scalp unless gold breaks back above 4,065.
Final View
Overall, gold is back under bearish pressure after breaking the rising trendline. The cleaner plan is to wait for a retest of 4,040–4,045 and watch for rejection. As long as this zone holds as resistance, the downside target toward 4,001, 3,970, and 3,945 remains in focus.
Will gold reject from the broken trendline zone, or break below 4,001 directly toward the Fibonacci 2.618 range?
Short 
IOC Trendline Support Holds, Valuation Backs the Technical StoryOverview
Indian Oil Corporation is holding right at a confluence of technical support on the weekly chart, while also trading at valuations that stand out favorably against its refining peers. This is a good example of technical and fundamental pictures lining up — worth examining both together.
Technical Structure
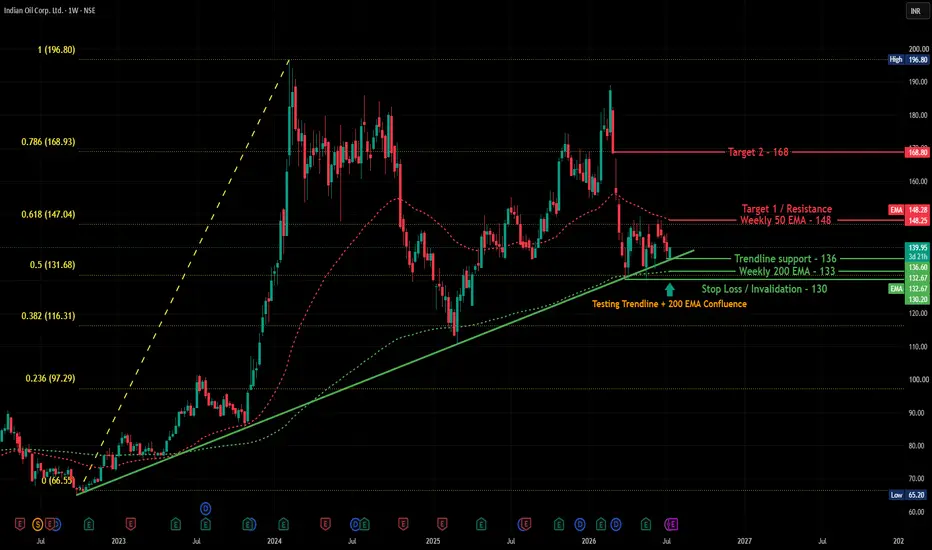
On the weekly chart, IOC is trading at 139.95 (+0.71%), sitting right on a rising trendline support (~136) that has held since the 2022 lows, with the Weekly 200 EMA (132.67) just below it, adding confluence. The Weekly 50 EMA (148.25) sits just above as the immediate resistance to watch. Price also remains inside the broader retracement structure from the 2022 low (65.20) to the 2024 high (196.80), currently hovering near the 0.5 Fibonacci level (131.68).
Trade Setup
Entry: Above 140–142 on a sustained move, using the trendline/200 EMA confluence as the base
Stop Loss (Invalidation): Below 130 (just under the Weekly 200 EMA/trendline confluence zone)
Target 1: 148 (Weekly 50 EMA)
Target 2: 168.80 (0.786 Fibonacci level)
Fundamentals — Why This Matters for Long-Term Investors
Valuation: Trading at a P/E of 4.69, well below peers like Reliance (22.52) and MRPL (15.01) — among the cheapest in the sector
Dividend: Strong dividend yield of 5.00%, with a healthy long-term payout history
Profitability: ROE of 20.74% and ROCE of 18.78%, notably ahead of Reliance (ROE 8.91%) and competitive with BPCL/HPCL
Debt: Carries meaningful debt (₹131,822 Cr), typical for capital-intensive PSU refiners but worth noting relative to peers like CPCL, which run lower debt levels
Earnings trend: FY26 net profit of ₹43,677 Cr marks a sharp recovery from FY25's ₹13,789 Cr, though the multi-year picture is volatile, reflecting sensitivity to crude prices and government fuel pricing policy
Caveat: 10-year compounded sales growth is modest, and earnings volatility here is real — this isn't a smooth-growth story, more a cyclical value-and-yield profile
Beginner's Lesson
When a stock's technical support level aligns with an attractive valuation (like a low P/E relative to peers), it can add conviction to a setup — the chart shows where buyers have historically stepped in, while the fundamentals help explain why. That said, PSU oil marketing companies are heavily influenced by government fuel pricing policy and crude oil price cycles, which can override both charts and valuation in the short term — worth keeping in mind before treating this as a purely technical or purely fundamental call.
Conclusion
IOC presents a case where technical support and reasonable valuation are lining up together. As always, confirm with price action before acting on the technical setup, and consider your own investment horizon and risk tolerance if evaluating this from a fundamentals perspective.
Fundamental data sourced from Screener.in. Not investment advice. For educational purposes only. Please consult your financial advisor before making any investment or trading decisions.
 Long
Long
NIFTY WEEKLY Exp. Short Range Level Analysis for 14th Jul 2026 SGMN SplD BULLISH Above => 24288.
🔕 SGMN SplD Bearish BELOW => 24138.
Mentioned analysis based on 2 consecutive candle close in 15 min Time Frame.
━━━━━🟥🟧🟨🟩🟦🟪⬛━━━━━
💥Level Interpretation / description:
✍🏻L#1: If the candle crossed & stays above the “Buy Gen”, it is treated / considered as Bullish bias. Cfm=> Confirmation.
L#2: Possibility / Probability of REVERSAL near 🔕RL/TF1 & 🔔RL/TF2
L#3: If the candle stays above “Sell Gen” but below “Buy Gen”, it is treated / considered as Sidewise. Aggressive Traders can take Long position near “Sell Gen” either retesting or crossed from Below & vice-versa i.e. can take Short position near “Buy Gen” either retesting or crossed downward from Above.
L#4: If the candle crossed & stays below the “Sell Gen”, it is treated / considered a Bearish bias.
L#5: Possibility / Probability of REVERSAL near 🔕RL/TF1 & 🔔RL/TF2
HZB (Buy side) & HZS (Sell side) => Hurdle Zone,
✍🏻 *** Specialty of “HZB#1, HZB#2 HZS#1 & HZS#2” is Sidewise (behaviour in Nature)
Rest Plotted and Mentioned on Chart
Color code Used:
Green, BLUE =. Positive bias.
Safron, RED =. Negative bias.
RED in Between Green means Trend Finder / Momentum Change
/ CYCLE Change and Vice Versa.
Notice One thing: HOW LEVELS are Working.
Use any Momentum Indicator / Oscillator or as you "USED to" to Take entry.
━━━━━🟥🟧🟨🟩🟦🟪⬛━━━━━
⚠️ DISCLAIMER:
The information, views, and ideas shared here are purely for educational and informational purposes only. They are not intended as investment advice or a recommendation to buy, sell, or hold any financial instruments. I am not a SEBI-registered financial adviser.
Trading and investing in the stock market involves risk, and you should do your own research and analysis. You are solely responsible for any decisions made based on this research.
"🔔As HARD EARNED MONEY IS YOUR's, So DECISION SHOULD HAVE TO BE YOUR's".
━━━━━🟥🟧🟨🟩🟦🟪⬛━━━━━
❇️ Follow notification about periodical View
💥 Do Comment for Stock WEEKLY Level Analysis.🚀
📊 Do you agree with this view?
✈️ HIT THE PLANE ICON if this technical observation resonates with you. It will Motivate me.
━━━━━🟥🟧🟨🟩🟦🟪⬛━━━━━
💡 If You LOOKING any CHART & want for Level and ANALYZE?
Share your desired stock names in the comments below! I will try to analyze the chart Levels, patterns and share my technical view (so far my Knowledge).
If Viewers think It can identify meaningful setups. Looking forward to hearing from all of you — let's keep this discussion going and help each other make better trading decisions.
___________🔕^^^⚫⚪^🙏🏼🙏🏼🙏🏼^⚪⚫^^^🔔___________  Long
Long
MASON XAUUSD – Trendline Break May Target FibonacciXAUUSD is trading around 4,071 after losing short-term recovery momentum near the Ichimoku structure. Price is now testing the rising trendline support, and the early-week focus is on whether gold can hold this structure or break lower.
The priority view is bearish if gold breaks below the trendline and strong support area. A clean breakdown may open the way toward the Fibonacci extension targets.
Technical View
Gold is currently moving inside a tightening structure between the descending resistance line and the rising trendline support. This shows that price is being compressed before a stronger move.
The short-term recovery has failed to break clearly above the Ichimoku resistance. Price remains under pressure near the cloud, which means buyers have not fully regained control. As long as gold stays below the Ichimoku resistance and below the FVG sell order zone, the upside remains limited.
The 4,100–4,106 area is the main FVG sell order zone on the chart. This zone is important because it aligns with the short-term resistance structure, Ichimoku pressure, and the descending trendline area. If gold retests this zone and rejects, it may confirm another lower high before the next bearish leg.
The 4,055–4,065 area is the strong support zone and also connects with the rising trendline. If price breaks below this area, the bullish correction structure may fail. That would confirm a trendline break and shift the short-term market back into stronger bearish continuation.
The first downside target is the Fibonacci 1.618 extension around 4,015–4,020. If selling pressure continues after breaking support, the next deeper target may be the Fibonacci 2.618 area around 3,950–3,960.
Key Zones
Current price: 4,071
FVG sell order zone: 4,100–4,106
Ichimoku resistance area: 4,085–4,111
Strong support: 4,055–4,065
Trendline breakdown zone: below 4,055
Fibonacci 1.618 target: 4,015–4,020
Fibonacci 2.618 target: 3,950–3,960
Invalidation: above 4,116
Trading Plan
Sell Priority: 4,100–4,106
Condition: wait for bearish rejection from the FVG sell order zone, failed recovery above Ichimoku, or a clean break below the rising trendline support.
SL: above 4,116
TP1: 4,055–4,065
TP2: 4,015–4,020
TP3: 3,950–3,960
Alternative Scenario
If gold breaks below 4,055 directly at the start of the week, wait for a retest of the broken trendline or support zone as resistance before looking for sell continuation toward the Fibonacci 1.618 target.
Buy View
Buy is not the priority while price stays below the FVG sell order zone and Ichimoku resistance. A short-term buy reaction may appear around 4,015–4,020, but it needs clear bullish confirmation first.
Final View
Overall, gold is still under short-term bearish pressure. The key point for the start of the week is the rising trendline support. If gold breaks below 4,055–4,065, the correction structure may fail and the downside path toward 4,015 and 3,950 becomes more realistic.
Will gold break the trendline early next week, or retest the FVG sell order zone before moving lower?
Short 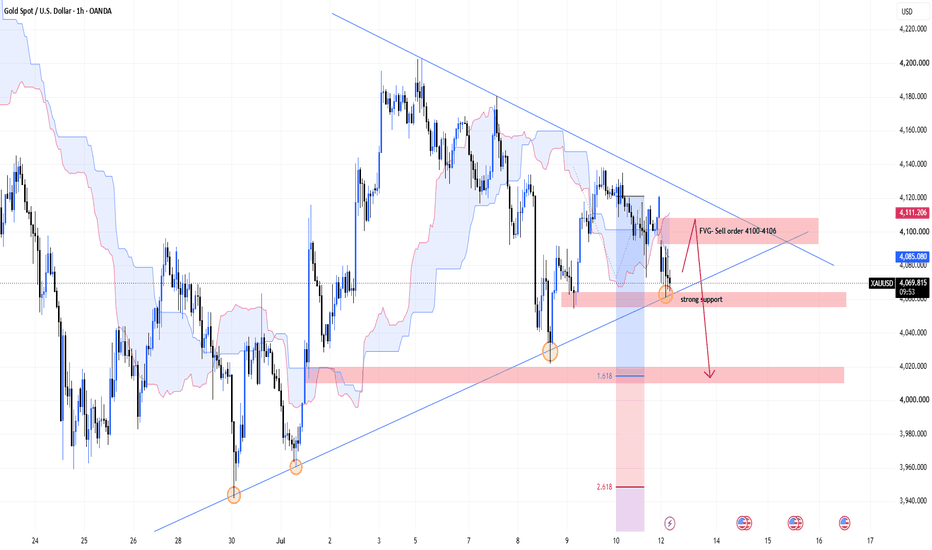
BANKNIFTY DAILY/ Short Range Level Analysis for 13th Jul 2026🔕 SGMN SplD BULLISH Above => 58262.
🔕 SGMN SplD Bearish BELOW => 57844.
Mentioned analysis based on 2 consecutive candle close in 15 min Time Frame.
━━━━━🟥🟧🟨🟩🟦🟪⬛━━━━━
💥Level Interpretation / description:
✍🏻L#1: If the candle crossed & stays above the “Buy Gen”, it is treated / considered as Bullish bias. Cfm=> Confirmation.
L#2: Possibility / Probability of REVERSAL near 🔕RL/TF1 & 🔔RL/TF2
L#3: If the candle stays above “Sell Gen” but below “Buy Gen”, it is treated / considered as Sidewise. Aggressive Traders can take Long position near “Sell Gen” either retesting or crossed from Below & vice-versa i.e. can take Short position near “Buy Gen” either retesting or crossed downward from Above.
L#4: If the candle crossed & stays below the “Sell Gen”, it is treated / considered a Bearish bias.
L#5: Possibility / Probability of REVERSAL near 🔕RL/TF1 & 🔔RL/TF2
HZB (Buy side) & HZS (Sell side) => Hurdle Zone,
✍🏻 *** Specialty of “HZB#1, HZB#2 HZS#1 & HZS#2” is Sidewise (behaviour in Nature)
Rest Plotted and Mentioned on Chart
Color code Used:
Green, BLUE =. Positive bias.
Safron, RED =. Negative bias.
RED in Between Green means Trend Finder / Momentum Change
/ CYCLE Change and Vice Versa.
Notice One thing: HOW LEVELS are Working.
Use any Momentum Indicator / Oscillator or as you "USED to" to Take entry.
━━━━━🟥🟧🟨🟩🟦🟪⬛━━━━━
⚠️ DISCLAIMER:
The information, views, and ideas shared here are purely for educational and informational purposes only. They are not intended as investment advice or a recommendation to buy, sell, or hold any financial instruments. I am not a SEBI-registered financial adviser.
Trading and investing in the stock market involves risk, and you should do your own research and analysis. You are solely responsible for any decisions made based on this research.
"🔔As HARD EARNED MONEY IS YOUR's, So DECISION SHOULD HAVE TO BE YOUR's".
━━━━━🟥🟧🟨🟩🟦🟪⬛━━━━━
❇️ Follow notification about periodical View
💥 Do Comment for Stock WEEKLY Level Analysis.🚀
📊 Do you agree with this view?
✈️ HIT THE PLANE ICON if this technical observation resonates with you. It will Motivate me.
━━━━━🟥🟧🟨🟩🟦🟪⬛━━━━━
💡 If You LOOKING any CHART & want for Level and ANALYZE?
Share your desired stock names in the comments below! I will try to analyze the chart Levels, patterns and share my technical view (so far my Knowledge).
If Viewers think It can identify meaningful setups. Looking forward to hearing from all of you — let's keep this discussion going and help each other make better trading decisions.
___________🔕^^^⚫⚪^🙏🏼🙏🏼🙏🏼^⚪⚫^^^🔔___________ BANKNIFTY WEEKLY/ Short Range Level Analysis: 13th-17th Jul 2026🔔SGMN SplWP BULLISH Above => 58591.
🔔 SGMN SplWP Bearish BELOW => 57396.
Mentioned analysis based on 2 consecutive candle close in 15 min Time Frame.
━━━━━🟥🟧🟨🟩🟦🟪⬛━━━━━
💥Level Interpretation / description:
✍🏻L#1: If the candle crossed & stays above the “Buy Gen”, it is treated / considered as Bullish bias. Cfm=> Confirmation.
L#2: Possibility / Probability of REVERSAL near 🔕RL/TF1 & 🔔RL/TF2
L#3: If the candle stays above “Sell Gen” but below “Buy Gen”, it is treated / considered as Sidewise. Aggressive Traders can take Long position near “Sell Gen” either retesting or crossed from Below & vice-versa i.e. can take Short position near “Buy Gen” either retesting or crossed downward from Above.
L#4: If the candle crossed & stays below the “Sell Gen”, it is treated / considered a Bearish bias.
L#5: Possibility / Probability of REVERSAL near 🔕RL/TF1 & 🔔RL/TF2
HZB (Buy side) & HZS (Sell side) => Hurdle Zone,
✍🏻 *** Specialty of “HZB#1, HZB#2 HZS#1 & HZS#2” is Sidewise (behaviour in Nature)
Rest Plotted and Mentioned on Chart
Color code Used:
Green, BLUE =. Positive bias.
Safron, RED =. Negative bias.
RED in Between Green means Trend Finder / Momentum Change
/ CYCLE Change and Vice Versa.
Notice One thing: HOW LEVELS are Working.
Use any Momentum Indicator / Oscillator or as you "USED to" to Take entry.
━━━━━🟥🟧🟨🟩🟦🟪⬛━━━━━
⚠️ DISCLAIMER:
The information, views, and ideas shared here are purely for educational and informational purposes only. They are not intended as investment advice or a recommendation to buy, sell, or hold any financial instruments. I am not a SEBI-registered financial adviser.
Trading and investing in the stock market involves risk, and you should do your own research and analysis. You are solely responsible for any decisions made based on this research.
"🔔As HARD EARNED MONEY IS YOUR's, So DECISION SHOULD HAVE TO BE YOUR's".
━━━━━🟥🟧🟨🟩🟦🟪⬛━━━━━
❇️ Follow notification about periodical View
💥 Do Comment for Stock WEEKLY Level Analysis.🚀
📊 Do you agree with this view?
✈️ HIT THE PLANE ICON if this technical observation resonates with you. It will Motivate me.
━━━━━🟥🟧🟨🟩🟦🟪⬛━━━━━
💡 If You LOOKING any CHART & want for Level and ANALYZE?
Share your desired stock names in the comments below! I will try to analyze the chart Levels, patterns and share my technical view (so far my Knowledge).
If Viewers think It can identify meaningful setups. Looking forward to hearing from all of you — let's keep this discussion going and help each other make better trading decisions.
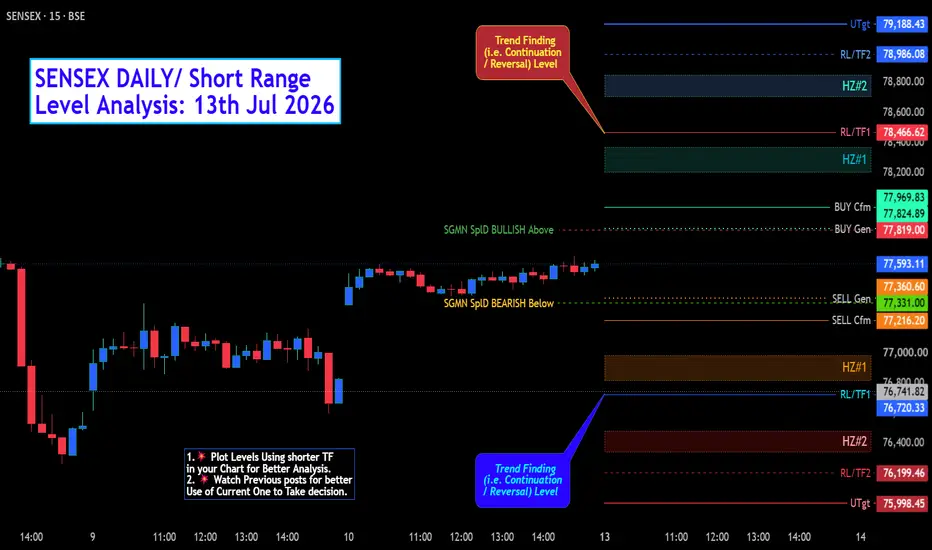
___________🔕^^^⚫⚪^🙏🏼🙏🏼🙏🏼^⚪⚫^^^🔔___________ SENSEX DAILY/ Short Range Level Analysis: 13th Jul 2026🔕 SGMN SplD BULLISH Above => 77819
🔕 SGMN SplD Bearish BELOW => 77331.
Mentioned analysis based on 2 consecutive candle close in 15 min Time Frame.
━━━━━🟥🟧🟨🟩🟦🟪⬛━━━━━
💥Level Interpretation / description:
✍🏻L#1: If the candle crossed & stays above the “Buy Gen”, it is treated / considered as Bullish bias. Cfm=> Confirmation.
L#2: Possibility / Probability of REVERSAL near 🔕RL/TF1 & 🔔RL/TF2
L#3: If the candle stays above “Sell Gen” but below “Buy Gen”, it is treated / considered as Sidewise. Aggressive Traders can take Long position near “Sell Gen” either retesting or crossed from Below & vice-versa i.e. can take Short position near “Buy Gen” either retesting or crossed downward from Above.
L#4: If the candle crossed & stays below the “Sell Gen”, it is treated / considered a Bearish bias.
L#5: Possibility / Probability of REVERSAL near 🔕RL/TF1 & 🔔RL/TF2
HZB (Buy side) & HZS (Sell side) => Hurdle Zone,
✍🏻 *** Specialty of “HZB#1, HZB#2 HZS#1 & HZS#2” is Sidewise (behaviour in Nature)
Rest Plotted and Mentioned on Chart
Color code Used:
Green, BLUE =. Positive bias.
Safron, RED =. Negative bias.
RED in Between Green means Trend Finder / Momentum Change
/ CYCLE Change and Vice Versa.
Notice One thing: HOW LEVELS are Working.
Use any Momentum Indicator / Oscillator or as you "USED to" to Take entry.
━━━━━🟥🟧🟨🟩🟦🟪⬛━━━━━
⚠️ DISCLAIMER:
The information, views, and ideas shared here are purely for educational and informational purposes only. They are not intended as investment advice or a recommendation to buy, sell, or hold any financial instruments. I am not a SEBI-registered financial adviser.
Trading and investing in the stock market involves risk, and you should do your own research and analysis. You are solely responsible for any decisions made based on this research.
"🔔As HARD EARNED MONEY IS YOUR's, So DECISION SHOULD HAVE TO BE YOUR's".
━━━━━🟥🟧🟨🟩🟦🟪⬛━━━━━
❇️ Follow notification about periodical View
💥 Do Comment for Stock WEEKLY Level Analysis.🚀
📊 Do you agree with this view?
✈️ HIT THE PLANE ICON if this technical observation resonates with you. It will Motivate me.
━━━━━🟥🟧🟨🟩🟦🟪⬛━━━━━
💡 If You LOOKING any CHART & want for Level and ANALYZE?
Share your desired stock names in the comments below! I will try to analyze the chart Levels, patterns and share my technical view (so far my Knowledge).
If Viewers think It can identify meaningful setups. Looking forward to hearing from all of you — let's keep this discussion going and help each other make better trading decisions.
___________🔕^^^⚫⚪^🙏🏼🙏🏼🙏🏼^⚪⚫^^^🔔___________ SENSEX WEEKLY/ POSITIONAL Level Analysis: 13th-17th Jul 2026.🔔 SGMN SplD BULLISH Above => 78457.
🔔 SGMN SplD Bearish BELOW => 76425.
Mentioned analysis based on 2 consecutive candle close in 15 min Time Frame.
━━━━━🟥🟧🟨🟩🟦🟪⬛━━━━━
💥Level Interpretation / description:
✍🏻L#1: If the candle crossed & stays above the “Buy Gen”, it is treated / considered as Bullish bias. Cfm=> Confirmation.
L#2: Possibility / Probability of REVERSAL near 🔕RL/TF1 & 🔔RL/TF2
L#3: If the candle stays above “Sell Gen” but below “Buy Gen”, it is treated / considered as Sidewise. Aggressive Traders can take Long position near “Sell Gen” either retesting or crossed from Below & vice-versa i.e. can take Short position near “Buy Gen” either retesting or crossed downward from Above.
L#4: If the candle crossed & stays below the “Sell Gen”, it is treated / considered a Bearish bias.
L#5: Possibility / Probability of REVERSAL near 🔕RL/TF1 & 🔔RL/TF2
HZB (Buy side) & HZS (Sell side) => Hurdle Zone,
✍🏻 *** Specialty of “HZB#1, HZB#2 HZS#1 & HZS#2” is Sidewise (behaviour in Nature)
Rest Plotted and Mentioned on Chart
Color code Used:
Green, BLUE =. Positive bias.
Safron, RED =. Negative bias.
RED in Between Green means Trend Finder / Momentum Change
/ CYCLE Change and Vice Versa.
Notice One thing: HOW LEVELS are Working.
Use any Momentum Indicator / Oscillator or as you "USED to" to Take entry.
━━━━━🟥🟧🟨🟩🟦🟪⬛━━━━━
⚠️ DISCLAIMER:
The information, views, and ideas shared here are purely for educational and informational purposes only. They are not intended as investment advice or a recommendation to buy, sell, or hold any financial instruments. I am not a SEBI-registered financial adviser.
Trading and investing in the stock market involves risk, and you should do your own research and analysis. You are solely responsible for any decisions made based on this research.
"🔔As HARD EARNED MONEY IS YOUR's, So DECISION SHOULD HAVE TO BE YOUR's".
━━━━━🟥🟧🟨🟩🟦🟪⬛━━━━━
❇️ Follow notification about periodical View
💥 Do Comment for Stock WEEKLY Level Analysis.🚀
📊 Do you agree with this view?
✈️ HIT THE PLANE ICON if this technical observation resonates with you. It will Motivate me.
━━━━━🟥🟧🟨🟩🟦🟪⬛━━━━━
💡 If You LOOKING any CHART & want for Level and ANALYZE?
Share your desired stock names in the comments below! I will try to analyze the chart Levels, patterns and share my technical view (so far my Knowledge).
If Viewers think It can identify meaningful setups. Looking forward to hearing from all of you — let's keep this discussion going and help each other make better trading decisions.
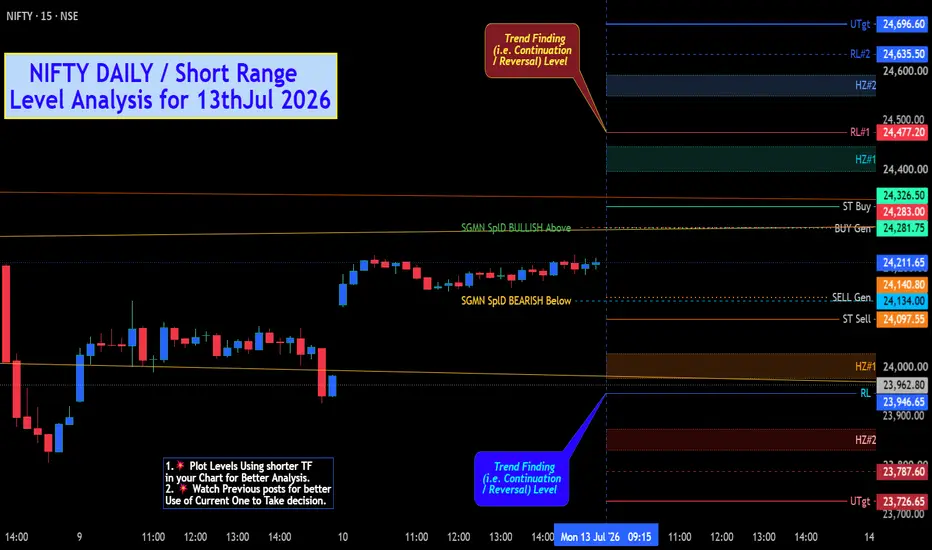
___________🔕^^^⚫⚪^🙏🏼🙏🏼🙏🏼^⚪⚫^^^🔔___________ NIFTY DAILY / Short Range Level Analysis for 13thJul 2026.🔕 SGMN SplD BULLISH Above => 24283.
🔕 SGMN SplD Bearish BELOW => 24134.
Mentioned analysis based on 2 consecutive candle close in 15 min Time Frame.
━━━━━🟥🟧🟨🟩🟦🟪⬛━━━━━
💥Level Interpretation / description:
✍🏻L#1: If the candle crossed & stays above the “Buy Gen”, it is treated / considered as Bullish bias. Cfm=> Confirmation.
L#2: Possibility / Probability of REVERSAL near 🔕RL/TF1 & 🔔RL/TF2
L#3: If the candle stays above “Sell Gen” but below “Buy Gen”, it is treated / considered as Sidewise. Aggressive Traders can take Long position near “Sell Gen” either retesting or crossed from Below & vice-versa i.e. can take Short position near “Buy Gen” either retesting or crossed downward from Above.
L#4: If the candle crossed & stays below the “Sell Gen”, it is treated / considered a Bearish bias.
L#5: Possibility / Probability of REVERSAL near 🔕RL/TF1 & 🔔RL/TF2
HZB (Buy side) & HZS (Sell side) => Hurdle Zone,
✍🏻 *** Specialty of “HZB#1, HZB#2 HZS#1 & HZS#2” is Sidewise (behaviour in Nature)
Rest Plotted and Mentioned on Chart
Color code Used:
Green, BLUE =. Positive bias.
Safron, RED =. Negative bias.
RED in Between Green means Trend Finder / Momentum Change
/ CYCLE Change and Vice Versa.
Notice One thing: HOW LEVELS are Working.
Use any Momentum Indicator / Oscillator or as you "USED to" to Take entry.
━━━━━🟥🟧🟨🟩🟦🟪⬛━━━━━
⚠️ DISCLAIMER:
The information, views, and ideas shared here are purely for educational and informational purposes only. They are not intended as investment advice or a recommendation to buy, sell, or hold any financial instruments. I am not a SEBI-registered financial adviser.
Trading and investing in the stock market involves risk, and you should do your own research and analysis. You are solely responsible for any decisions made based on this research.
"🔔As HARD EARNED MONEY IS YOUR's, So DECISION SHOULD HAVE TO BE YOUR's".
━━━━━🟥🟧🟨🟩🟦🟪⬛━━━━━
❇️ Follow notification about periodical View
💥 Do Comment for Stock WEEKLY Level Analysis.🚀
📊 Do you agree with this view?
✈️ HIT THE PLANE ICON if this technical observation resonates with you. It will Motivate me.
━━━━━🟥🟧🟨🟩🟦🟪⬛━━━━━
💡 If You LOOKING any CHART & want for Level and ANALYZE?
Share your desired stock names in the comments below! I will try to analyze the chart Levels, patterns and share my technical view (so far my Knowledge).
If Viewers think It can identify meaningful setups. Looking forward to hearing from all of you — let's keep this discussion going and help each other make better trading decisions.
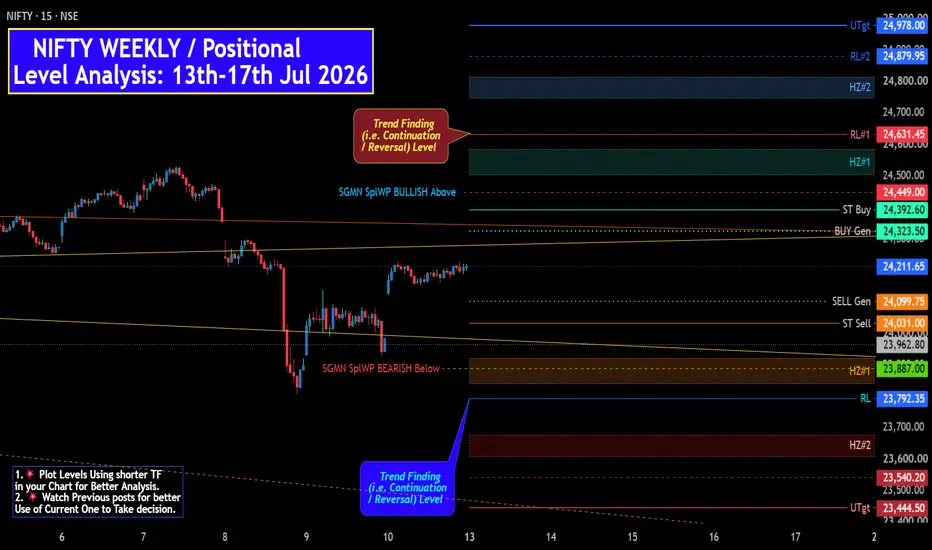
___________🔕^^^⚫⚪^🙏🏼🙏🏼🙏🏼^⚪⚫^^^🔔___________ NIFTY WEEKLY / Positional Level Analysis: 13th-17th Jul 2026.🔔 SGMN SplWP BULLISH Above => 24449.
🔔 SGMN SplWP Bearish BELOW => 23887.
Mentioned analysis based on 2 consecutive candle close in 15 min Time Frame.
━━━━━🟥🟧🟨🟩🟦🟪⬛━━━━━
💥Level Interpretation / description:
✍🏻L#1: If the candle crossed & stays above the “Buy Gen”, it is treated / considered as Bullish bias. Cfm=> Confirmation.
L#2: Possibility / Probability of REVERSAL near 🔕RL/TF1 & 🔔RL/TF2
L#3: If the candle stays above “Sell Gen” but below “Buy Gen”, it is treated / considered as Sidewise. Aggressive Traders can take Long position near “Sell Gen” either retesting or crossed from Below & vice-versa i.e. can take Short position near “Buy Gen” either retesting or crossed downward from Above.
L#4: If the candle crossed & stays below the “Sell Gen”, it is treated / considered a Bearish bias.
L#5: Possibility / Probability of REVERSAL near 🔕RL/TF1 & 🔔RL/TF2
HZB (Buy side) & HZS (Sell side) => Hurdle Zone,
✍🏻 *** Specialty of “HZB#1, HZB#2 HZS#1 & HZS#2” is Sidewise (behaviour in Nature)
Rest Plotted and Mentioned on Chart
Color code Used:
Green, BLUE =. Positive bias.
Safron, RED =. Negative bias.
RED in Between Green means Trend Finder / Momentum Change
/ CYCLE Change and Vice Versa.
Notice One thing: HOW LEVELS are Working.
Use any Momentum Indicator / Oscillator or as you "USED to" to Take entry.
━━━━━🟥🟧🟨🟩🟦🟪⬛━━━━━
⚠️ DISCLAIMER:
The information, views, and ideas shared here are purely for educational and informational purposes only. They are not intended as investment advice or a recommendation to buy, sell, or hold any financial instruments. I am not a SEBI-registered financial adviser.
Trading and investing in the stock market involves risk, and you should do your own research and analysis. You are solely responsible for any decisions made based on this research.
"🔔As HARD EARNED MONEY IS YOUR's, So DECISION SHOULD HAVE TO BE YOUR's".
━━━━━🟥🟧🟨🟩🟦🟪⬛━━━━━
❇️ Follow notification about periodical View
💥 Do Comment for Stock WEEKLY Level Analysis.🚀
📊 Do you agree with this view?
✈️ HIT THE PLANE ICON if this technical observation resonates with you. It will Motivate me.
━━━━━🟥🟧🟨🟩🟦🟪⬛━━━━━
💡 If You LOOKING any CHART & want for Level and ANALYZE?
Share your desired stock names in the comments below! I will try to analyze the chart Levels, patterns and share my technical view (so far my Knowledge).
If Viewers think It can identify meaningful setups. Looking forward to hearing from all of you — let's keep this discussion going and help each other make better trading decisions.
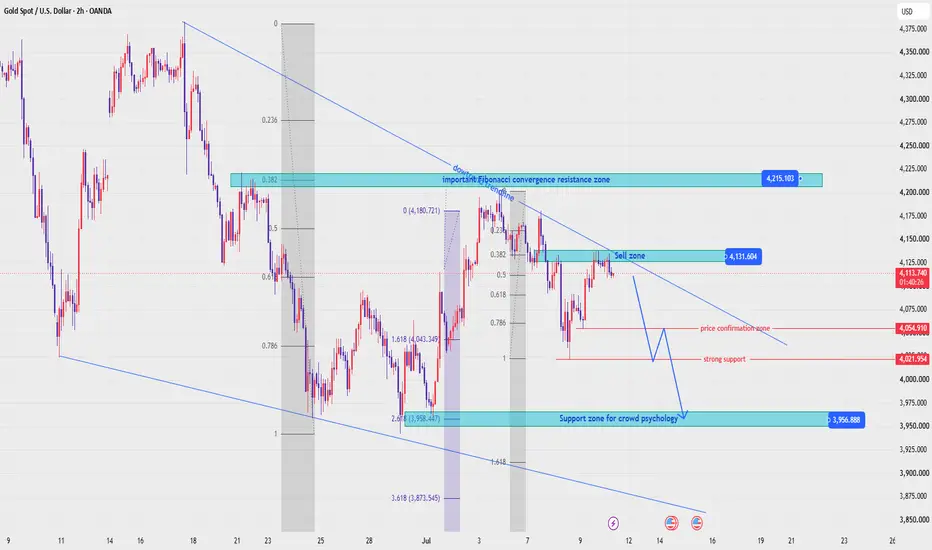
___________🔕^^^⚫⚪^🙏🏼🙏🏼🙏🏼^⚪⚫^^^🔔___________ XAUUSD — Recovery First, Bearish Rejection Later
Fundamental Analysis
Gold remains sensitive to USD momentum, Treasury yields, and upcoming U.S. macro data. For next week, price may create a technical recovery first, but the larger structure still shows bearish pressure while gold stays below the main descending trendline.
Technical Analysis
On the 12H chart, XAUUSD is trading around 4,120 after holding above short-term support. The first upside area to watch is 4,204, which acts as strong resistance. If price continues higher, the major sell zone is around 4,300 - 4,310, where Fibonacci resistance, previous structure, and the descending trendline align. A rejection from this area could send gold back toward 3,942, then the deeper Fibonacci target near 3,754.
Important Key Levels
Current price: 4,120
Short-term resistance: 4,204
Main sell zone: 4,300 - 4,310
Strong support: 3,942
Main Fibonacci target: 3,754 - 3,751
Invalidation: above 4,310
Trading Scenario
Main Sell Setup
Entry: 4,300 - 4,310
Stop Loss: 4,360
Take Profit 1: 4,204
Take Profit 2: 3,942
Take Profit 3: 3,754 - 3,751
Sell Condition
Wait for gold to recover toward the 4,300 - 4,310 Fibonacci sell zone. A valid sell setup needs bearish rejection from this area, such as a long upper wick, failed breakout, or bearish candle close below the zone. If price rejects and breaks back below 4,204, the bearish continuation view becomes stronger. If price breaks and holds above 4,310, the sell setup is invalid.
Overall View
The main plan for next week is not to sell too early at the current price. Gold may rise first toward 4,204 or even 4,300 - 4,310 before sellers return. As long as price stays below the descending trendline and rejects the Fibonacci sell zone, the larger downside target remains 3,942 and 3,754.
Do you share the same view that gold may recover first before the next bearish move?
Short 
MASON XAUUSD – Accumulation Inside Bearish Channel
XAUUSD is trading around 4,120 while still moving inside the medium-term descending channel. Although the broader structure has not fully broken out yet, gold is showing strong accumulation around the lower-middle area of the channel.
The priority view is that gold may continue building a base above the 4,080–4,095 buy zone before attempting a stronger medium-term recovery toward the upper resistance zones.
Technical View
Gold is still inside a bearish price channel on the 6H structure. The upper trendline of the channel continues to act as the main resistance, so the market has not confirmed a full bullish reversal yet.
However, the recent price action shows a clear change in behaviour. Instead of continuing lower after reaching the lower channel area, gold started to form a stronger accumulation base. This means sellers are losing momentum, while buyers are slowly defending the market around the 4,080–4,095 area.
The 4,080–4,095 zone is the key buy zone on the chart. This area is important because price has reacted from it several times, and it also sits near the lower accumulation structure. As long as gold holds above this zone, the recovery scenario remains valid.
Ichimoku is still important here. Price is trying to recover around the Ichimoku structure, but it still needs a clean break above the short-term resistance around 4,162 to confirm stronger bullish momentum. If gold can break and hold above this level, the next move may target the descending channel resistance.
The first major upside area is around 4,300–4,330, marked as the market psychology sell zone. This area may create some reaction first. If buyers can absorb the selling pressure there, gold may continue toward 4,400–4,420 and later the Fibonacci resistance zone around 4,500–4,530.
Key Zones
Current price: 4,120
Main buy zone: 4,080–4,095
Short-term support: 4,033–4,050
Bullish confirmation: above 4,162
Channel resistance area: 4,280–4,330
Market psychology sell zone: 4,300–4,330
Price reaction zone: 4,400–4,420
Fibonacci resistance: 4,500–4,530
Invalidation: below 4,033
Trading Plan
Buy Priority: 4,080–4,095
Condition: wait for bullish rejection, higher low formation, or price holding above the buy zone and Ichimoku support.
SL: below 4,033
TP1: 4,162
TP2: 4,300–4,330
TP3: 4,400–4,420
Final target: 4,500–4,530
Alternative Scenario
If gold breaks above 4,162 directly, wait for a retest of this level as support before looking for buy continuation. A clean hold above 4,162 would confirm that accumulation is turning into a stronger bullish recovery phase.
Sell View
Sell is not the priority while price continues to hold above 4,080–4,095. A short-term sell reaction may appear around 4,300–4,330 because this is still channel resistance and a psychological supply zone. However, unless gold breaks below 4,033, any pullback from that area should be treated as correction inside a larger recovery attempt.
Final View
Overall, gold remains inside a medium-term bearish channel, but the price behaviour is no longer strongly bearish. The market is showing accumulation above the buy zone, and this may prepare for a stronger bullish move if 4,162 breaks cleanly. As long as 4,080–4,095 holds, the medium-term recovery path toward 4,300, 4,400, and 4,500 remains possible.
Will gold complete the accumulation phase and break the channel resistance, or retest the buy zone one more time before the next bullish leg?
Long 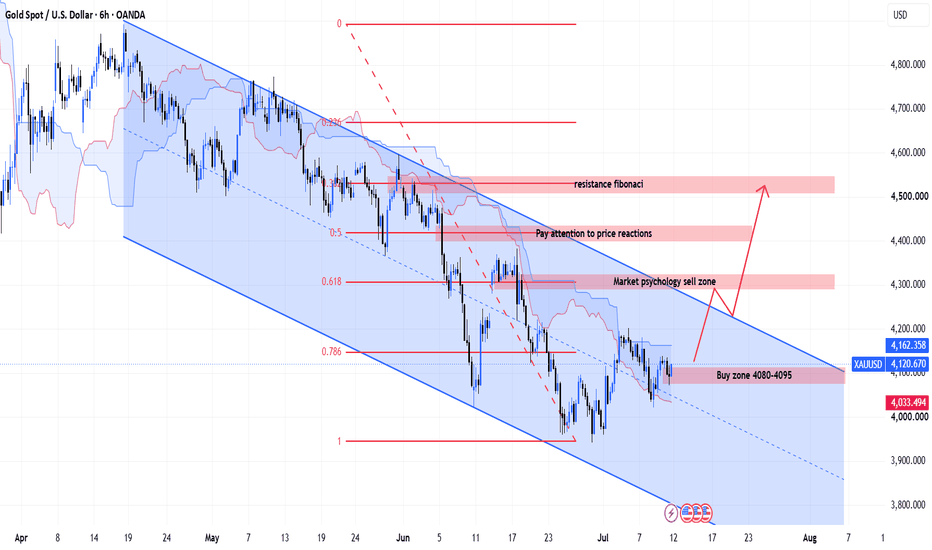
 Long
Long
XAUUSD — Bullish Channel Holds Above Buy Zone
Fundamental Analysis
Gold is still reacting to USD momentum, Treasury yields, and upcoming U.S. macro data. For now, the short-term structure remains positive while price continues to hold inside the rising channel.
Technical Analysis
On the 2H chart, XAUUSD is trading around 4,142 and still respecting the bullish channel structure. The main buy order trendline zone is around 4,141 - 4,143. If price holds this area, buyers may continue to defend the trend and push gold toward the liquidity zone at 4,144, then the mid-channel resistance around 4,145 - 4,146. A stronger breakout above this area may open the way toward the main target around 4,152.
Important Key Levels
Current price: 4,142
Main buy zone: 4,141 - 4,143
Short-term support: 4,140
Liquidity resistance: 4,144
Mid-channel resistance: 4,145 - 4,146
Main target: 4,152
Invalidation: below 4,140
Trading Scenario
Main Buy Setup
Entry: 4,141 - 4,143
Stop Loss: 4,140
Take Profit 1: 4,144
Take Profit 2: 4,145 - 4,146
Take Profit 3: 4,152
Buy Condition
Wait for gold to retest the 4,141 - 4,143 buy zone and show bullish rejection. A clean hold above the trendline keeps the bullish setup valid. If price breaks above 4,144, upside momentum becomes stronger toward 4,145 - 4,146 and 4,152. If price breaks and holds below 4,140, the buy setup is invalid.
Overall View
XAUUSD remains bullish while price stays inside the rising channel and holds above the buy order trendline zone. The preferred plan is to wait for confirmation around 4,141 - 4,143, then look for continuation toward 4,144, 4,146, and 4,152.
Do you share the same bullish view on gold, or are you waiting for confirmation above the liquidity zone first?
Short 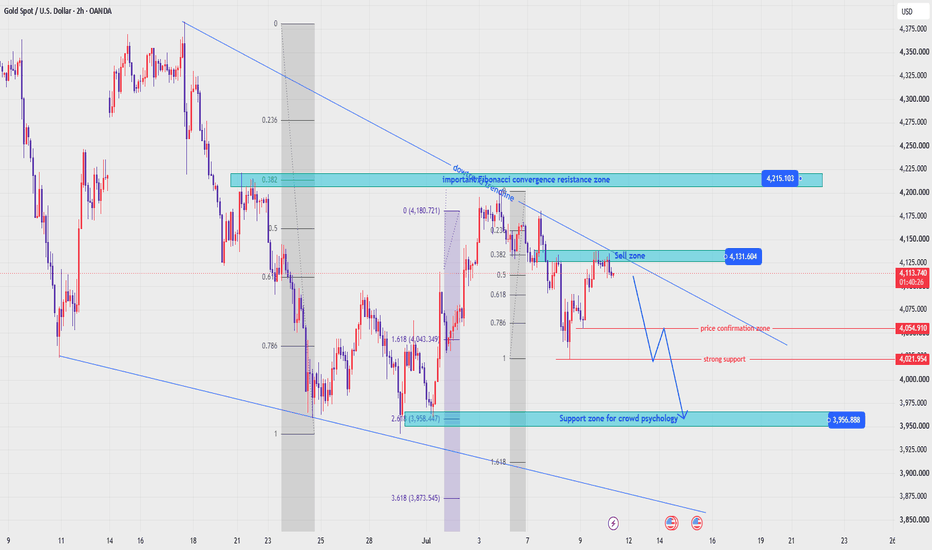
MASON XAUUSD – Bullish Pullback Before Mid-Term Rally
XAUUSD is trading around 4,123 after recovering from the short-term correction zone. Price is still holding above the main uptrend trendline, while the current pullback is moving around the Fibonacci reaction area.
The priority view remains bullish in the medium term, as long as gold continues to hold above the buy order zone and the rising trendline support.
Technical View
Gold is still moving inside a bullish recovery structure. The higher low formation from the previous support area shows that buyers are still defending the market, even though price is currently correcting below the short-term descending trendline.
The most important point on this chart is the uptrend trendline. Price has respected this trendline several times, which means the broader bullish structure remains valid while gold stays above it.
The 4,101–4,106 area is the main buy order zone. This zone is important because it aligns with the Fibonacci correction area, the rising trendline support, and the previous reaction zone. If gold pulls back into this area and holds, it may confirm another higher low before the next bullish leg.
Short term, price may still face resistance around 4,138 and 4,159. The 4,159 area is marked as a sell order zone, so some rejection or consolidation may appear there first. However, if gold breaks and holds above 4,159, the bullish structure may open a stronger move toward the 4,203 resistance.
Ichimoku also supports the idea that the market is trying to recover. Price has moved back near the Ichimoku structure, and if buyers can keep price above the cloud support, the next medium-term bullish continuation will become more convincing.
Key Zones
Current price: 4,123
Buy order zone: 4,101–4,106
Trendline support: 4,095–4,106
Short-term resistance: 4,138
Sell order reaction zone: 4,159
Major resistance: 4,203
Ichimoku support area: 4,067–4,101
Invalidation: below 4,067
Trading Plan
Buy Priority: 4,101–4,106
Condition: wait for bullish rejection, higher low formation, or price holding above the uptrend trendline and Fibonacci support area.
SL: below 4,067
TP1: 4,138
TP2: 4,159
TP3: 4,203
Alternative Scenario
If gold breaks above 4,159 directly, wait for a retest of this zone as support before looking for buy continuation toward 4,203. A clean hold above 4,159 would confirm stronger bullish momentum for the medium-term move.
Sell View
Sell is not the priority while price stays above the uptrend trendline and the 4,101–4,106 buy order zone. A short-term sell reaction may appear around 4,159, but it should only be treated as a correction unless gold breaks below 4,067.
Final View
Overall, gold remains in a bullish structure. The current movement looks more like a Fibonacci correction before continuation rather than a full bearish reversal. The cleaner plan is to wait for price to hold the 4,101–4,106 buy zone, then follow the next bullish leg toward 4,138, 4,159, and potentially 4,203.
Will gold respect the Fibonacci buy zone and start the next bullish leg, or retest the trendline support first?
Long 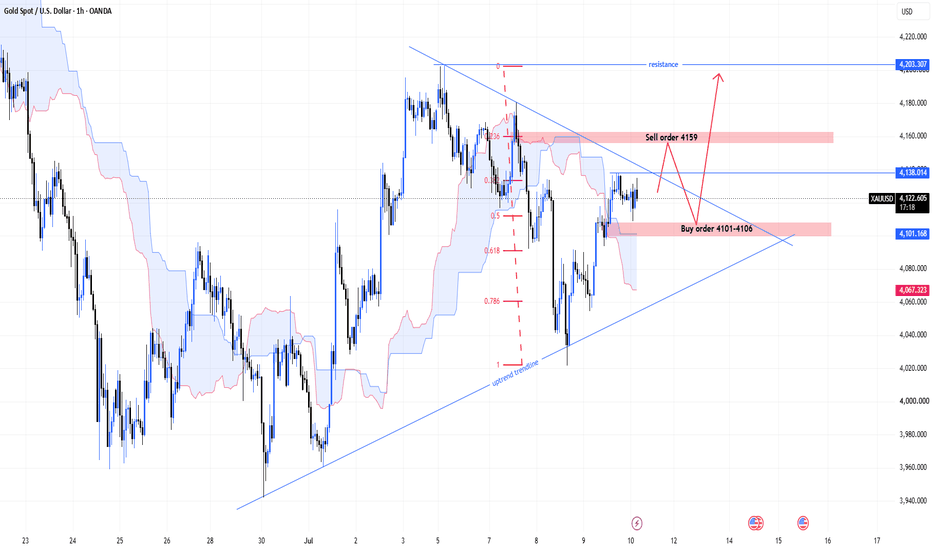
 Long
Long