BANKNIFTY Short Range/ Intra-Swing Level Analysis 09th '26 BANKNIFTY Short range /
Intra - Swing Level Analysis
for 09th MAR 2026
Amid USA + Israel Vs. IRAN War.
BANKNIFTY can take Great Role for Pull Back / REVERSAL of NIFTY.
━━━🟡🟢🔵 PCR Data Analysis🔵🟢🟡━━━
🟣 MAR EXP. Monthly PCR Analysis:
Put OI: 4,10,212, Call OI: 5,11,319, PCR: 0.80. Trend Strength: 🟠Neutral.
Intraday Change in Monthly Basis Data =>
Put OI Change: 15,927, Call OI Change: 68,766, Change OI PCR: 0.23. Trend Strength: 🛑 Extreme Bearish.
━━━🟡🟢🔵Some Technical Parameter:🔵🟢🟡━━━
🛑 VWap vs Price: Price Below.
🟠 RSI(14): 31.91 (Near OverSOLD)
🟠 Stoch Bias(14): 2.18, 11.12 (DN but OverSOLD)
🛑 MACD Bias (12,26): -371.07, -222.41, 148.66 (Bearish)
🟡 Williams %R: -97.82 (Perfect Reversal Point Near -80)
🟠 ROC: -3.99
Time Frame basis Trend:
🟢Bullish: Weekly, Monthly
🛑Bearish:. 1 Min, 5 Min, 15 Min, 30 Min, 1 Hour, 2 Hour, 4 Hour, Daily
━━━🟡🟢🔵 MA (Moving Average) Analysis 🔵🟢🟡━━━
Except 200SMA & 200EMA all major Averages are Above Index Value.
⚫ Period ⚪SMA ⚪EMA
🟥 MA 9 - 60056.18 - 59604.77
🟥 MA 20 - 60458.96 - 60028.06
🟥 MA 50 - 59884.78 - 59819.03
🟥 MA 100 - 59236.11 - 59025.18
🟩 MA 200 - 57494.79 - 57432.86
━━━━━🟥🟧🟨🟩🟦🟪⬛━━━━━
💥Level Interpretation / description:
L#1: If the candle crossed & stays above the “Buy Gen”, it is treated / considered as Bullish bias.
L#2: Possibility / Probability of REVERSAL near RLB#1 & UBTgt
L#3: If the candle stays above “Sell Gen” but below “Buy Gen”, it is treated / considered as Sidewise. Aggressive Traders can take Long position near “Sell Gen” either retesting or crossed from Below & vice-versa i.e. can take Short position near “Buy Gen” either retesting or crossed downward from Above.
L#4: If the candle crossed & stays below the “Sell Gen”, it is treated / considered a Bearish bias.
L#5: Possibility / Probability of REVERSAL near RLS#1 & USTgt
HZB (Buy side) & HZS (Sell side) => Hurdle Zone,
*** Specialty of “HZB#1, HZB#2 HZS#1 & HZS#2” is Sidewise (behaviour in Nature)
Rest Plotted and Mentioned on Chart
Color code Used:
Green =. Positive bias.
Red =. Negative bias.
RED in Between Green means Trend Finder / Momentum Change
/ CYCLE Change and Vice Versa.
Notice One thing: HOW LEVELS are Working.
Use any Momentum Indicator / Oscillator or as you "USED to" to Take entry.
━━━━━🟥🟧🟨🟩🟦🟪⬛━━━━━
⚠️ DISCLAIMER:
The information, views, and ideas shared here are purely for educational and informational purposes only. They are not intended as investment advice or a recommendation to buy, sell, or hold any financial instruments. I am not a SEBI-registered financial adviser.
Trading and investing in the stock market involves risk, and you should do your own research and analysis. You are solely responsible for any decisions made based on this research.
"🔔As HARD EARNED MONEY IS YOUR's, So DECISION SHOULD HAVE TO BE YOUR's".
━━━━━🟥🟧🟨🟩🟦🟪⬛━━━━━
❇️ Follow notification about periodical View
💥 Do Comment for Stock WEEKLY Level Analysis.🚀
📊 Do you agree with this view?
✈️ HIT THE PLANE ICON if this technical observation resonates with you. It will Motivate me.
━━━━━🟥🟧🟨🟩🟦🟪⬛━━━━━
💡 If You LOOKING any CHART & want for Level and ANALYZE?
Share your desired stock names in the comments below! I will try to analyze the chart Levels, patterns and share my technical view (so far my Knowledge).
If Viewers think It can identify meaningful setups. Looking forward to hearing from all of you — let's keep this discussion going and help each other make better trading decisions.
___________🔕^^^⚫⚪^^^⚪⚫^^^🔔___________ GIFTNIFTY WEEKLY Level Analysis for 09th - 13th MAR 2026GIFTNIFTY WEEKLY Level Analysis for 09th - 13th MAR 2026
Find Common Levels of Short Range / Intra-Swing & Weekly Levels
━━━━━🟥🟧🟨🟩🟦🟪⬛━━━━━
💥Level Interpretation / description:
L#1: If the candle crossed & stays above the “Buy Gen”, it is treated / considered as Bullish bias.
L#2: Possibility / Probability of REVERSAL near RLB#1 & UBTgt
L#3: If the candle stays above “Sell Gen” but below “Buy Gen”, it is treated / considered as Sidewise. Aggressive Traders can take Long position near “Sell Gen” either retesting or crossed from Below & vice-versa i.e. can take Short position near “Buy Gen” either retesting or crossed downward from Above.
L#4: If the candle crossed & stays below the “Sell Gen”, it is treated / considered a Bearish bias.
L#5: Possibility / Probability of REVERSAL near RLS#1 & USTgt
HZB (Buy side) & HZS (Sell side) => Hurdle Zone,
*** Specialty of “HZB#1, HZB#2 HZS#1 & HZS#2” is Sidewise (behaviour in Nature)
Rest Plotted and Mentioned on Chart
Color code Used:
Green =. Positive bias.
Red =. Negative bias.
RED in Between Green means Trend Finder / Momentum Change
/ CYCLE Change and Vice Versa.
Notice One thing: HOW LEVELS are Working.
Use any Momentum Indicator / Oscillator or as you "USED to" to Take entry.
━━━━━🟥🟧🟨🟩🟦🟪⬛━━━━━
⚠️ DISCLAIMER:
The information, views, and ideas shared here are purely for educational and informational purposes only. They are not intended as investment advice or a recommendation to buy, sell, or hold any financial instruments. I am not a SEBI-registered financial adviser.
Trading and investing in the stock market involves risk, and you should do your own research and analysis. You are solely responsible for any decisions made based on this research.
"🔔As HARD EARNED MONEY IS YOUR's, So DECISION SHOULD HAVE TO BE YOUR's".
━━━━━🟥🟧🟨🟩🟦🟪⬛━━━━━
❇️ Follow notification about periodical View
💥 Do Comment for Stock WEEKLY Level Analysis.🚀
📊 Do you agree with this view?
✈️ HIT THE PLANE ICON if this technical observation resonates with you. It will Motivate me.
━━━━━🟥🟧🟨🟩🟦🟪⬛━━━━━
💡 If You LOOKING any CHART & want for Level and ANALYZE?
Share your desired stock names in the comments below! I will try to analyze the chart Levels, patterns and share my technical view (so far my Knowledge).
If Viewers think It can identify meaningful setups. Looking forward to hearing from all of you — let's keep this discussion going and help each other make better trading decisions.
___________🔕^^^⚫⚪^^^⚪⚫^^^🔔___________ GIFTNIFTY Intra-Swing Level Analysis for 09th MAR 2026+GIFTNIFTY Short range / Intra-Swing Level Analysis for 09th MAR 2026
Closes -274🔻 points more in Second session on 06th Mar 2026.
As per that Conclusion: Gap DN🔻, though WAR situation & announcement from GOVT. as well as administration of Active / Passive related countries took major roll for Monday's Market opening.
🔔Find common Levels at 9.00 am of Monday with Premium / Discount adjustment.
━━━━━🟥🟧🟨🟩🟦🟪⬛━━━━━
💥Level Interpretation / description:
L#1: If the candle crossed & stays above the “Buy Gen”, it is treated / considered as Bullish bias.
L#2: Possibility / Probability of REVERSAL near RLB#1 & UBTgt
L#3: If the candle stays above “Sell Gen” but below “Buy Gen”, it is treated / considered as Sidewise. Aggressive Traders can take Long position near “Sell Gen” either retesting or crossed from Below & vice-versa i.e. can take Short position near “Buy Gen” either retesting or crossed downward from Above.
L#4: If the candle crossed & stays below the “Sell Gen”, it is treated / considered a Bearish bias.
L#5: Possibility / Probability of REVERSAL near RLS#1 & USTgt
HZB (Buy side) & HZS (Sell side) => Hurdle Zone,
*** Specialty of “HZB#1, HZB#2 HZS#1 & HZS#2” is Sidewise (behaviour in Nature)
Rest Plotted and Mentioned on Chart
Color code Used:
Green =. Positive bias.
Red =. Negative bias.
RED in Between Green means Trend Finder / Momentum Change
/ CYCLE Change and Vice Versa.
Notice One thing: HOW LEVELS are Working.
Use any Momentum Indicator / Oscillator or as you "USED to" to Take entry.
━━━━━🟥🟧🟨🟩🟦🟪⬛━━━━━
⚠️ DISCLAIMER:
The information, views, and ideas shared here are purely for educational and informational purposes only. They are not intended as investment advice or a recommendation to buy, sell, or hold any financial instruments. I am not a SEBI-registered financial adviser.
Trading and investing in the stock market involves risk, and you should do your own research and analysis. You are solely responsible for any decisions made based on this research.
"🔔As HARD EARNED MONEY IS YOUR's, So DECISION SHOULD HAVE TO BE YOUR's".
━━━━━🟥🟧🟨🟩🟦🟪⬛━━━━━
❇️ Follow notification about periodical View
💥 Do Comment for Stock WEEKLY Level Analysis.🚀
📊 Do you agree with this view?
✈️ HIT THE PLANE ICON if this technical observation resonates with you. It will Motivate me.
━━━━━🟥🟧🟨🟩🟦🟪⬛━━━━━
💡 If You LOOKING any CHART & want for Level and ANALYZE?
Share your desired stock names in the comments below! I will try to analyze the chart Levels, patterns and share my technical view (so far my Knowledge).
If Viewers think It can identify meaningful setups. Looking forward to hearing from all of you — let's keep this discussion going and help each other make better trading decisions.
___________🔕^^^⚫⚪^^^⚪⚫^^^🔔___________
DowJones (DJI) Intra_Swing Levels 06th - 07th MAR 2026 (2:30 am)DowJones (DJI) Intra_Swing Levels 06th - 07th MAR 2026 (2:30 am)
@ 48068 Crucial Level , Above Strong, Below Weak.
Screen Shot of 05th Mar 2026 Movement.
━━━━━🟥🟧🟨🟩🟦🟪⬛━━━━━
💥Level Interpretation / description:
L#1: If the candle crossed & stays above the “Buy Gen”, it is treated / considered as Bullish bias.
L#2: Possibility / Probability of REVERSAL near RLB#1 & UBTgt
L#3: If the candle stays above “Sell Gen” but below “Buy Gen”, it is treated / considered as Sidewise. Aggressive Traders can take Long position near “Sell Gen” either retesting or crossed from Below & vice-versa i.e. can take Short position near “Buy Gen” either retesting or crossed downward from Above.
L#4: If the candle crossed & stays below the “Sell Gen”, it is treated / considered a Bearish bias.
L#5: Possibility / Probability of REVERSAL near RLS#1 & USTgt
HZB (Buy side) & HZS (Sell side) => Hurdle Zone,
*** Specialty of “HZB#1, HZB#2 HZS#1 & HZS#2” is Sidewise (behaviour in Nature)
Rest Plotted and Mentioned on Chart
Color code Used:
Green =. Positive bias.
Red =. Negative bias.
RED in Between Green means Trend Finder / Momentum Change
/ CYCLE Change and Vice Versa.
Notice One thing: HOW LEVELS are Working.
Use any Momentum Indicator / Oscillator or as you "USED to" to Take entry.
━━━━━🟥🟧🟨🟩🟦🟪⬛━━━━━
⚠️ DISCLAIMER:
The information, views, and ideas shared here are purely for educational and informational purposes only. They are not intended as investment advice or a recommendation to buy, sell, or hold any financial instruments. I am not a SEBI-registered financial adviser.
Trading and investing in the stock market involves risk, and you should do your own research and analysis. You are solely responsible for any decisions made based on this research.
"🔔As HARD EARNED MONEY IS YOUR's, So DECISION SHOULD HAVE TO BE YOUR's".
━━━━━🟥🟧🟨🟩🟦🟪⬛━━━━━
❇️ Follow notification about periodical View
💥 Do Comment for Stock WEEKLY Level Analysis.🚀
📊 Do you agree with this view?
✈️ HIT THE PLANE ICON if this technical observation resonates with you. It will Motivate me.
━━━━━🟥🟧🟨🟩🟦🟪⬛━━━━━
💡 If You LOOKING any CHART & want for Level and ANALYZE?
Share your desired stock names in the comments below! I will try to analyze the chart Levels, patterns and share my technical view (so far my Knowledge).
If Viewers think It can identify meaningful setups. Looking forward to hearing from all of you — let's keep this discussion going and help each other make better trading decisions.
___________🔕^^^⚫⚪^^^⚪⚫^^^🔔___________
XAUUSD (H1) — NFP Day Sell remains the main plan while price stays below the descending trendline
Today is an NFP session, and gold often whipsaws both sides before the real direction shows up. So instead of guessing tops/bottoms, the focus is on levels + reaction.
On H1, the structure is still under pressure: price remains below the descending trendline, and the bounces so far look like technical pullbacks within a short-term bearish phase.
Key zones on the map
Sell zone (primary focus)
Around 5,150 – 5,165 (supply + close to the descending trendline).
This is the area to watch for a clean rejection to follow the main bias.
Mid support / scalp buy area (reaction zone)
Around 4,960 – 4,980
This can produce a technical bounce, but it’s not a preferred swing-buy area if selling pressure stays strong.
Main buy zone (after the flush)
Around 4,800 – 4,820
This is where a stronger reaction is more likely, suitable for looking for a proper rebound after liquidity is cleared.
Trading scenarios
Primary scenario: Sell the retest
If price pulls back into 5,150 – 5,165 and shows weakness (upper wick / rejection close / failure to hold above the zone)
→ Look for SELL
→ Target 1: 5,000
→ Target 2: 4,960 – 4,980
→ Target 3: 4,800 – 4,820
No-sell scenario: acceptance above the zone
If price closes and holds above the sell zone and breaks the descending trendline
→ Avoid forcing shorts and wait for a retest to reassess direction.
NFP note (risk control)
During the release window, it’s safer to reduce size, avoid jumping in at the exact print, and wait for a confirmed candle close to avoid getting swept.
Takeaway
Sell is the main point today — but only if price retests 5,150–5,165 and rejects. If the market dumps hard, the key reactions to watch are 4,960–4,980, and especially 4,800–4,820 for a higher-quality bounce after the flush.
Which NFP path do you expect: retest higher then drop, or straight dump to grab liquidity first?  Short
Short
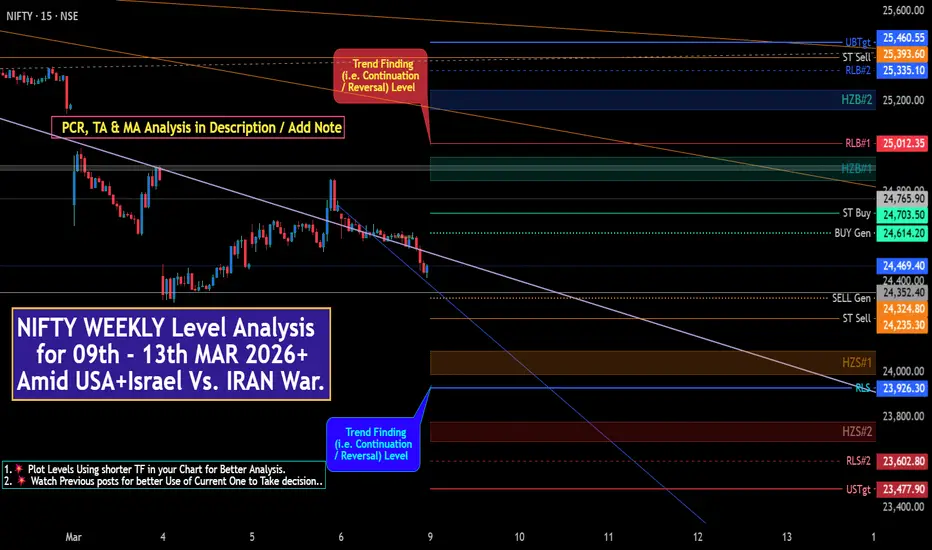
NIFTY WEEKLY Level Analysis for 09th - 13th MAR 2026+NIFTY WEEKLY Level Analysis for 09th - 13th MAR 2026+
Amid USA+Israel Vs. IRAN War.
WEEKLY Movement 02 - 06 Mar 2026
Made Low Below WEEKLY "USTgt" Level, but Close Above That.
━━━━━🟥🟧🟨🟩🟦🟪⬛━━━━━
💥Level Interpretation / description:
L#1: If the candle crossed & stays above the “Buy Gen”, it is treated / considered as Bullish bias.
L#2: Possibility / Probability of REVERSAL near RLB#1 & UBTgt
L#3: If the candle stays above “Sell Gen” but below “Buy Gen”, it is treated / considered as Sidewise. Aggressive Traders can take Long position near “Sell Gen” either retesting or crossed from Below & vice-versa i.e. can take Short position near “Buy Gen” either retesting or crossed downward from Above.
L#4: If the candle crossed & stays below the “Sell Gen”, it is treated / considered a Bearish bias.
L#5: Possibility / Probability of REVERSAL near RLS#1 & USTgt
HZB (Buy side) & HZS (Sell side) => Hurdle Zone,
*** Specialty of “HZB#1, HZB#2 HZS#1 & HZS#2” is Sidewise (behaviour in Nature)
Rest Plotted and Mentioned on Chart
Color code Used:
Green =. Positive bias.
Red =. Negative bias.
RED in Between Green means Trend Finder / Momentum Change
/ CYCLE Change and Vice Versa.
Notice One thing: HOW LEVELS are Working.
Use any Momentum Indicator / Oscillator or as you "USED to" to Take entry.
━━━━━🟥🟧🟨🟩🟦🟪⬛━━━━━
⚠️ DISCLAIMER:
The information, views, and ideas shared here are purely for educational and informational purposes only. They are not intended as investment advice or a recommendation to buy, sell, or hold any financial instruments. I am not a SEBI-registered financial adviser.
Trading and investing in the stock market involves risk, and you should do your own research and analysis. You are solely responsible for any decisions made based on this research.
"🔔As HARD EARNED MONEY IS YOUR's, So DECISION SHOULD HAVE TO BE YOUR's".
━━━━━🟥🟧🟨🟩🟦🟪⬛━━━━━
❇️ Follow notification about periodical View
💥 Do Comment for Stock WEEKLY Level Analysis.🚀
📊 Do you agree with this view?
✈️ HIT THE PLANE ICON if this technical observation resonates with you. It will Motivate me.
━━━━━🟥🟧🟨🟩🟦🟪⬛━━━━━
💡 If You LOOKING any CHART & want for Level and ANALYZE?
Share your desired stock names in the comments below! I will try to analyze the chart Levels, patterns and share my technical view (so far my Knowledge).
If Viewers think It can identify meaningful setups. Looking forward to hearing from all of you — let's keep this discussion going and help each other make better trading decisions.
___________🔕^^^⚫⚪^^^⚪⚫^^^🔔___________ NIFTY WEEKLY Level Amid USA+Israel Vs. IRAN War.Amid USA+Israel Vs. IRAN War.
NIFTY WEEKLY Level Analysis from 02nd - 06th MAR 2026
Nifty may test 🔔COMBO Zone 24769("RLS#1in WEEKLY" – 24,759🔺 ("USTgt in DAILY")
Long Entry can be initiated Above mentioned Zone.
One can OPT 25000 Ce of 30th Mar 2026 EXP. Near @ 275 Level.
🟣⚫⚪USA + Israel vs Iran Conflict (Feb 28–March 1, 2026) Impact on Sectors of Indian Stock Market ⚪⚫🟣
The escalation — US and Israeli strikes on Iran (including the reported killing of Supreme Leader Khamenei) and Iran’s retaliatory missile attacks — has triggered sharp risk-off sentiment. Indian markets are expected to open with a gap-down of 1–2% on Monday (March 2), with elevated volatility (India VIX likely to spike). Crude oil has already jumped toward $73–80 levels, raising fears of supply disruption via the Strait of Hormuz.
Key Impacted Sectors
⚪Sector => ⚫Impact+> 🟣 Direction Reasons & Key Stocks to Watch
🟩 Defence: Strongly Positive
Heightened geopolitical tensions and expected increase in global defence orders. HAL, BEL, Bharat Dynamics, Mazagon Dock, GRSE likely to see strong buying.
🟩 Oil & Gas (Upstream)Positive (short-term): Higher crude prices benefit producers. ONGC, Oil India gain from better realizations.
🟥Oil Marketing Companies (OMCs) / Refiners Negative: Sharp rise in input costs squeezes margins. Reliance, BPCL, HPCL, IOCL under pressure.
🟥 Aviation & Logistics Strongly Negative: Higher ATF prices + disrupted Middle East routes. IndiGo, SpiceJet, shipping & logistics stocks hit hard.
🟥 Auto & Auto Ancillaries Negative: Rising fuel & raw material costs + inflation fears hurt demand and margins. Maruti, M&M, Tata Motors vulnerable.
🟥 Paints, Tyres & Chemicals Negative: Crude-derived raw material costs surge. Asian Paints, Berger, MRF, Apollo Tyres face margin squeeze.
🟨 Banking & Financials Negative (short-term): Risk-off sentiment triggers FII outflows, higher bond yields, rupee pressure. HDFC Bank, ICICI Bank, SBI may see selling.
🟨 IT Services Mixed / Relatively Resilient: Defensive flows + stronger USD help. TCS, Infosys, HCL Tech may hold better than broader market.
FMCG & Consumer DurablesNegativeHigher logistics & packaging costs compress margins. HUL, ITC, Nestlé under pressure.
🟨 Metals (Base)Volatile / Mixed: China demand fears vs higher commodity volatility. Tata Steel, Hindalco cautious.
🟢 Gold, Silver & Safe-Haven Assets Strongly Positive: Safe-haven buying pushes prices higher. Gold ETFs and related stocks benefit.
🔵🟣 Broader Market Outlook
Immediate Reaction: Gap-down opening expected on Monday. Nifty may test 🔔COMBO Zone 24769("RLS#1in WEEKLY" – 24,759🔺 ("USTgt in DAILY") support quickly if selling intensifies.
BUYERS Came into Field above mentioned Combo Zone.
Long Entry can be Initiated Near that Zone.
Longer-Term Risks: Sustained high crude → higher inflation, delayed rate cuts, fiscal strain, and rupee weakness.
🟢 Opportunities: Defense and upstream oil stocks are the clearest near-term beneficiaries. Gold-related plays also attractive.
⚫This is a fast-evolving situation. The extent and duration of the conflict will decide the depth and longevity of the impact.
Monitor 🔔crude prices and any 🔔de-escalation news closely.
⚪For specific stock ideas or further sector details, let me know!
━━━🟡🟢🔵 PCR Data Analysis => in Daily Level Post🔵🟢🟡━━━
━━━🟡🟢🔵Some Technical Parameter => in Daily Level Post🔵🟢🟡━━━
━━━🟡🟢🔵 MA (Moving Average) Analysis => in Daily Level Post 🔵🟢🟡━━━
━━━━━🟥🟧🟨🟩🟦🟪⬛━━━━━
💥Level Interpretation / description:
L#1: If the candle crossed & stays above the “Buy Gen”, it is treated / considered as Bullish bias.
L#2: Possibility / Probability of REVERSAL near RLB#1 & UBTgt
L#3: If the candle stays above “Sell Gen” but below “Buy Gen”, it is treated / considered as Sidewise. Aggressive Traders can take Long position near “Sell Gen” either retesting or crossed from Below & vice-versa i.e. can take Short position near “Buy Gen” either retesting or crossed downward from Above.
L#4: If the candle crossed & stays below the “Sell Gen”, it is treated / considered a Bearish bias.
L#5: Possibility / Probability of REVERSAL near RLS#1 & USTgt
HZB (Buy side) & HZS (Sell side) => Hurdle Zone,
*** Specialty of “HZB#1, HZB#2 HZS#1 & HZS#2” is Sidewise (behaviour in Nature)
Rest Plotted and Mentioned on Chart
Color code Used:
Green =. Positive bias.
Red =. Negative bias.
RED in Between Green means Trend Finder / Momentum Change
/ CYCLE Change and Vice Versa.
Notice One thing: HOW LEVELS are Working.
Use any Momentum Indicator / Oscillator or as you "USED to" to Take entry.
━━━━━🟥🟧🟨🟩🟦🟪⬛━━━━━
⚠️ DISCLAIMER:
The information, views, and ideas shared here are purely for educational and informational purposes only. They are not intended as investment advice or a recommendation to buy, sell, or hold any financial instruments. I am not a SEBI-registered financial adviser.
Trading and investing in the stock market involves risk, and you should do your own research and analysis. You are solely responsible for any decisions made based on this research.
"🔔As HARD EARNED MONEY IS YOUR's, So DECISION SHOULD HAVE TO BE YOUR's".
━━━━━🟥🟧🟨🟩🟦🟪⬛━━━━━
❇️ Follow notification about periodical View
💥 Do Comment for Stock WEEKLY Level Analysis.🚀
📊 Do you agree with this view?
✈️ HIT THE PLANE ICON if this technical observation resonates with you. It will Motivate me.
━━━━━🟥🟧🟨🟩🟦🟪⬛━━━━━
💡 If You LOOKING any CHART & want for Level and ANALYZE?
Share your desired stock names in the comments below! I will try to analyze the chart Levels, patterns and share my technical view (so far my Knowledge).
If Viewers think It can identify meaningful setups. Looking forward to hearing from all of you — let's keep this discussion going and help each other make better trading decisions.
___________🔕^^^⚫⚪^^^⚪⚫^^^🔔___________ nifty analysisCurrent price: ~24,737
Resistance / Targets
TP1: 24,847
TP2: 24,974
TP3: 25,046
Liquidity / downside sweep area
24,334 zone
Expected Path (based on your drawing)
Short-term liquidity sweep down
Price may drop toward 24,480 → 24,350 zone.
This looks like a sell-side liquidity grab.
Reversal after sweep
After taking liquidity near 24,334, buyers step in.
Bullish continuation
Move back above 24,650–24,700.
Then targets:
TP1: 24,847
TP2: 24,974
TP3: 25,046
Market Logic
Strong impulsive bullish candle before the close.
Likely retracement to rebalance imbalance (FVG / liquidity).
After that, continuation toward higher liquidity above highs.
✔ Bias: Bullish after liquidity sweep.  Long
Long
NIFTY Scalping / Short Range Level Analysis for 06th MAR 2026+NIFTY Scalping / Short Range Level Analysis for 06th MAR 2026
Amid USA+Israel Vs. IRAN War.
━━━🟡🟢🔵 PCR Data Analysis🔵🟢🟡━━━
⚪ 2nd Weekly EXP. PCR Analysis:
10th Mar 2026 EXP. Weekly Basis =>
Put OI: 16,13,102, Call OI: 17,47,475, PCR: 0.92 Trend Strength: 🟠Neutral.
Intraday Change in Weekly Basis Data =>
Put OI Change: 4,63,994, Call OI Change: 2,88,255, Change OI PCR: 1.61 Trend Strength: 🟢Bullish
🟣 MAR EXP. Monthly PCR Analysis:
Put OI: 9,13,136, Call OI: 7,79,089, PCR: 1.17. Trend Strength: 🟠Neutral.
Intraday Change in Monthly Basis Data =>
Put OI Change: Call OI Change: 2,42,815' Change OI PCR: 1.12 Trend Strength: 🟠Neutral.
━━━🟡🟢🔵Some Technical Parameter:🔵🟢🟡━━━
🛑 VWap vs Price: Price Below.
🟠 RSI(14): 37.55
🟠 Stoch Bias(14): 29.15, 19.58 (UP but OverSOLD)
🛑 MACD Bias (12,26): -108.49, -200.95, -92.46 (Bearish)
🟡 Williams %R: -70.85 (Perfect Reversal Point Near -80)
🟠 ROC: -4.03
Time Frame basis Trend:
🟢Bullish: 5 Min, 15 Min, 30 Min, Monthly
🛑Bearish:. 1 Min, 1 Hour, 2 Hour, 4 Hour, Daily, Weekly.
━━━🟡🟢🔵 MA (Moving Average) Analysis 🔵🟢🟡━━━
All major Averages are Above Index Value.
⚫ Period ⚪SMA ⚪EMA
🟥 MA 9 - 25219.86 - 25103.73
🟥 MA 20 - 25501.58 - 25335.28
🟥 MA 50 - 25617.61 - 25526.76
🟥 MA 100 - 25736.92 - 25524.68
🟥 MA 200 - 25344.14 - 25231.88
👇🏼Screenshot of NIFTY Spot All-day(05th MAR 2026) in 5 min TF with periodical update.
Posted View in "MIND" as well as "Update / Add Note" section Near Bottom.
Also viewed Max level & "VIB Time" in advance.
Impact: +289 points & also "VIB Time importance"
━━━━━🟥🟧🟨🟩🟦🟪⬛━━━━━
💥Level Interpretation / description:
L#1: If the candle crossed & stays above the “Buy Gen”, it is treated / considered as Bullish bias.
L#2: Possibility / Probability of REVERSAL near RLB#1 & UBTgt
L#3: If the candle stays above “Sell Gen” but below “Buy Gen”, it is treated / considered as Sidewise. Aggressive Traders can take Long position near “Sell Gen” either retesting or crossed from Below & vice-versa i.e. can take Short position near “Buy Gen” either retesting or crossed downward from Above.
L#4: If the candle crossed & stays below the “Sell Gen”, it is treated / considered a Bearish bias.
L#5: Possibility / Probability of REVERSAL near RLS#1 & USTgt
HZB (Buy side) & HZS (Sell side) => Hurdle Zone,
*** Specialty of “HZB#1, HZB#2 HZS#1 & HZS#2” is Sidewise (behaviour in Nature)
Rest Plotted and Mentioned on Chart
Color code Used:
Green =. Positive bias.
Red =. Negative bias.
RED in Between Green means Trend Finder / Momentum Change
/ CYCLE Change and Vice Versa.
Notice One thing: HOW LEVELS are Working.
Use any Momentum Indicator / Oscillator or as you "USED to" to Take entry.
━━━━━🟥🟧🟨🟩🟦🟪⬛━━━━━
⚠️ DISCLAIMER:
The information, views, and ideas shared here are purely for educational and informational purposes only. They are not intended as investment advice or a recommendation to buy, sell, or hold any financial instruments. I am not a SEBI-registered financial adviser.
Trading and investing in the stock market involves risk, and you should do your own research and analysis. You are solely responsible for any decisions made based on this research.
"🔔As HARD EARNED MONEY IS YOUR's, So DECISION SHOULD HAVE TO BE YOUR's".
━━━━━🟥🟧🟨🟩🟦🟪⬛━━━━━
❇️ Follow notification about periodical View
💥 Do Comment for Stock WEEKLY Level Analysis.🚀
📊 Do you agree with this view?
✈️ HIT THE PLANE ICON if this technical observation resonates with you. It will Motivate me.
━━━━━🟥🟧🟨🟩🟦🟪⬛━━━━━
💡 If You LOOKING any CHART & want for Level and ANALYZE?
Share your desired stock names in the comments below! I will try to analyze the chart Levels, patterns and share my technical view (so far my Knowledge).
If Viewers think It can identify meaningful setups. Looking forward to hearing from all of you — let's keep this discussion going and help each other make better trading decisions.
___________🔕^^^⚫⚪^^^⚪⚫^^^🔔___________
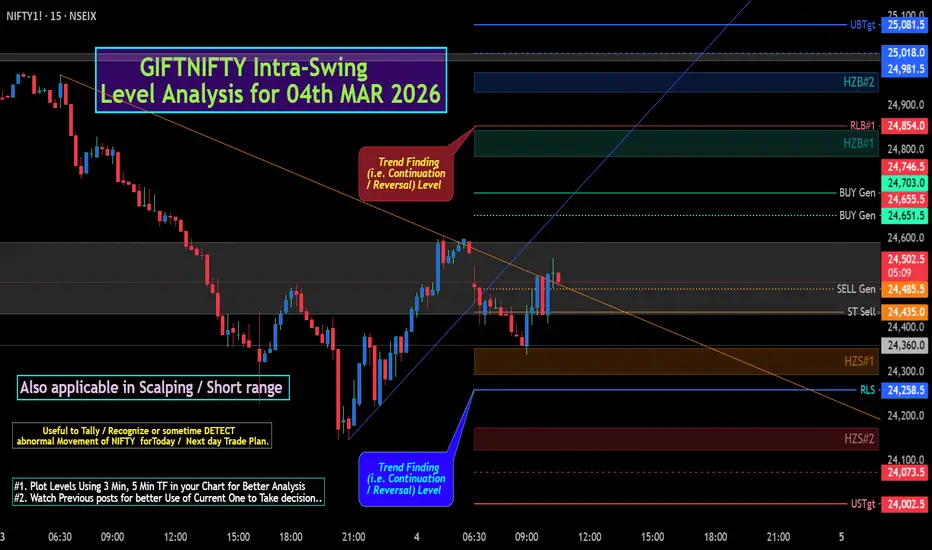
GIFTNIFTY Intra-Swing Level Analysis for 06th MAR 2026GIFTNIFTY Intra-Swing Level Analysis for 06th MAR 2026
━━━🟡🟢🔵 PCR Data Analysis🔵🟢🟡━━━
⚪ 2nd Weekly EXP. PCR Analysis:
10th Mar 2026 EXP. Weekly Basis =>
Put OI: 23,89,632, Call OI: 25,18,234, PCR: 0.95. Trend Strength: 🟠Neutral.
Intraday Change in Weekly Basis Data =>
Put OI Change: 7,76,530, Call OI Change: 7,70,759, Change OI PCR: 1.01 Trend Strength: 🟢Bullish
━━━━━🟥🟧🟨🟩🟦🟪⬛━━━━━
💥Level Interpretation / description:
L#1: If the candle crossed & stays above the “Buy Gen”, it is treated / considered as Bullish bias.
L#2: Possibility / Probability of REVERSAL near RLB#1 & UBTgt
L#3: If the candle stays above “Sell Gen” but below “Buy Gen”, it is treated / considered as Sidewise. Aggressive Traders can take Long position near “Sell Gen” either retesting or crossed from Below & vice-versa i.e. can take Short position near “Buy Gen” either retesting or crossed downward from Above.
L#4: If the candle crossed & stays below the “Sell Gen”, it is treated / considered a Bearish bias.
L#5: Possibility / Probability of REVERSAL near RLS#1 & USTgt
HZB (Buy side) & HZS (Sell side) => Hurdle Zone,
*** Specialty of “HZB#1, HZB#2 HZS#1 & HZS#2” is Sidewise (behaviour in Nature)
Rest Plotted and Mentioned on Chart
Color code Used:
Green =. Positive bias.
Red =. Negative bias.
RED in Between Green means Trend Finder / Momentum Change
/ CYCLE Change and Vice Versa.
Notice One thing: HOW LEVELS are Working.
Use any Momentum Indicator / Oscillator or as you "USED to" to Take entry.
━━━━━🟥🟧🟨🟩🟦🟪⬛━━━━━
⚠️ DISCLAIMER:
The information, views, and ideas shared here are purely for educational and informational purposes only. They are not intended as investment advice or a recommendation to buy, sell, or hold any financial instruments. I am not a SEBI-registered financial adviser.
Trading and investing in the stock market involves risk, and you should do your own research and analysis. You are solely responsible for any decisions made based on this research.
"🔔As HARD EARNED MONEY IS YOUR's, So DECISION SHOULD HAVE TO BE YOUR's".
━━━━━🟥🟧🟨🟩🟦🟪⬛━━━━━
❇️ Follow notification about periodical View
💥 Do Comment for Stock WEEKLY Level Analysis.🚀
📊 Do you agree with this view?
✈️ HIT THE PLANE ICON if this technical observation resonates with you. It will Motivate me.
━━━━━🟥🟧🟨🟩🟦🟪⬛━━━━━
💡 If You LOOKING any CHART & want for Level and ANALYZE?
Share your desired stock names in the comments below! I will try to analyze the chart Levels, patterns and share my technical view (so far my Knowledge).
If Viewers think It can identify meaningful setups. Looking forward to hearing from all of you — let's keep this discussion going and help each other make better trading decisions.
___________🔕^^^⚫⚪^^^⚪⚫^^^🔔___________  Long
Long
XAUUSD (2H) — Kelly’s Gold Map 03/05Compression under the range… next move will be decided at the trendline + liquidity pocket
Gold is stabilizing after the sharp drop, but the structure is not “clean bullish” yet. Price is holding in a tight band around the mid-5100s while the market compresses below a medium-term range. This is the kind of environment where gold often pauses, builds liquidity, then breaks with intent.
Right now, there are two things that matter most:
a retest into the range ceiling for acceptance, or a failure that sends price back into the lower liquidity pools.
Where price is reacting
Medium-term range (overhead cap)
The market is repeatedly reacting around the 5,200 area. This zone is acting like a ceiling: if price can’t accept above it, rallies into this band often become selling opportunities.
Trendline + “liquidity sell test” pocket (decision point)
There’s a small liquidity pocket just above current price (the area marked as a sell-test). This is where the market can spike, trigger late longs, then decide whether to continue higher or rotate lower.
Key reference above
The next obvious upside magnet sits near 5,318. A clean acceptance above the range makes this level a realistic first destination.
Downside map (where liquidity sits below)
If the market fails to accept higher, the chart shows stacked liquidity zones underneath:
A psychological zone around 5,000 (first meaningful downside objective)
A deeper reaction area near 4,800 (high attention zone when Fibonacci aligns with inefficiencies)
The larger downside objective near 4,650 (extended target if momentum stays heavy)
Gold tends to travel from one pocket to the next when it starts a real rotation.
Two scenarios to trade the next move
Rejection scenario (range holds, pullback resumes)
If price pushes into the 5,200 range band and fails to hold (wick rejection / close back below), the market is likely rotating back down into liquidity.
Focus becomes 5,000 → 4,800 → 4,650 depending on momentum and how price reacts at each pocket.
Invalidation for this bearish idea is simple: a clean break above the range and holding above it (no immediate dump back under the band).
Acceptance scenario (range breaks, upside continuation)
If price breaks above the 5,200 band and holds on a retest, the market shifts into continuation mode.
In that case, 5,318 becomes the first upside magnet, and the next leg can extend higher if price stays accepted above the range.
Invalidation here would be a breakout that immediately fails, with price closing back under the range and losing the retest.
Kelly’s takeaway
This is a “decision zone” market. The clean trades usually come after gold shows its hand at the trendline + medium-term range.
Let the market retest the ceiling, then follow what price confirms: acceptance opens the door toward 5,318, while rejection keeps the downside liquidity map in play toward 5,000 / 4,800 / 4,650. Short 
is nifty bullish nowWhat This Structure Suggests
1️⃣ Price is inside the Golden Zone
0.5 – 0.618 (24,457 – 24,492)
This is the most common retracement area before continuation.
2️⃣ Liquidity below
Your red level 24,199 looks like sell-side liquidity.
3️⃣ Two possible paths
Scenario A (more common):
Small bounce →
Liquidity sweep to 24,200 area →
Strong reversal →
Move toward 24,800+
Scenario B (direct continuation):
Hold above 24,450
Break 24,600
Target 24,800 – 25,000
Key Confirmation
Bullish continuation only if price breaks and holds above 24,605.
Invalidation
If daily closes below 24,199, then next downside liquidity could be:
23,900
23,600
Clean Trade Logic
Best buy area: 24,200 – 24,300
SL: below 24,000
Targets: 24,800 → 25,200 Long 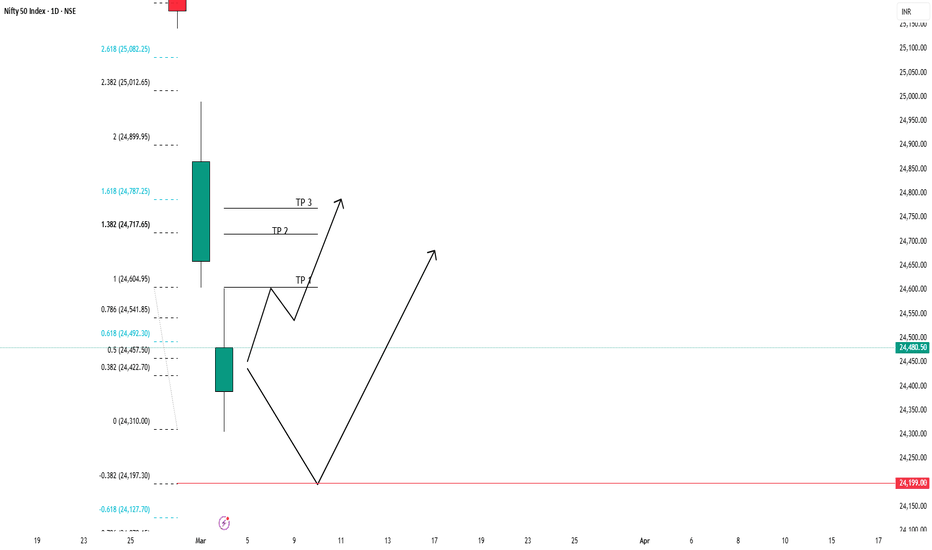
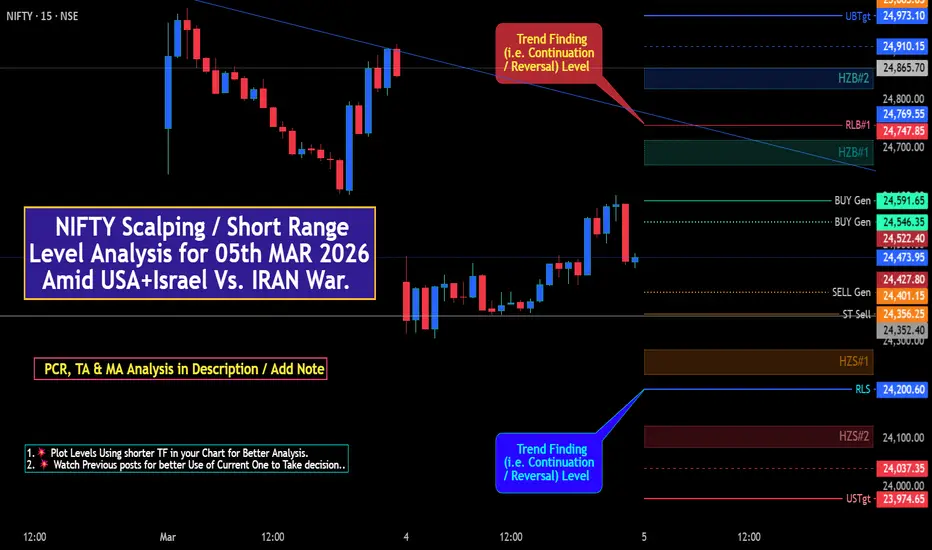
NIFTY Scalping / Short Range Level Analysis for 05th MAR 2026+NIFTY Scalping / Short Range Level Analysis for 05th MAR 2026
Amid USA+Israel Vs. IRAN War, Watch Closing of ^🔔DJI, 🔔UK30, 🔔CAC, 🔔DAX & Morning movement of 🔔Dow Future & 🔔GIFTNIFTY including 🔔Asian Market
━━━🟡🟢🔵 PCR Data Analysis🔵🟢🟡━━━
⚪ 2nd Weekly EXP. PCR Analysis:
10th Mar 2026 EXP. Weekly Basis =>
Put OI: 11,49,248, Call OI: 14,59,250, PCR: 0.79. Trend Strength: 🛑Bearish.
Intraday Change in Weekly Basis Data =>
Put OI Change: 3,98,330, Call OI Change: 4,41,857, Change OI PCR: 0.90.
Trend Strength: 🟠Neutral (Bearish to Neutral Compare to Prev. day)
🟣 MAR EXP. Monthly PCR Analysis:
Put OI: 9,26,317, Call OI: 7,76,946, PCR: 1.19. (Unchanged compare to Prev. day)
Trend Strength: 🟢Bullish.
Intraday Change in Monthly Basis Data =>
Put OI Change: 2,00,544, Call OI Change: -2,25,830, Change OI PCR: -0.89 Trend Strength: 🟠Neutral.
🔔 Notice one thing Monthly Massive -VE Call OI Change=> Call Unwinding.
━━━🟡🟢🔵Some Technical Parameter:🔵🟢🟡━━━
🛑 VWap vs Price: Price Below.
🛑 RSI(14): 30.37 (On OverSOLD Level)
🛑 Stoch Bias(14): 10.93, 11.30 (DN but OverSOLD)
🛑 MACD Bias (12,26): -107.87, -173.24, -65.34 (Bearish)
🟡 Williams %R: -89.07 (Perfect Reversal Point Near -80)
🟠 ROC: -5.68
Time Frame basis Trend:
🟢Bullish: Monthly.
🛑Bearish:. 1 Min, 5 Min, 15 Min,, 30 Min, 1 Hour, 2 Hour, 4 Hour, Daily, Weekly.
━━━🟡🟢🔵 MA (Moving Average) Analysis 🔵🟢🟡━━━
All major Moving Averages are Above Index Value.
⚫ Period ⚪SMA ⚪EMA
🟥 MA 9 - 25296.35 - 25188.19
🟥 MA 20 - 25552.09 - 25395.22
🟥 MA 50 - 25645.74 - 25557.81
🟥 MA 100 - 25741.08 - 25540.01
🟥 MA 200 - 25345.03 - 25236.57
👇🏼Screenshot of NIFTY Spot All-day(04th MAR 2026) in 5 min TF with periodical update.
Intraday Movement & periodical View. Posted in "MIND" section.
Made High above @ 25600, But not Closed > 24589
UP move of 212+ points from mentioned level posted at 12.53 pm.
🚀Follow GIFTNIFTY Post for NF levels
━━━━━🟥🟧🟨🟩🟦🟪⬛━━━━━
💥Level Interpretation / description:
L#1: If the candle crossed & stays above the “Buy Gen”, it is treated / considered as Bullish bias.
L#2: Possibility / Probability of REVERSAL near RLB#1 & UBTgt
L#3: If the candle stays above “Sell Gen” but below “Buy Gen”, it is treated / considered as Sidewise. Aggressive Traders can take Long position near “Sell Gen” either retesting or crossed from Below & vice-versa i.e. can take Short position near “Buy Gen” either retesting or crossed downward from Above.
L#4: If the candle crossed & stays below the “Sell Gen”, it is treated / considered a Bearish bias.
L#5: Possibility / Probability of REVERSAL near RLS#1 & USTgt
HZB (Buy side) & HZS (Sell side) => Hurdle Zone,
*** Specialty of “HZB#1, HZB#2 HZS#1 & HZS#2” is Sidewise (behaviour in Nature)
Rest Plotted and Mentioned on Chart
Color code Used:
Green =. Positive bias.
Red =. Negative bias.
RED in Between Green means Trend Finder / Momentum Change
/ CYCLE Change and Vice Versa.
Notice One thing: HOW LEVELS are Working.
Use any Momentum Indicator / Oscillator or as you "USED to" to Take entry.
━━━━━🟥🟧🟨🟩🟦🟪⬛━━━━━
⚠️ DISCLAIMER:
The information, views, and ideas shared here are purely for educational and informational purposes only. They are not intended as investment advice or a recommendation to buy, sell, or hold any financial instruments. I am not a SEBI-registered financial adviser.
Trading and investing in the stock market involves risk, and you should do your own research and analysis. You are solely responsible for any decisions made based on this research.
"🔔As HARD EARNED MONEY IS YOUR's, So DECISION SHOULD HAVE TO BE YOUR's".
━━━━━🟥🟧🟨🟩🟦🟪⬛━━━━━
❇️ Follow notification about periodical View
💥 Do Comment for Stock WEEKLY Level Analysis.🚀
📊 Do you agree with this view?
✈️ HIT THE PLANE ICON if this technical observation resonates with you. It will Motivate me.
━━━━━🟥🟧🟨🟩🟦🟪⬛━━━━━
💡 If You LOOKING any CHART & want for Level and ANALYZE?
Share your desired stock names in the comments below! I will try to analyze the chart Levels, patterns and share my technical view (so far my Knowledge).
If Viewers think It can identify meaningful setups. Looking forward to hearing from all of you — let's keep this discussion going and help each other make better trading decisions.
___________🔕^^^⚫⚪^^^⚪⚫^^^🔔___________ GIFTNIFTY Intra-Swing Level Analysis for 05th MAR 2026GIFTNIFTY Intra-Swing Level Analysis for 05th MAR 2026
━━━🟡🟢🔵 PCR Data Analysis🔵🟢🟡━━━
⚪ 2nd Weekly EXP. PCR Analysis:
10th Mar 2026 EXP. Weekly Basis =>
Put OI: 15,27,970, Call OI: 18,61,906, PCR: 0.82. Trend Strength: 🟠Neutral.
Intraday Change in Weekly Basis Data =>
Put OI Changr:3,94,554,Call OI Change: 3,89,392, Change OI PCR: 1.01 Trend Strength: 🟠Neutral
━━━━━🟥🟧🟨🟩🟦🟪⬛━━━━━
💥Level Interpretation / description:
L#1: If the candle crossed & stays above the “Buy Gen”, it is treated / considered as Bullish bias.
L#2: Possibility / Probability of REVERSAL near RLB#1 & UBTgt
L#3: If the candle stays above “Sell Gen” but below “Buy Gen”, it is treated / considered as Sidewise. Aggressive Traders can take Long position near “Sell Gen” either retesting or crossed from Below & vice-versa i.e. can take Short position near “Buy Gen” either retesting or crossed downward from Above.
L#4: If the candle crossed & stays below the “Sell Gen”, it is treated / considered a Bearish bias.
L#5: Possibility / Probability of REVERSAL near RLS#1 & USTgt
HZB (Buy side) & HZS (Sell side) => Hurdle Zone,
*** Specialty of “HZB#1, HZB#2 HZS#1 & HZS#2” is Sidewise (behaviour in Nature)
Rest Plotted and Mentioned on Chart
Color code Used:
Green =. Positive bias.
Red =. Negative bias.
RED in Between Green means Trend Finder / Momentum Change
/ CYCLE Change and Vice Versa.
Notice One thing: HOW LEVELS are Working.
Use any Momentum Indicator / Oscillator or as you "USED to" to Take entry.
━━━━━🟥🟧🟨🟩🟦🟪⬛━━━━━
⚠️ DISCLAIMER:
The information, views, and ideas shared here are purely for educational and informational purposes only. They are not intended as investment advice or a recommendation to buy, sell, or hold any financial instruments. I am not a SEBI-registered financial adviser.
Trading and investing in the stock market involves risk, and you should do your own research and analysis. You are solely responsible for any decisions made based on this research.
"🔔As HARD EARNED MONEY IS YOUR's, So DECISION SHOULD HAVE TO BE YOUR's".
━━━━━🟥🟧🟨🟩🟦🟪⬛━━━━━
❇️ Follow notification about periodical View
💥 Do Comment for Stock WEEKLY Level Analysis.🚀
📊 Do you agree with this view?
✈️ HIT THE PLANE ICON if this technical observation resonates with you. It will Motivate me.
━━━━━🟥🟧🟨🟩🟦🟪⬛━━━━━
💡 If You LOOKING any CHART & want for Level and ANALYZE?
Share your desired stock names in the comments below! I will try to analyze the chart Levels, patterns and share my technical view (so far my Knowledge).
If Viewers think It can identify meaningful setups. Looking forward to hearing from all of you — let's keep this discussion going and help each other make better trading decisions.
___________🔕^^^⚫⚪^^^⚪⚫^^^🔔___________
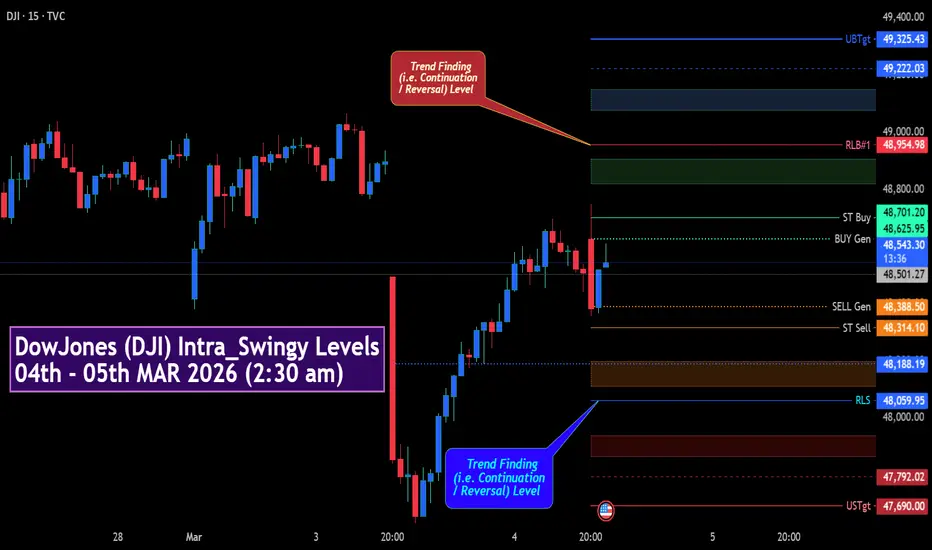
🔔🔕🟥🟧🟨🟩🟦🟪⬛🔴🟠🟡🟢🔵🟣⚫⚪🔺🔻 DowJones (DJI) Intra_Swing Levels04th - 05th MAR 2026 (2:30 am)DowJones (DJI) Intra_Swing Levels04th - 05th MAR 2026 (2:30 am)
━━━━━🟥🟧🟨🟩🟦🟪⬛━━━━━
💥Level Interpretation / description:
L#1: If the candle crossed & stays above the “Buy Gen”, it is treated / considered as Bullish bias.
L#2: Possibility / Probability of REVERSAL near RLB#1 & UBTgt
L#3: If the candle stays above “Sell Gen” but below “Buy Gen”, it is treated / considered as Sidewise. Aggressive Traders can take Long position near “Sell Gen” either retesting or crossed from Below & vice-versa i.e. can take Short position near “Buy Gen” either retesting or crossed downward from Above.
L#4: If the candle crossed & stays below the “Sell Gen”, it is treated / considered a Bearish bias.
L#5: Possibility / Probability of REVERSAL near RLS#1 & USTgt
HZB (Buy side) & HZS (Sell side) => Hurdle Zone,
*** Specialty of “HZB#1, HZB#2 HZS#1 & HZS#2” is Sidewise (behaviour in Nature)
Rest Plotted and Mentioned on Chart
Color code Used:
Green =. Positive bias.
Red =. Negative bias.
RED in Between Green means Trend Finder / Momentum Change
/ CYCLE Change and Vice Versa.
Notice One thing: HOW LEVELS are Working.
Use any Momentum Indicator / Oscillator or as you "USED to" to Take entry.
━━━━━🟥🟧🟨🟩🟦🟪⬛━━━━━
⚠️ DISCLAIMER:
The information, views, and ideas shared here are purely for educational and informational purposes only. They are not intended as investment advice or a recommendation to buy, sell, or hold any financial instruments. I am not a SEBI-registered financial adviser.
Trading and investing in the stock market involves risk, and you should do your own research and analysis. You are solely responsible for any decisions made based on this research.
"🔔As HARD EARNED MONEY IS YOUR's, So DECISION SHOULD HAVE TO BE YOUR's".
━━━━━🟥🟧🟨🟩🟦🟪⬛━━━━━
❇️ Follow notification about periodical View
💥 Do Comment for Stock WEEKLY Level Analysis.🚀
📊 Do you agree with this view?
✈️ HIT THE PLANE ICON if this technical observation resonates with you. It will Motivate me.
━━━━━🟥🟧🟨🟩🟦🟪⬛━━━━━
💡 If You LOOKING any CHART & want for Level and ANALYZE?
Share your desired stock names in the comments below! I will try to analyze the chart Levels, patterns and share my technical view (so far my Knowledge).
If Viewers think It can identify meaningful setups. Looking forward to hearing from all of you — let's keep this discussion going and help each other make better trading decisions.
___________🔕^^^⚫⚪^^^⚪⚫^^^🔔___________
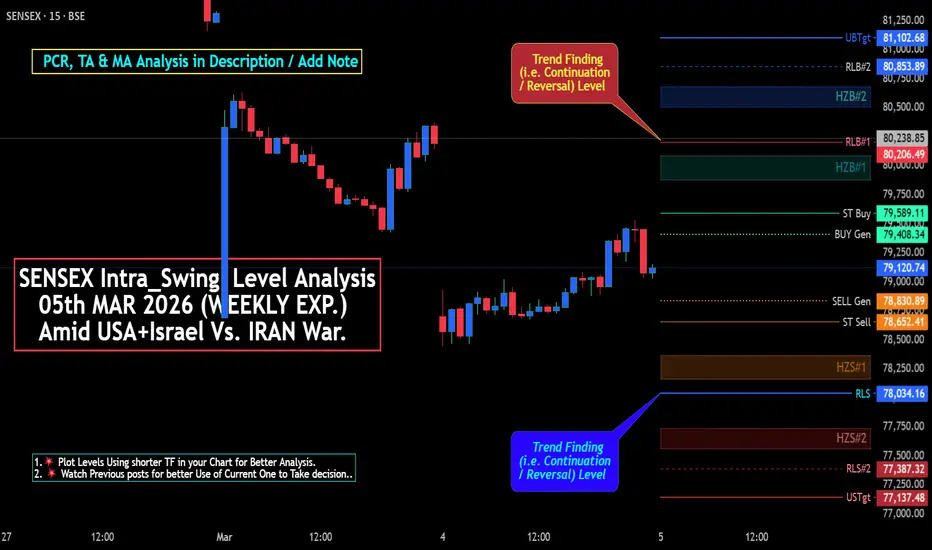
🔔🔕🟥🟧🟨🟩🟦🟪⬛🔴🟠🟡🟢🔵🟣⚫⚪🔺🔻 SENSEX WEEKLY EXP. Intra_Swing Level Analysis for 05th MAR 2026SENSEX Intra_Swing Level Analysis
05th MAR 2026 (WEEKLY EXP.)
Amid USA+Israel Vs. IRAN War.
Open Below WEEKLY USTg @ 78858. But in 2nd Half Crossed & Stay Above That.
━━━🟡🟢🔵 PCR Data Analysis🔵🟢🟡━━━
⚪ 1st Weekly EXP. PCR Analysis:
5th Mar 2026 EXP. Weekly Basis =>
Put OI: 18,25,848, Call OI: 14,89,148, PCR: 1.23. Trend Strength: 🟢 Bullish.
Intraday Change in Weekly Basis Data =>
Put OI Change: 8,90,537, Call OI Change: 4,90,827, Change OI PCR: 1.81 Trend Strength: 🟢 BULLISH
⚪ 2nd Weekly EXP. PCR Analysis:
12th Mar 2026 EXP. Weekly Basis =>
Put OI: 51,473, Call OI: 56,605: PCR: 0.91. Trend Strength: 🟡 Neutral.
Intraday Change in Weekly Basis Data =>
Put OI Change: 28,224, Call OI Change: 27,728, Change OI PCR: 1.02. Trend Strength: 🟡 Neutral
━━━🟡🟢🔵Some Technical Parameter:🔵🟢🟡━━━
🛑 VWap vs Price: Price Below.
🛑 RSI(14): 28.41 (OverSOLD)
🟠 Stoch Bias(14): 11.98, 14.78 (UP but OverSOLD)
🛑 MACD Bias (12,26): -372.99, -725.42, -352.43 (Bearish)
🟡 Williams %R: -88.02 (Perfect Reversal Point Near -80)
🟠 ROC: -6.08
Time Frame basis Trend:
🟢Bullish: 5 Min, 15 Min, Monthly
🛑Bearish:. 1 Min, 30 Min, 1 Hour, 2 Hour, 4 Hour, Daily, Weekly.
━━━🟡🟢🔵 MA (Moving Average) Analysis 🔵🟢🟡━━━
All major Averages are Above Index Value.
⚫ Period ⚪SMA ⚪EMA
🟥 MA 9 - 81777.82 - 81427.22
🟥 MA 20 - 82802.49 - 82246.16
🟥 MA 50 - 83343.25 - 83010.34
🟥 MA 100 - 83885.77 - 83151.25
🟥 MA 200 - 82792.64 - 82394.18
━━━━━🟥🟧🟨🟩🟦🟪⬛━━━━━
💥Level Interpretation / description:
L#1: If the candle crossed & stays above the “Buy Gen”, it is treated / considered as Bullish bias.
L#2: Possibility / Probability of REVERSAL near RLB#1 & UBTgt
L#3: If the candle stays above “Sell Gen” but below “Buy Gen”, it is treated / considered as Sidewise. Aggressive Traders can take Long position near “Sell Gen” either retesting or crossed from Below & vice-versa i.e. can take Short position near “Buy Gen” either retesting or crossed downward from Above.
L#4: If the candle crossed & stays below the “Sell Gen”, it is treated / considered a Bearish bias.
L#5: Possibility / Probability of REVERSAL near RLS#1 & USTgt
HZB (Buy side) & HZS (Sell side) => Hurdle Zone,
*** Specialty of “HZB#1, HZB#2 HZS#1 & HZS#2” is Sidewise (behaviour in Nature)
Rest Plotted and Mentioned on Chart
Color code Used:
Green =. Positive bias.
Red =. Negative bias.
RED in Between Green means Trend Finder / Momentum Change
/ CYCLE Change and Vice Versa.
Notice One thing: HOW LEVELS are Working.
Use any Momentum Indicator / Oscillator or as you "USED to" to Take entry.
━━━━━🟥🟧🟨🟩🟦🟪⬛━━━━━
⚠️ DISCLAIMER:
The information, views, and ideas shared here are purely for educational and informational purposes only. They are not intended as investment advice or a recommendation to buy, sell, or hold any financial instruments. I am not a SEBI-registered financial adviser.
Trading and investing in the stock market involves risk, and you should do your own research and analysis. You are solely responsible for any decisions made based on this research.
"🔔As HARD EARNED MONEY IS YOUR's, So DECISION SHOULD HAVE TO BE YOUR's".
━━━━━🟥🟧🟨🟩🟦🟪⬛━━━━━
❇️ Follow notification about periodical View
💥 Do Comment for Stock WEEKLY Level Analysis.🚀
📊 Do you agree with this view?
✈️ HIT THE PLANE ICON if this technical observation resonates with you. It will Motivate me.
━━━━━🟥🟧🟨🟩🟦🟪⬛━━━━━
💡 If You LOOKING any CHART & want for Level and ANALYZE?
Share your desired stock names in the comments below! I will try to analyze the chart Levels, patterns and share my technical view (so far my Knowledge).
If Viewers think It can identify meaningful setups. Looking forward to hearing from all of you — let's keep this discussion going and help each other make better trading decisions.
___________🔕^^^⚫⚪^^^⚪⚫^^^🔔___________ XAUUSD (2H) — Gold MapTrendline retest may offer a sell setup, with liquidity stacked below
Gold is moving into a “reset” phase after the latest expansion leg. Price is hovering around the 5180s, pressing into a medium-term range / supply band while a rising trendline sits just beneath current structure. This is a classic environment where gold often retests a clean line, attracts late buyers, then rotates lower into liquidity.
The core idea on this chart is straightforward:
a pullback into trendline + range resistance can become the trigger for the next bearish rotation.
Structure in plain words
The prior rally already delivered its impulse. Now price is pausing and compressing under resistance rather than continuing cleanly. When gold can’t extend immediately, it often follows a two-step sequence:
a retrace into a visible level (trendline / range top)
a rejection that drives price back down into stacked demand zones
That’s why the reaction at the retest matters more than the current candle.
Key area in focus
Medium-term range / supply zone
The overhead band around the 5200 area is acting as a cap. If the market wants to trap breakout buyers, this is the zone it tends to use.
Trendline retest zone
The rising trendline is the magnet. A clean touch followed by rejection (upper wick, bearish engulfing, or repeated failure to hold above the band) is often enough to start the next leg lower.
Downside liquidity map
Below current price, the chart highlights several clear “magnets” where liquidity can sit:
the psychological zone around 5000 (first meaningful rotation objective)
a deeper confluence zone around 4800 (a key reaction area when Fibonacci aligns with imbalance / FVG)
the larger lower objective around 4650 (extended target if momentum stays heavy)
Gold rarely moves randomly in these phases — it tends to migrate from one order pocket to the next.
What would invalidate the sell idea
If price breaks above the medium-term range and holds (a clean close above the band without an immediate reclaim back below), the retest-to-sell thesis loses edge. In that scenario, forcing shorts becomes low quality.
Takeaway
This is not a place to chase direction. The edge is in the retest.
Let price revisit the trendline and the range boundary, watch how it reacts, and then follow the direction that price confirms — because gold’s cleanest moves often begin right after it convinces the crowd to enter late. Short 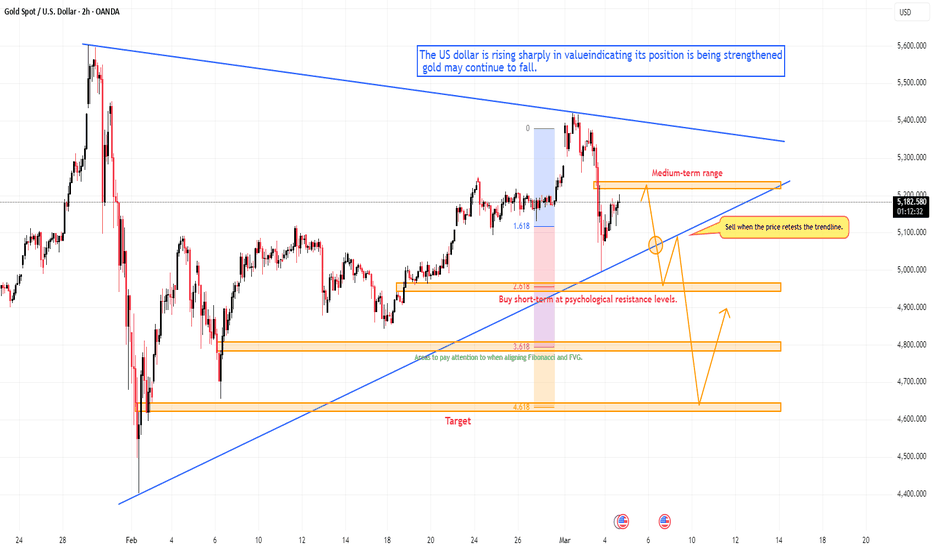
Long 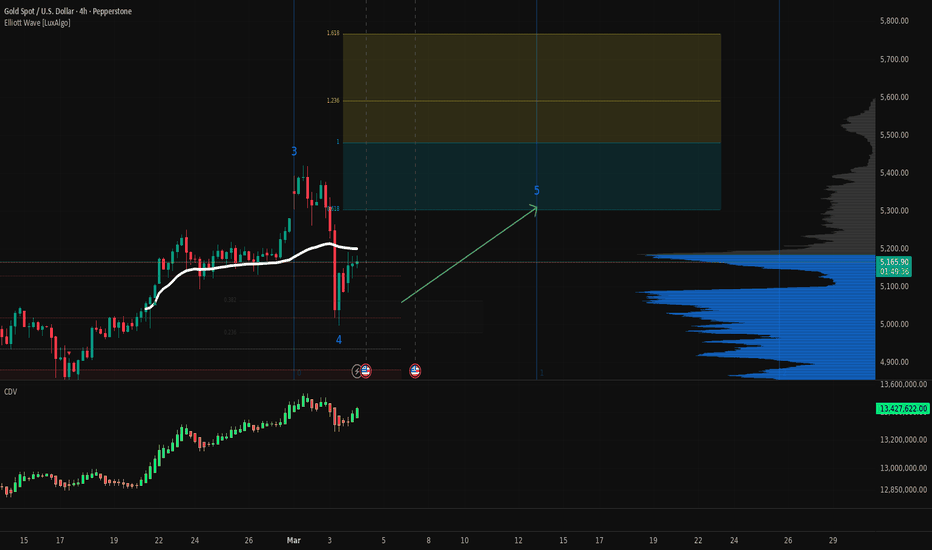
NIFTY Scalping / Short Range Level Analysis for 04th MAR 2026 Amid USA+Israel Vs. IRAN War.
NIFTY Scalping / Short Range Level Analysis for 04th MAR 2026
━━━🟡🟢🔵 PCR Data Analysis🔵🟢🟡━━━
⚪ 2nd Weekly EXP. PCR Analysis:
10th Mar 2026 EXP. Weekly Basis =>
Put OI: 7,50,918, Call OI: 10,17,393, PCR: 0.74. Trend Strength: 🛑Bearish.
Intraday Change in Weekly Basis Data =>
Put OI Change: 4,28,242, Call OI Change: 4,28,036, Change OI PCR: 1.00. Trend Strength: 🟠Neutral
🟣 MAR EXP. Monthly PCR Analysis:
Put OI: 8,64,149, Call OI: 7,23,799, PCR: 1.19. Trend Strength: 🟢Bullish.
Intraday Change in Monthly Basis Data =>
Put OI Change: 48,683, Call OI Change: -8,33,170, Change OI PCR: -0.06. Trend Strength: 🟠Neutral.
🔔 Notice one thing Monthly Massive -VE Call OI Change=> Call Unwinding.
━━━🟡🟢🔵Some Technical Parameter:🔵🟢🟡━━━
🟢VWap vs Price: Price ABOVE.
🟠 RSI(14): 35.48
🟠 Stoch Bias(14): 18.65, 15.91 (DN but Neutral)
🟢 MACD Bias (12,26): -67.86, - 106.23, -38.37 (Bullish)
🟡 Williams %R: -81.35 (Perfect Reversal Point Near -80)
🟠 ROC: -4.12
Time Frame basis Trend:
🟢Bullish: 5 Min, Monthly
🛑Bearish:. 1 Min, 15 Min, 30 Min, 1 Hour, 2 Hour, 4 Hour, Daily, Weekly.
━━━🟡🟢🔵 MA (Moving Average) Analysis 🔵🟢🟡━━━
All major Averages are Above Index Value.
⚫ Period ⚪SMA ⚪EMA
🟥 MA 9 - 25445.11 - 25365.11
🟥 MA 20 - 25614.44 - 25491.50
🟥 MA 50 - 25675.46 - 25601.78
🟥 MA 100 - 25746.73 - 25561.41
🟥 MA 200 - 25347.73 - 25244.17
👇🏼Screenshot of NIFTY Spot All-day(02nd MAR 2026) in 5 min TF with periodical update.
Intraday Movement & Periodical Update.
At closing Intraday Change OI Near day High at 1.00 fro day low at 0.66 (near 2.00 pm)
━━━━━🟥🟧🟨🟩🟦🟪⬛━━━━━
💥Level Interpretation / description:
L#1: If the candle crossed & stays above the “Buy Gen”, it is treated / considered as Bullish bias.
L#2: Possibility / Probability of REVERSAL near RLB#1 & UBTgt
L#3: If the candle stays above “Sell Gen” but below “Buy Gen”, it is treated / considered as Sidewise. Aggressive Traders can take Long position near “Sell Gen” either retesting or crossed from Below & vice-versa i.e. can take Short position near “Buy Gen” either retesting or crossed downward from Above.
L#4: If the candle crossed & stays below the “Sell Gen”, it is treated / considered a Bearish bias.
L#5: Possibility / Probability of REVERSAL near RLS#1 & USTgt
HZB (Buy side) & HZS (Sell side) => Hurdle Zone,
*** Specialty of “HZB#1, HZB#2 HZS#1 & HZS#2” is Sidewise (behaviour in Nature)
Rest Plotted and Mentioned on Chart
Color code Used:
Green =. Positive bias.
Red =. Negative bias.
RED in Between Green means Trend Finder / Momentum Change
/ CYCLE Change and Vice Versa.
Notice One thing: HOW LEVELS are Working.
Use any Momentum Indicator / Oscillator or as you "USED to" to Take entry.
━━━━━🟥🟧🟨🟩🟦🟪⬛━━━━━
⚠️ DISCLAIMER:
The information, views, and ideas shared here are purely for educational and informational purposes only. They are not intended as investment advice or a recommendation to buy, sell, or hold any financial instruments. I am not a SEBI-registered financial adviser.
Trading and investing in the stock market involves risk, and you should do your own research and analysis. You are solely responsible for any decisions made based on this research.
"🔔As HARD EARNED MONEY IS YOUR's, So DECISION SHOULD HAVE TO BE YOUR's".
━━━━━🟥🟧🟨🟩🟦🟪⬛━━━━━
❇️ Follow notification about periodical View
💥 Do Comment for Stock WEEKLY Level Analysis.🚀
📊 Do you agree with this view?
✈️ HIT THE PLANE ICON if this technical observation resonates with you. It will Motivate me.
━━━━━🟥🟧🟨🟩🟦🟪⬛━━━━━
💡 If You LOOKING any CHART & want for Level and ANALYZE?
Share your desired stock names in the comments below! I will try to analyze the chart Levels, patterns and share my technical view (so far my Knowledge).
If Viewers think It can identify meaningful setups. Looking forward to hearing from all of you — let's keep this discussion going and help each other make better trading decisions.
___________🔕^^^⚫⚪^^^⚪⚫^^^🔔___________ GIFTNIFTY Level Analysis for 04th MAR 2026+GIFTNIFTY Intra-Swing Level Analysis for 04th MAR 2026
━━━🔔🟢🔔🔵🔔 TRADE CAUSIOUSLY🔔🟢🔔🟡━━━
💥Level Interpretation / description:
L#1: If the candle crossed & stays above the “Buy Gen”, it is treated / considered as Bullish bias.
L#2: Possibility / Probability of REVERSAL near RLB#1 & UBTgt
L#3: If the candle stays above “Sell Gen” but below “Buy Gen”, it is treated / considered as Sidewise. Aggressive Traders can take Long position near “Sell Gen” either retesting or crossed from Below & vice-versa i.e. can take Short position near “Buy Gen” either retesting or crossed downward from Above.
L#4: If the candle crossed & stays below the “Sell Gen”, it is treated / considered a Bearish bias.
L#5: Possibility / Probability of REVERSAL near RLS#1 & USTgt
HZB (Buy side) & HZS (Sell side) => Hurdle Zone,
*** Specialty of “HZB#1, HZB#2 HZS#1 & HZS#2” is Sidewise (behaviour in Nature)
Rest Plotted and Mentioned on Chart
Color code Used:
Green =. Positive bias.
Red =. Negative bias.
RED in Between Green means Trend Finder / Momentum Change
/ CYCLE Change and Vice Versa.
Notice One thing: HOW LEVELS are Working.
Use any Momentum Indicator / Oscillator or as you "USED to" to Take entry.
━━━━━🟥🟧🟨🟩🟦🟪⬛━━━━━
⚠️ DISCLAIMER:
The information, views, and ideas shared here are purely for educational and informational purposes only. They are not intended as investment advice or a recommendation to buy, sell, or hold any financial instruments. I am not a SEBI-registered financial adviser.
Trading and investing in the stock market involves risk, and you should do your own research and analysis. You are solely responsible for any decisions made based on this research.
"🔔As HARD EARNED MONEY IS YOUR's, So DECISION SHOULD HAVE TO BE YOUR's".
━━━━━🟥🟧🟨🟩🟦🟪⬛━━━━━
❇️ Follow notification about periodical View
💥 Do Comment for Stock WEEKLY Level Analysis.🚀
📊 Do you agree with this view?
✈️ HIT THE PLANE ICON if this technical observation resonates with you. It will Motivate me.
━━━━━🟥🟧🟨🟩🟦🟪⬛━━━━━
💡 If You LOOKING any CHART & want for Level and ANALYZE?
Share your desired stock names in the comments below! I will try to analyze the chart Levels, patterns and share my technical view (so far my Knowledge).
If Viewers think It can identify meaningful setups. Looking forward to hearing from all of you — let's keep this discussion going and help each other make better trading decisions.
___________🔕^^^⚫⚪^^^⚪⚫^^^🔔___________ NIFTY 50 trend analysisBearish Case (Higher Probability if Weakness Continues)
Break 25,150
Retest from below
Move toward:
24,800
24,300 (major target)
This is a breakdown → retest → continuation setup.
Alternate Bullish Case
If 25,150 holds and market bounces:
First target: 26,300
Major resistance: 26,685
Only above 26,700 → trend turns bullish again.
Trading Logic (Pro View)
Below 25,150 → Sell on pullbacks.
Between 25,150 – 26,300 → Range / choppy.
Above 26,700 → Bullish structure.
Market Bias (Based on Structure)
Short-term bias: Bearish to Neutral
Because:
Lower high formation
Rejection near resistance
Weak momentum candles Short