Long
Long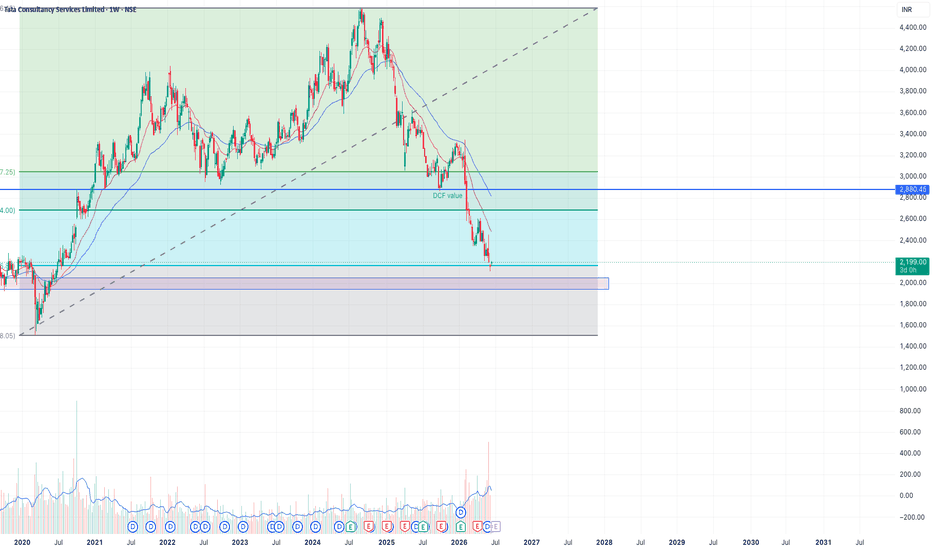
 Long
Long
BANKNIFTY DAILYY/ Short range Level Analysis: 16th Jun 2026🔕 SGMN SplD BULLISH Above => 57418.
🔕 SGMN SplD Bearish BELOW => 56996.
Mentioned analysis based on 2 consecutive candle close in 15 min Time Frame.
━━━━━🟥🟧🟨🟩🟦🟪⬛━━━━━
💥Level Interpretation / description:
✍🏻L#1: If the candle crossed & stays above the “Buy Gen”, it is treated / considered as Bullish bias. Cfm=> Confirmation.
L#2: Possibility / Probability of REVERSAL near 🔕RL/TF1 & 🔔RL/TF2
L#3: If the candle stays above “Sell Gen” but below “Buy Gen”, it is treated / considered as Sidewise. Aggressive Traders can take Long position near “Sell Gen” either retesting or crossed from Below & vice-versa i.e. can take Short position near “Buy Gen” either retesting or crossed downward from Above.
L#4: If the candle crossed & stays below the “Sell Gen”, it is treated / considered a Bearish bias.
L#5: Possibility / Probability of REVERSAL near 🔕RL/TF1 & 🔔RL/TF2
HZB (Buy side) & HZS (Sell side) => Hurdle Zone,
✍🏻 *** Specialty of “HZB#1, HZB#2 HZS#1 & HZS#2” is Sidewise (behaviour in Nature)
Rest Plotted and Mentioned on Chart
Color code Used:
Green, BLUE =. Positive bias.
Safron, RED =. Negative bias.
RED in Between Green means Trend Finder / Momentum Change
/ CYCLE Change and Vice Versa.
Notice One thing: HOW LEVELS are Working.
Use any Momentum Indicator / Oscillator or as you "USED to" to Take entry.
━━━━━🟥🟧🟨🟩🟦🟪⬛━━━━━
⚠️ DISCLAIMER:
The information, views, and ideas shared here are purely for educational and informational purposes only. They are not intended as investment advice or a recommendation to buy, sell, or hold any financial instruments. I am not a SEBI-registered financial adviser.
Trading and investing in the stock market involves risk, and you should do your own research and analysis. You are solely responsible for any decisions made based on this research.
"🔔As HARD EARNED MONEY IS YOUR's, So DECISION SHOULD HAVE TO BE YOUR's".
━━━━━🟥🟧🟨🟩🟦🟪⬛━━━━━
❇️ Follow notification about periodical View
💥 Do Comment for Stock WEEKLY Level Analysis.🚀
📊 Do you agree with this view?
✈️ HIT THE PLANE ICON if this technical observation resonates with you. It will Motivate me.
━━━━━🟥🟧🟨🟩🟦🟪⬛━━━━━
💡 If You LOOKING any CHART & want for Level and ANALYZE?
Share your desired stock names in the comments below! I will try to analyze the chart Levels, patterns and share my technical view (so far my Knowledge).
If Viewers think It can identify meaningful setups. Looking forward to hearing from all of you — let's keep this discussion going and help each other make better trading decisions.
___________🔕^^^⚫⚪^🙏🏼🙏🏼🙏🏼^⚪⚫^^^🔔___________ NIFTY DAILY / Short Range Level Analysis for 16th Jun 2026🔕 SGMN SplD BULLISH Above => 23927.
🔕 SGMN SplD Bearish BELOW => 23786.
Mentioned analysis based on 2 consecutive candle close in 15 min Time Frame.
━━━━━🟥🟧🟨🟩🟦🟪⬛━━━━━
💥Level Interpretation / description:
✍🏻L#1: If the candle crossed & stays above the “Buy Gen”, it is treated / considered as Bullish bias. Cfm=> Confirmation.
L#2: Possibility / Probability of REVERSAL near 🔕RL/TF1 & 🔔RL/TF2
L#3: If the candle stays above “Sell Gen” but below “Buy Gen”, it is treated / considered as Sidewise. Aggressive Traders can take Long position near “Sell Gen” either retesting or crossed from Below & vice-versa i.e. can take Short position near “Buy Gen” either retesting or crossed downward from Above.
L#4: If the candle crossed & stays below the “Sell Gen”, it is treated / considered a Bearish bias.
L#5: Possibility / Probability of REVERSAL near 🔕RL/TF1 & 🔔RL/TF2
HZB (Buy side) & HZS (Sell side) => Hurdle Zone,
✍🏻 *** Specialty of “HZB#1, HZB#2 HZS#1 & HZS#2” is Sidewise (behaviour in Nature)
Rest Plotted and Mentioned on Chart
Color code Used:
Green, BLUE =. Positive bias.
Safron, RED =. Negative bias.
RED in Between Green means Trend Finder / Momentum Change
/ CYCLE Change and Vice Versa.
Notice One thing: HOW LEVELS are Working.
Use any Momentum Indicator / Oscillator or as you "USED to" to Take entry.
━━━━━🟥🟧🟨🟩🟦🟪⬛━━━━━
⚠️ DISCLAIMER:
The information, views, and ideas shared here are purely for educational and informational purposes only. They are not intended as investment advice or a recommendation to buy, sell, or hold any financial instruments. I am not a SEBI-registered financial adviser.
Trading and investing in the stock market involves risk, and you should do your own research and analysis. You are solely responsible for any decisions made based on this research.
"🔔As HARD EARNED MONEY IS YOUR's, So DECISION SHOULD HAVE TO BE YOUR's".
━━━━━🟥🟧🟨🟩🟦🟪⬛━━━━━
❇️ Follow notification about periodical View
💥 Do Comment for Stock WEEKLY Level Analysis.🚀
📊 Do you agree with this view?
✈️ HIT THE PLANE ICON if this technical observation resonates with you. It will Motivate me.
━━━━━🟥🟧🟨🟩🟦🟪⬛━━━━━
💡 If You LOOKING any CHART & want for Level and ANALYZE?
Share your desired stock names in the comments below! I will try to analyze the chart Levels, patterns and share my technical view (so far my Knowledge).
If Viewers think It can identify meaningful setups. Looking forward to hearing from all of you — let's keep this discussion going and help each other make better trading decisions.
___________🔕^^^⚫⚪^🙏🏼🙏🏼🙏🏼^⚪⚫^^^🔔___________  Long
Long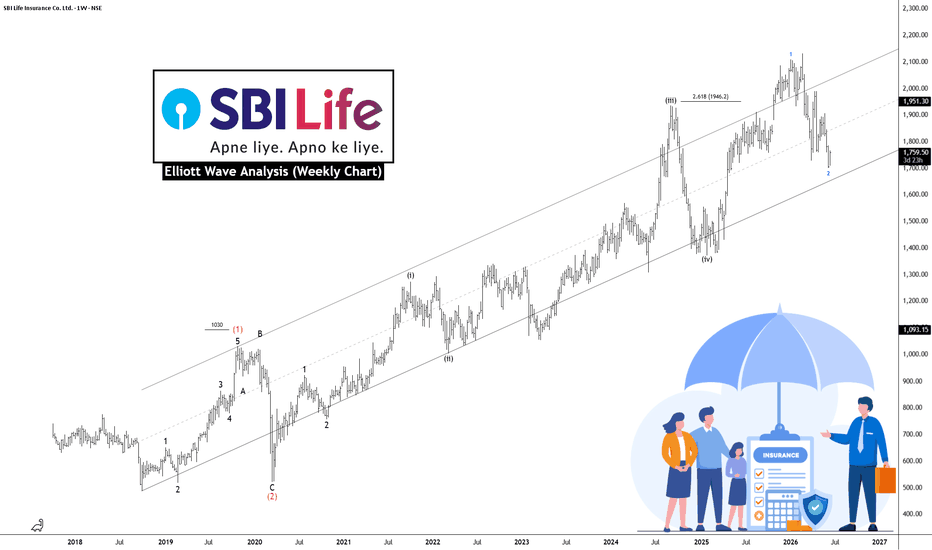
GIFTNIFTY DAILY / Short Range Level Analysis for 15th Jun 2026━━━━━🟥🟧🟨🟩🟦🟪⬛━━━━━
💥Level Interpretation / description:
✍🏻L#1: If the candle crossed & stays above the “Buy Gen”, it is treated / considered as Bullish bias. Cfm=> Confirmation.
L#2: Possibility / Probability of REVERSAL near 🔕RL/TF1 & 🔔RL/TF2
L#3: If the candle stays above “Sell Gen” but below “Buy Gen”, it is treated / considered as Sidewise. Aggressive Traders can take Long position near “Sell Gen” either retesting or crossed from Below & vice-versa i.e. can take Short position near “Buy Gen” either retesting or crossed downward from Above.
L#4: If the candle crossed & stays below the “Sell Gen”, it is treated / considered a Bearish bias.
L#5: Possibility / Probability of REVERSAL near 🔕RL/TF1 & 🔔RL/TF2
HZB (Buy side) & HZS (Sell side) => Hurdle Zone,
✍🏻 *** Specialty of “HZB#1, HZB#2 HZS#1 & HZS#2” is Sidewise (behaviour in Nature)
Rest Plotted and Mentioned on Chart
Color code Used:
Green, BLUE =. Positive bias.
Safron, RED =. Negative bias.
RED in Between Green means Trend Finder / Momentum Change
/ CYCLE Change and Vice Versa.
Notice One thing: HOW LEVELS are Working.
Use any Momentum Indicator / Oscillator or as you "USED to" to Take entry.
━━━━━🟥🟧🟨🟩🟦🟪⬛━━━━━
⚠️ DISCLAIMER:
The information, views, and ideas shared here are purely for educational and informational purposes only. They are not intended as investment advice or a recommendation to buy, sell, or hold any financial instruments. I am not a SEBI-registered financial adviser.
Trading and investing in the stock market involves risk, and you should do your own research and analysis. You are solely responsible for any decisions made based on this research.
"🔔As HARD EARNED MONEY IS YOUR's, So DECISION SHOULD HAVE TO BE YOUR's".
━━━━━🟥🟧🟨🟩🟦🟪⬛━━━━━
❇️ Follow notification about periodical View
💥 Do Comment for Stock WEEKLY Level Analysis.🚀
📊 Do you agree with this view?
✈️ HIT THE PLANE ICON if this technical observation resonates with you. It will Motivate me.
━━━━━🟥🟧🟨🟩🟦🟪⬛━━━━━
💡 If You LOOKING any CHART & want for Level and ANALYZE?
Share your desired stock names in the comments below! I will try to analyze the chart Levels, patterns and share my technical view (so far my Knowledge).
If Viewers think It can identify meaningful setups. Looking forward to hearing from all of you — let's keep this discussion going and help each other make better trading decisions.
___________🔕^^^⚫⚪^🙏🏼🙏🏼🙏🏼^⚪⚫^^^🔔___________ NIFTY MIDCAP SELECT DAILYY Level Analysis: 15th Jun 2026🔕 SGMN SplD BULLISH Above => 14296.
🔕 SGMN SplD Bearish BELOW => 14180.
Mentioned analysis based on 2 consecutive candle close in 15 min Time Frame.
━━━━━🟥🟧🟨🟩🟦🟪⬛━━━━━
💥Level Interpretation / description:
✍🏻L#1: If the candle crossed & stays above the “Buy Gen”, it is treated / considered as Bullish bias. Cfm=> Confirmation.
L#2: Possibility / Probability of REVERSAL near 🔕RL/TF1 & 🔔RL/TF2
L#3: If the candle stays above “Sell Gen” but below “Buy Gen”, it is treated / considered as Sidewise. Aggressive Traders can take Long position near “Sell Gen” either retesting or crossed from Below & vice-versa i.e. can take Short position near “Buy Gen” either retesting or crossed downward from Above.
L#4: If the candle crossed & stays below the “Sell Gen”, it is treated / considered a Bearish bias.
L#5: Possibility / Probability of REVERSAL near 🔕RL/TF1 & 🔔RL/TF2
HZB (Buy side) & HZS (Sell side) => Hurdle Zone,
✍🏻 *** Specialty of “HZB#1, HZB#2 HZS#1 & HZS#2” is Sidewise (behaviour in Nature)
Rest Plotted and Mentioned on Chart
Color code Used:
Green, BLUE =. Positive bias.
Safron, RED =. Negative bias.
RED in Between Green means Trend Finder / Momentum Change
/ CYCLE Change and Vice Versa.
Notice One thing: HOW LEVELS are Working.
Use any Momentum Indicator / Oscillator or as you "USED to" to Take entry.
━━━━━🟥🟧🟨🟩🟦🟪⬛━━━━━
⚠️ DISCLAIMER:
The information, views, and ideas shared here are purely for educational and informational purposes only. They are not intended as investment advice or a recommendation to buy, sell, or hold any financial instruments. I am not a SEBI-registered financial adviser.
Trading and investing in the stock market involves risk, and you should do your own research and analysis. You are solely responsible for any decisions made based on this research.
"🔔As HARD EARNED MONEY IS YOUR's, So DECISION SHOULD HAVE TO BE YOUR's".
━━━━━🟥🟧🟨🟩🟦🟪⬛━━━━━
❇️ Follow notification about periodical View
💥 Do Comment for Stock WEEKLY Level Analysis.🚀
📊 Do you agree with this view?
✈️ HIT THE PLANE ICON if this technical observation resonates with you. It will Motivate me.
━━━━━🟥🟧🟨🟩🟦🟪⬛━━━━━
💡 If You LOOKING any CHART & want for Level and ANALYZE?
Share your desired stock names in the comments below! I will try to analyze the chart Levels, patterns and share my technical view (so far my Knowledge).
If Viewers think It can identify meaningful setups. Looking forward to hearing from all of you — let's keep this discussion going and help each other make better trading decisions.
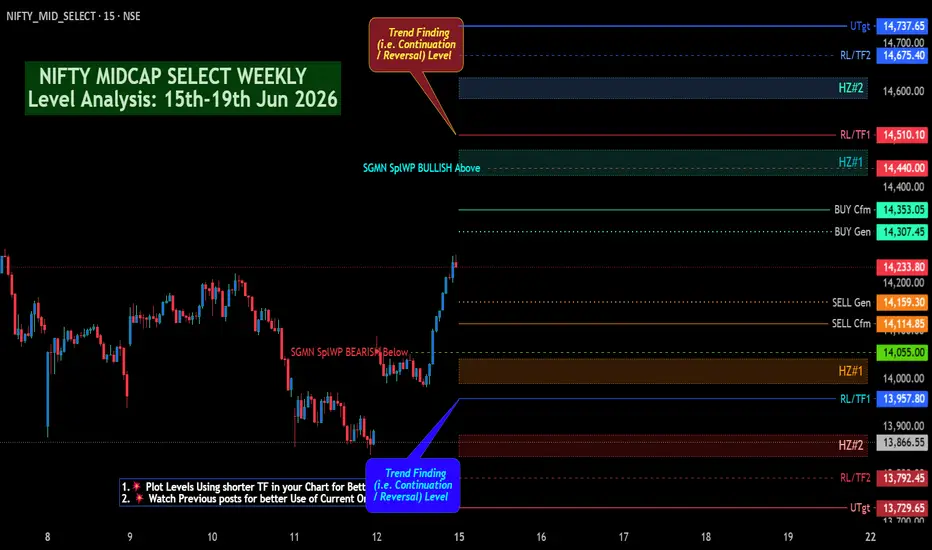
___________🔕^^^⚫⚪^🙏🏼🙏🏼🙏🏼^⚪⚫^^^🔔___________ NIFTY MIDCAP SELECT WEEKLY Level Analysis: 15th-19th Jun 2026🔔 SGMN SplWP Above BULLISH BIAS => 14440.
🔔 SGMN SplWP BELOW Bearish BIAS => 14055.
Mentioned analysis based on 2 consecutive candle close in 15 min Time Frame.
━━━━━🟥🟧🟨🟩🟦🟪⬛━━━━━
💥Level Interpretation / description:
✍🏻L#1: If the candle crossed & stays above the “Buy Gen”, it is treated / considered as Bullish bias. Cfm=> Confirmation.
L#2: Possibility / Probability of REVERSAL near 🔕RL/TF1 & 🔔RL/TF2
L#3: If the candle stays above “Sell Gen” but below “Buy Gen”, it is treated / considered as Sidewise. Aggressive Traders can take Long position near “Sell Gen” either retesting or crossed from Below & vice-versa i.e. can take Short position near “Buy Gen” either retesting or crossed downward from Above.
L#4: If the candle crossed & stays below the “Sell Gen”, it is treated / considered a Bearish bias.
L#5: Possibility / Probability of REVERSAL near 🔕RL/TF1 & 🔔RL/TF2
HZB (Buy side) & HZS (Sell side) => Hurdle Zone,
✍🏻 *** Specialty of “HZB#1, HZB#2 HZS#1 & HZS#2” is Sidewise (behaviour in Nature)
Rest Plotted and Mentioned on Chart
Color code Used:
Green, BLUE =. Positive bias.
Safron, RED =. Negative bias.
RED in Between Green means Trend Finder / Momentum Change
/ CYCLE Change and Vice Versa.
Notice One thing: HOW LEVELS are Working.
Use any Momentum Indicator / Oscillator or as you "USED to" to Take entry.
━━━━━🟥🟧🟨🟩🟦🟪⬛━━━━━
⚠️ DISCLAIMER:
The information, views, and ideas shared here are purely for educational and informational purposes only. They are not intended as investment advice or a recommendation to buy, sell, or hold any financial instruments. I am not a SEBI-registered financial adviser.
Trading and investing in the stock market involves risk, and you should do your own research and analysis. You are solely responsible for any decisions made based on this research.
"🔔As HARD EARNED MONEY IS YOUR's, So DECISION SHOULD HAVE TO BE YOUR's".
━━━━━🟥🟧🟨🟩🟦🟪⬛━━━━━
❇️ Follow notification about periodical View
💥 Do Comment for Stock WEEKLY Level Analysis.🚀
📊 Do you agree with this view?
✈️ HIT THE PLANE ICON if this technical observation resonates with you. It will Motivate me.
━━━━━🟥🟧🟨🟩🟦🟪⬛━━━━━
💡 If You LOOKING any CHART & want for Level and ANALYZE?
Share your desired stock names in the comments below! I will try to analyze the chart Levels, patterns and share my technical view (so far my Knowledge).
If Viewers think It can identify meaningful setups. Looking forward to hearing from all of you — let's keep this discussion going and help each other make better trading decisions.
___________🔕^^^⚫⚪^🙏🏼🙏🏼🙏🏼^⚪⚫^^^🔔___________
SENSEX DAILY / Short Range Level Analysis for 15th Jun 2026🔕 SGMN SplD BULLISH Above => 75702.
🔕 SGMN SplD Bearish BELOW => 75364.
Mentioned analysis based on 2 consecutive candle close in 15 min Time Frame.
━━━━━🟥🟧🟨🟩🟦🟪⬛━━━━━
💥Level Interpretation / description:
✍🏻L#1: If the candle crossed & stays above the “Buy Gen”, it is treated / considered as Bullish bias. Cfm=> Confirmation.
L#2: Possibility / Probability of REVERSAL near 🔕RL/TF1 & 🔔RL/TF2
L#3: If the candle stays above “Sell Gen” but below “Buy Gen”, it is treated / considered as Sidewise. Aggressive Traders can take Long position near “Sell Gen” either retesting or crossed from Below & vice-versa i.e. can take Short position near “Buy Gen” either retesting or crossed downward from Above.
L#4: If the candle crossed & stays below the “Sell Gen”, it is treated / considered a Bearish bias.
L#5: Possibility / Probability of REVERSAL near 🔕RL/TF1 & 🔔RL/TF2
HZB (Buy side) & HZS (Sell side) => Hurdle Zone,
✍🏻 *** Specialty of “HZB#1, HZB#2 HZS#1 & HZS#2” is Sidewise (behaviour in Nature)
Rest Plotted and Mentioned on Chart
Color code Used:
Green, BLUE =. Positive bias.
Safron, RED =. Negative bias.
RED in Between Green means Trend Finder / Momentum Change
/ CYCLE Change and Vice Versa.
Notice One thing: HOW LEVELS are Working.
Use any Momentum Indicator / Oscillator or as you "USED to" to Take entry.
━━━━━🟥🟧🟨🟩🟦🟪⬛━━━━━
⚠️ DISCLAIMER:
The information, views, and ideas shared here are purely for educational and informational purposes only. They are not intended as investment advice or a recommendation to buy, sell, or hold any financial instruments. I am not a SEBI-registered financial adviser.
Trading and investing in the stock market involves risk, and you should do your own research and analysis. You are solely responsible for any decisions made based on this research.
"🔔As HARD EARNED MONEY IS YOUR's, So DECISION SHOULD HAVE TO BE YOUR's".
━━━━━🟥🟧🟨🟩🟦🟪⬛━━━━━
❇️ Follow notification about periodical View
💥 Do Comment for Stock WEEKLY Level Analysis.🚀
📊 Do you agree with this view?
✈️ HIT THE PLANE ICON if this technical observation resonates with you. It will Motivate me.
━━━━━🟥🟧🟨🟩🟦🟪⬛━━━━━
💡 If You LOOKING any CHART & want for Level and ANALYZE?
Share your desired stock names in the comments below! I will try to analyze the chart Levels, patterns and share my technical view (so far my Knowledge).
If Viewers think It can identify meaningful setups. Looking forward to hearing from all of you — let's keep this discussion going and help each other make better trading decisions.
___________🔕^^^⚫⚪^🙏🏼🙏🏼🙏🏼^⚪⚫^^^🔔___________ SENSEX WEEKLY /Positional Level Analysis: 15th-19th Jun 2026SENSEX WEEKLY /Positional Level Analysis: 15th-19th Jun 2026.
🔔 SGMN SplWP BULLISH Above => 76190.
🔔 SGMN SplP BEARISH Below => 74899.
Mentioned analysis based on 2 consecutive candle close in 15 min Time Frame.
━━━━━🟥🟧🟨🟩🟦🟪⬛━━━━━
💥Level Interpretation / description:
✍🏻L#1: If the candle crossed & stays above the “Buy Gen”, it is treated / considered as Bullish bias. Cfm=> Confirmation.
L#2: Possibility / Probability of REVERSAL near 🔕RL/TF1 & 🔔RL/TF2
L#3: If the candle stays above “Sell Gen” but below “Buy Gen”, it is treated / considered as Sidewise. Aggressive Traders can take Long position near “Sell Gen” either retesting or crossed from Below & vice-versa i.e. can take Short position near “Buy Gen” either retesting or crossed downward from Above.
L#4: If the candle crossed & stays below the “Sell Gen”, it is treated / considered a Bearish bias.
L#5: Possibility / Probability of REVERSAL near 🔕RL/TF1 & 🔔RL/TF2
HZB (Buy side) & HZS (Sell side) => Hurdle Zone,
✍🏻 *** Specialty of “HZB#1, HZB#2 HZS#1 & HZS#2” is Sidewise (behaviour in Nature)
Rest Plotted and Mentioned on Chart
Color code Used:
Green, BLUE =. Positive bias.
Safron, RED =. Negative bias.
RED in Between Green means Trend Finder / Momentum Change
/ CYCLE Change and Vice Versa.
Notice One thing: HOW LEVELS are Working.
Use any Momentum Indicator / Oscillator or as you "USED to" to Take entry.
━━━━━🟥🟧🟨🟩🟦🟪⬛━━━━━
⚠️ DISCLAIMER:
The information, views, and ideas shared here are purely for educational and informational purposes only. They are not intended as investment advice or a recommendation to buy, sell, or hold any financial instruments. I am not a SEBI-registered financial adviser.
Trading and investing in the stock market involves risk, and you should do your own research and analysis. You are solely responsible for any decisions made based on this research.
"🔔As HARD EARNED MONEY IS YOUR's, So DECISION SHOULD HAVE TO BE YOUR's".
━━━━━🟥🟧🟨🟩🟦🟪⬛━━━━━
❇️ Follow notification about periodical View
💥 Do Comment for Stock WEEKLY Level Analysis.🚀
📊 Do you agree with this view?
✈️ HIT THE PLANE ICON if this technical observation resonates with you. It will Motivate me.
━━━━━🟥🟧🟨🟩🟦🟪⬛━━━━━
💡 If You LOOKING any CHART & want for Level and ANALYZE?
Share your desired stock names in the comments below! I will try to analyze the chart Levels, patterns and share my technical view (so far my Knowledge).
If Viewers think It can identify meaningful setups. Looking forward to hearing from all of you — let's keep this discussion going and help each other make better trading decisions.
___________🔕^^^⚫⚪^🙏🏼🙏🏼🙏🏼^⚪⚫^^^🔔___________  Short
Short
XAUUSD – H1 Bearish Structure Remains Active Below Sell Zone
Gold is still trading under short-term bearish pressure on the H1 chart. After the sharp decline from the upper liquidity area, price is now moving inside a corrective structure, but the recovery remains limited below the key sell zone around 4,247 – 4,254.
FUNDAMENTAL ANALYSIS
Gold is still reacting to the U.S. dollar, Treasury yields and upcoming U.S. data. For now, the technical structure remains more important because price has not confirmed a strong bullish reversal yet.
As long as gold stays below the main resistance and sell zone, the short-term view remains cautious and sellers may continue to defend higher prices.
TECHNICAL ANALYSIS – SMC + FIBONACCI
From an SMC perspective, gold has already created a strong bearish displacement on H1. The market broke below previous support, then formed a recovery from the lowest support this week around 4,022.
However, the current rebound is still trading below the major liquidity zone and below the SMA 200. This means the upside move may only be a corrective pullback before sellers react again.
The sell entry zone around 4,247 – 4,254 is the key area to watch. This zone sits near the previous breakdown area and may act as a resistance test. If price reaches this area and shows rejection, the bearish continuation setup becomes more attractive.
The lower liquidity area around 4,175 – 4,185 is also important. If gold breaks below this zone, sellers may push price toward the buy-test resistance around 4,119, then possibly back to the weekly low at 4,022.
KEY PRICE ZONES TO WATCH
Current price area: 4,218
Liquidity support zone: 4,175 – 4,185
Buy-test resistance: 4,119
Sell entry zone: 4,247 – 4,254
Major resistance: 4,269
Upper liquidity zone: 4,375 – 4,400
Lowest support this week: 4,022
Main bearish target: 4,119 – 4,022
Invalidation area for sell view: Above 4,269
TRADING SCENARIOS
Sell Scenario – Priority H1 View
If gold recovers into the 4,247 – 4,254 sell zone and shows rejection, I will watch for a bearish continuation setup.
Sell Zone: 4,247 – 4,254
Entry Condition: Bearish rejection, failed breakout, lower-timeframe CHoCH, or strong bearish displacement from the sell zone.
Stop Loss: Above 4,269 or above the nearest swing high.
Take Profit:
TP1: 4,175 – 4,185
TP2: 4,119
TP3: 4,022
Alternative Sell Scenario
If gold breaks below the 4,175 – 4,185 liquidity zone with strong momentum, sellers may return earlier without waiting for a higher pullback.
Sell Condition: Wait for a clean break below the liquidity zone, then watch for a retest and rejection.
Target: 4,119 – 4,022
Buy Scenario – Only Short-Term Reaction
A buy setup is not the main view on H1. However, if gold sweeps the 4,175 – 4,185 liquidity zone and quickly recovers, a short-term corrective bounce may appear.
Buy Zone: 4,175 – 4,185
Entry Condition: Liquidity sweep, bullish rejection, or lower-timeframe bullish CHoCH.
Take Profit:
TP1: 4,218
TP2: 4,247 – 4,254
Invalidation: If price breaks and holds below 4,175, the buy idea is invalid.
MY VIEW ON GOLD
My H1 view for gold remains bearish while price stays below the 4,247 – 4,254 sell zone and below the stronger resistance around 4,269.
The cleaner plan is to wait for price to retest the sell zone, then observe rejection on the smaller timeframe. If sellers defend this area, gold may continue lower toward 4,175, 4,119 and possibly 4,022.
Overall, gold can still recover slightly in the short term, but the main H1 structure remains weak unless buyers reclaim 4,269 with strong momentum.
Do you think gold will reject from the 4,247 – 4,254 sell zone, or break lower from the liquidity area first?
 Short
Short
BANKNIFTY DAILYY /Short Range Level Analysis for 15th Jun 2026🔕 SGMN SplD BULLISH Above => 57018.
🔕 SGMN SplD Bearish BELOW => 56622.
Mentioned analysis based on 2 consecutive candle close in 15 min Time Frame.
━━━━━🟥🟧🟨🟩🟦🟪⬛━━━━━
💥Level Interpretation / description:
✍🏻L#1: If the candle crossed & stays above the “Buy Gen”, it is treated / considered as Bullish bias. Cfm=> Confirmation.
L#2: Possibility / Probability of REVERSAL near 🔕RL/TF1 & 🔔RL/TF2
L#3: If the candle stays above “Sell Gen” but below “Buy Gen”, it is treated / considered as Sidewise. Aggressive Traders can take Long position near “Sell Gen” either retesting or crossed from Below & vice-versa i.e. can take Short position near “Buy Gen” either retesting or crossed downward from Above.
L#4: If the candle crossed & stays below the “Sell Gen”, it is treated / considered a Bearish bias.
L#5: Possibility / Probability of REVERSAL near 🔕RL/TF1 & 🔔RL/TF2
HZB (Buy side) & HZS (Sell side) => Hurdle Zone,
✍🏻 *** Specialty of “HZB#1, HZB#2 HZS#1 & HZS#2” is Sidewise (behaviour in Nature)
Rest Plotted and Mentioned on Chart
Color code Used:
Green, BLUE =. Positive bias.
Safron, RED =. Negative bias.
RED in Between Green means Trend Finder / Momentum Change
/ CYCLE Change and Vice Versa.
Notice One thing: HOW LEVELS are Working.
Use any Momentum Indicator / Oscillator or as you "USED to" to Take entry.
━━━━━🟥🟧🟨🟩🟦🟪⬛━━━━━
⚠️ DISCLAIMER:
The information, views, and ideas shared here are purely for educational and informational purposes only. They are not intended as investment advice or a recommendation to buy, sell, or hold any financial instruments. I am not a SEBI-registered financial adviser.
Trading and investing in the stock market involves risk, and you should do your own research and analysis. You are solely responsible for any decisions made based on this research.
"🔔As HARD EARNED MONEY IS YOUR's, So DECISION SHOULD HAVE TO BE YOUR's".
━━━━━🟥🟧🟨🟩🟦🟪⬛━━━━━
❇️ Follow notification about periodical View
💥 Do Comment for Stock WEEKLY Level Analysis.🚀
📊 Do you agree with this view?
✈️ HIT THE PLANE ICON if this technical observation resonates with you. It will Motivate me.
━━━━━🟥🟧🟨🟩🟦🟪⬛━━━━━
💡 If You LOOKING any CHART & want for Level and ANALYZE?
Share your desired stock names in the comments below! I will try to analyze the chart Levels, patterns and share my technical view (so far my Knowledge).
If Viewers think It can identify meaningful setups. Looking forward to hearing from all of you — let's keep this discussion going and help each other make better trading decisions.
___________🔕^^^⚫⚪^🙏🏼🙏🏼🙏🏼^⚪⚫^^^🔔___________ XAUUSD — EMA Bearish Trend, Sell From Fibonacci Value Zone
Fundamental Analysis
Gold remains under bearish pressure as the market focuses on key USD events this week, including the Federal Funds Rate, FOMC Economic Projections, FOMC Statement, and the FOMC Press Conference.
These events may create strong volatility for XAUUSD. If the Fed tone supports USD strength or keeps rate expectations tight, gold may continue to face selling pressure on recovery attempts.
Technical Analysis
On the 4H chart, XAUUSD is still moving inside a descending channel. EMA 34, EMA 89, and EMA 200 remain above price, confirming that the main trend is still bearish.
Price is currently trading around 4,218 after a short-term recovery from the lower area. However, this bounce is moving toward the Fibonacci value zone and EMA resistance area around 4,240 - 4,280.
This zone is important because it aligns with the 0.236 - 0.382 Fibonacci retracement, the EMA range, previous broken structure, and channel pressure. If price rejects from this area, sellers may regain control.
The key bearish confirmation level is 4,170. A clean break below this level would strengthen the downside continuation toward 4,026. If bearish momentum expands further, the weekly goal remains the Fibonacci Extension 1.618 zone around 3,813 - 3,815.
Important Key Levels
Current price area: 4,218
Fibonacci value sell zone: 4,240 - 4,280
EMA sell range: 4,240 - 4,280
Short-term resistance: 4,239 - 4,281
Key bearish confirmation level: 4,170
Reaction support: 4,026
Weekly Fibonacci Extension target: 3,813 - 3,815
Invalidation area: above 4,370
Trading Scenario
Main Sell Scenario
Entry: 4,240 - 4,280
Stop Loss: 4,370
Take Profit 1: 4,170
Take Profit 2: 4,026
Take Profit 3: 3,813 - 3,815
Sell Condition
The preferred setup is to wait for gold to pull back into the 4,240 - 4,280 Fibonacci value zone. This area aligns with the EMA sell range, descending channel pressure, and previous broken structure.
A sell setup becomes more valid if price forms bearish rejection from this zone, such as a long upper wick, bearish engulfing candle, failed breakout, or lower high below the EMA structure.
If price rejects from the sell zone and breaks below 4,170, the bearish continuation view becomes stronger. The next reaction level is 4,026, followed by the weekly Fibonacci Extension target around 3,813 - 3,815.
Entry Conditions
Wait for price to retest 4,240 - 4,280.
Look for bearish rejection before entering sell.
A break below 4,170 confirms stronger bearish pressure.
Be careful with FOMC volatility this week.
If price breaks and holds above 4,370, the sell setup is invalid.
Overall, the main view remains bearish while XAUUSD trades below the EMA structure and inside the descending channel. The preferred plan is to wait for a pullback into the Fibonacci value zone, then look for sell confirmation toward 4,170, 4,026, and the weekly Fibonacci Extension zone around 3,813 - 3,815.
Do you share the same bearish view on gold, or are you waiting for FOMC confirmation before taking a position?
Short 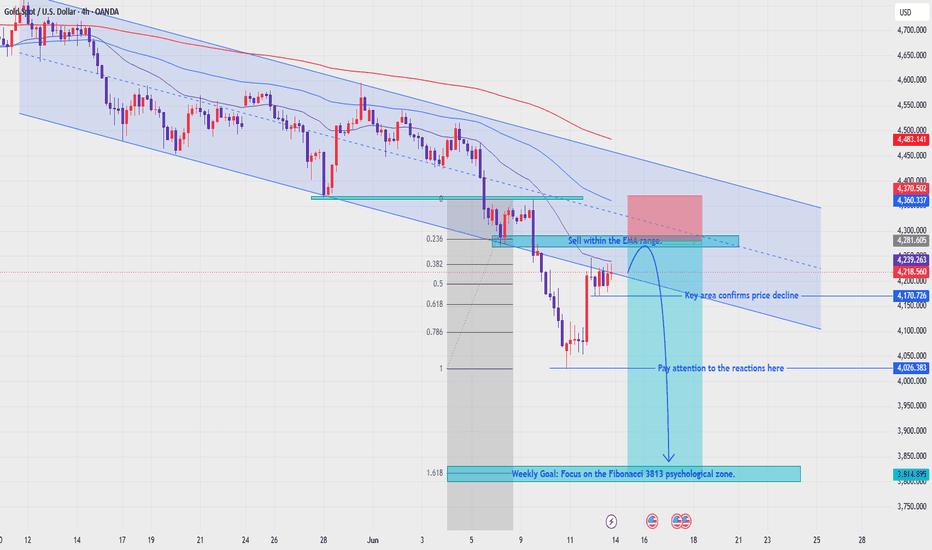
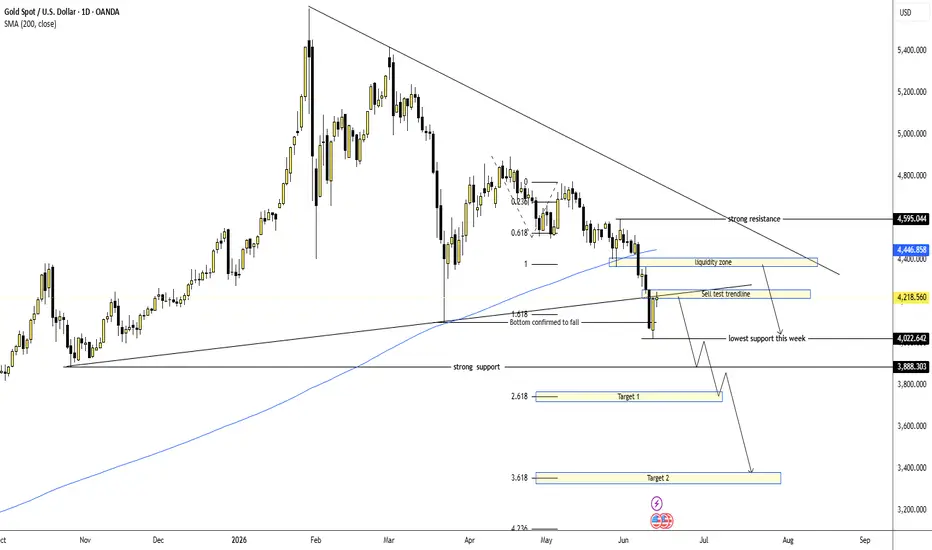
XAUUSD – Weekly OutlookGold Remains Bearish Below Major Trendline
Gold is still trading under clear weekly pressure after losing the rising support structure and failing to reclaim the higher liquidity area. The daily chart shows that sellers remain in control while price is moving below the SMA 200 and below the long-term descending trendline.
FUNDAMENTAL ANALYSIS
Gold remains sensitive to the U.S. dollar, Treasury yields and upcoming U.S. economic data. If the dollar stays firm and rate-cut expectations remain weak, gold may continue to face selling pressure next week.
For now, the technical structure is still more important. As long as gold cannot reclaim the broken support and liquidity zone above, bearish continuation remains the main view.
TECHNICAL ANALYSIS – SMC + FIBONACCI
From an SMC perspective, gold has broken below an important support structure and confirmed weakness after failing to hold the previous trendline base. The recent move shows bearish displacement, and price is now testing the broken trendline area from below.
The zone around 4,218 – 4,300 is important because it may act as a sell-test area. If price fails to reclaim this zone, sellers may continue to defend the structure.
Above price, the liquidity zone around 4,400 – 4,446 is a stronger resistance area, also close to the SMA 200. A deeper recovery into this zone would still be considered a bearish retest unless gold breaks and holds above it clearly.
The main downside focus is the weekly low near 4,022. If this level breaks, gold may continue toward the strong support around 3,888, followed by the Fibonacci extension targets near 3,730 and 3,380.
KEY PRICE ZONES TO WATCH
Current price area: 4,218
Sell test trendline area: 4,218 – 4,300
Liquidity zone / SMA 200 resistance: 4,400 – 4,446
Strong resistance: 4,595
Lowest support this week: 4,022
Strong support: 3,888
Fibonacci Target 1: 3,730 – 3,700
Fibonacci Target 2: 3,400 – 3,360
Invalidation area for sell view: Above 4,446 – 4,595
TRADING SCENARIOS
Sell Scenario – Priority Weekly View
If gold retests the 4,218 – 4,300 area and shows rejection, I will watch for a bearish continuation setup.
Sell Zone: 4,218 – 4,300
Entry Condition: Bearish rejection, failed retest, lower-timeframe CHoCH, or strong bearish displacement from the broken trendline area.
Stop Loss: Above 4,300 or above the nearest swing high.
Take Profit:
TP1: 4,022
TP2: 3,888
TP3: 3,730 – 3,700
Alternative Sell Scenario
If gold recovers deeper into the 4,400 – 4,446 liquidity zone, I will still watch for sell reaction if price fails to reclaim the SMA 200 and descending trendline.
Sell Condition: Wait for rejection from 4,400 – 4,446 with bearish confirmation on the smaller timeframe.
Target: 4,022 – 3,888
Buy Scenario – Only Corrective Recovery
A buy setup is not the main view for next week. However, if gold holds above 4,022 and creates a bullish reaction, a short-term corrective bounce may appear.
Buy Zone: 4,022 – 4,000
Entry Condition: Liquidity sweep, bullish rejection, or lower-timeframe bullish CHoCH.
Take Profit:
TP1: 4,218
TP2: 4,300
Invalidation: If price breaks and holds below 4,022, the buy idea is invalid.
MY VIEW ON GOLD
My weekly view for gold remains bearish. The chart shows that price has lost an important support structure and is now trading below the SMA 200, while the descending trendline continues to pressure the market from above.
The cleaner plan is to wait for gold to retest resistance, then observe seller reaction on the smaller timeframe. The 4,218 – 4,300 area is the first sell-test zone, while 4,400 – 4,446 is the stronger liquidity resistance if price recovers deeper.
Overall, gold remains weak unless buyers can reclaim the liquidity zone and hold above the SMA 200. If 4,022 breaks, the next weekly downside path may open toward 3,888 and the Fibonacci extension targets below.
Do you think gold will reject from the trendline retest next week, or will price recover deeper into the 4,400 liquidity zone first? Short 
NIFTY DAILY / Short Range Level Analysis for 15th Jun 2026🔕 SGMN SplD BULLISH Above => 23671.
🔕 SGMN SplD Bearish BELOW => 23577.
Mentioned analysis based on 2 consecutive candle close in 15 min Time Frame.
━━━━━🟥🟧🟨🟩🟦🟪⬛━━━━━
💥Level Interpretation / description:
✍🏻L#1: If the candle crossed & stays above the “Buy Gen”, it is treated / considered as Bullish bias. Cfm=> Confirmation.
L#2: Possibility / Probability of REVERSAL near 🔕RL/TF1 & 🔔RL/TF2
L#3: If the candle stays above “Sell Gen” but below “Buy Gen”, it is treated / considered as Sidewise. Aggressive Traders can take Long position near “Sell Gen” either retesting or crossed from Below & vice-versa i.e. can take Short position near “Buy Gen” either retesting or crossed downward from Above.
L#4: If the candle crossed & stays below the “Sell Gen”, it is treated / considered a Bearish bias.
L#5: Possibility / Probability of REVERSAL near 🔕RL/TF1 & 🔔RL/TF2
HZB (Buy side) & HZS (Sell side) => Hurdle Zone,
✍🏻 *** Specialty of “HZB#1, HZB#2 HZS#1 & HZS#2” is Sidewise (behaviour in Nature)
Rest Plotted and Mentioned on Chart
Color code Used:
Green, BLUE =. Positive bias.
Safron, RED =. Negative bias.
RED in Between Green means Trend Finder / Momentum Change
/ CYCLE Change and Vice Versa.
Notice One thing: HOW LEVELS are Working.
Use any Momentum Indicator / Oscillator or as you "USED to" to Take entry.
━━━━━🟥🟧🟨🟩🟦🟪⬛━━━━━
⚠️ DISCLAIMER:
The information, views, and ideas shared here are purely for educational and informational purposes only. They are not intended as investment advice or a recommendation to buy, sell, or hold any financial instruments. I am not a SEBI-registered financial adviser.
Trading and investing in the stock market involves risk, and you should do your own research and analysis. You are solely responsible for any decisions made based on this research.
"🔔As HARD EARNED MONEY IS YOUR's, So DECISION SHOULD HAVE TO BE YOUR's".
━━━━━🟥🟧🟨🟩🟦🟪⬛━━━━━
❇️ Follow notification about periodical View
💥 Do Comment for Stock WEEKLY Level Analysis.🚀
📊 Do you agree with this view?
✈️ HIT THE PLANE ICON if this technical observation resonates with you. It will Motivate me.
━━━━━🟥🟧🟨🟩🟦🟪⬛━━━━━
💡 If You LOOKING any CHART & want for Level and ANALYZE?
Share your desired stock names in the comments below! I will try to analyze the chart Levels, patterns and share my technical view (so far my Knowledge).
If Viewers think It can identify meaningful setups. Looking forward to hearing from all of you — let's keep this discussion going and help each other make better trading decisions.
___________🔕^^^⚫⚪^🙏🏼🙏🏼🙏🏼^⚪⚫^^^🔔___________ NIFTY WEEKLY / POSITIONAL Level Analysis from 15th-19th Jun 2026🔔 SGMN SplWP Above BULLISH BIAS => 23694.
🔔 SGMN SplWP BELOW Bearish BIAS => 23428.
Mentioned analysis based on 2 consecutive candle close in 15 min Time Frame.
━━━━━🟥🟧🟨🟩🟦🟪⬛━━━━━
💥Level Interpretation / description:
✍🏻L#1: If the candle crossed & stays above the “Buy Gen”, it is treated / considered as Bullish bias. Cfm=> Confirmation.
L#2: Possibility / Probability of REVERSAL near 🔕RL/TF1 & 🔔RL/TF2
L#3: If the candle stays above “Sell Gen” but below “Buy Gen”, it is treated / considered as Sidewise. Aggressive Traders can take Long position near “Sell Gen” either retesting or crossed from Below & vice-versa i.e. can take Short position near “Buy Gen” either retesting or crossed downward from Above.
L#4: If the candle crossed & stays below the “Sell Gen”, it is treated / considered a Bearish bias.
L#5: Possibility / Probability of REVERSAL near 🔕RL/TF1 & 🔔RL/TF2
HZB (Buy side) & HZS (Sell side) => Hurdle Zone,
✍🏻 *** Specialty of “HZB#1, HZB#2 HZS#1 & HZS#2” is Sidewise (behaviour in Nature)
Rest Plotted and Mentioned on Chart
Color code Used:
Green, BLUE =. Positive bias.
Safron, RED =. Negative bias.
RED in Between Green means Trend Finder / Momentum Change
/ CYCLE Change and Vice Versa.
Notice One thing: HOW LEVELS are Working.
Use any Momentum Indicator / Oscillator or as you "USED to" to Take entry.
━━━━━🟥🟧🟨🟩🟦🟪⬛━━━━━
⚠️ DISCLAIMER:
The information, views, and ideas shared here are purely for educational and informational purposes only. They are not intended as investment advice or a recommendation to buy, sell, or hold any financial instruments. I am not a SEBI-registered financial adviser.
Trading and investing in the stock market involves risk, and you should do your own research and analysis. You are solely responsible for any decisions made based on this research.
"🔔As HARD EARNED MONEY IS YOUR's, So DECISION SHOULD HAVE TO BE YOUR's".
━━━━━🟥🟧🟨🟩🟦🟪⬛━━━━━
❇️ Follow notification about periodical View
💥 Do Comment for Stock WEEKLY Level Analysis.🚀
📊 Do you agree with this view?
✈️ HIT THE PLANE ICON if this technical observation resonates with you. It will Motivate me.
━━━━━🟥🟧🟨🟩🟦🟪⬛━━━━━
💡 If You LOOKING any CHART & want for Level and ANALYZE?
Share your desired stock names in the comments below! I will try to analyze the chart Levels, patterns and share my technical view (so far my Knowledge).
If Viewers think It can identify meaningful setups. Looking forward to hearing from all of you — let's keep this discussion going and help each other make better trading decisions.
___________🔕^^^⚫⚪^🙏🏼🙏🏼🙏🏼^⚪⚫^^^🔔___________ Gold May Recover Into Fibonacci 0.5 Before Sellers React Again
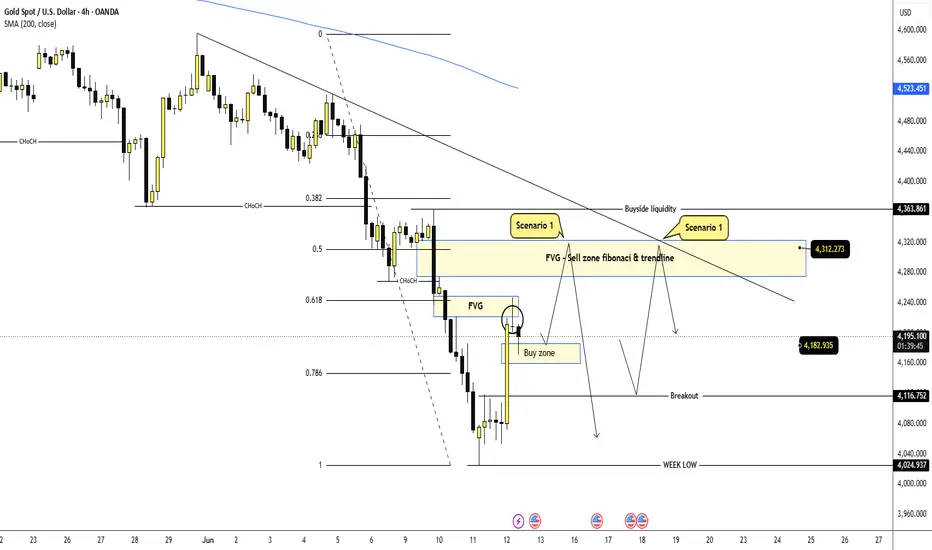
Gold is showing a short-term recovery after sweeping the weekly low area around 4,024. However, the broader H4 structure is still trading under the descending trendline and below the SMA 200, which means the current upside move should be treated as a corrective pullback unless price can break the higher resistance zone clearly.
FUNDAMENTAL ANALYSIS
Gold is still reacting strongly to the U.S. dollar, Treasury yields and upcoming U.S. data. The current rebound looks more like a technical recovery after sweeping lower liquidity, while the broader market has not confirmed a full bullish shift yet.
For now, I prefer using fundamentals as background only and focusing more on price reaction around the key Fibonacci, FVG and trendline zones.
TECHNICAL ANALYSIS – SMC + FIBONACCI
From an SMC perspective, gold has swept the lower liquidity near the weekly low around 4,024 and created a strong rebound. This reaction shows that buyers are active in the lower zone, but price is now approaching a more important decision area above.
The current buy zone around 4,160 – 4,182 is holding as short-term support. As long as price stays above this zone, gold may continue its corrective move toward the FVG and Fibonacci 0.5 area around 4,280 – 4,312.
This upper area is very important because it combines several technical factors: Fibonacci 0.5 retracement, FVG, previous liquidity, and the descending trendline. If price reaches this zone and starts to reject, it may become the main sell reaction area.
The bigger trend is still bearish while gold remains below the trendline and below the 4,363 buyside liquidity. A clean break above the sell zone would weaken the bearish view, but if sellers defend the Fibonacci area, gold may continue lower again toward 4,182, 4,116 and possibly back to the weekly low.
KEY PRICE ZONES TO WATCH
Current price area: 4,194
Short-term support / Buy zone: 4,160 – 4,182
Breakout level: 4,116
Fibonacci 0.5 / FVG sell zone: 4,280 – 4,312
Trendline reaction area: 4,280 – 4,312
Major buyside liquidity: 4,363
Nearest downside target: 4,182
Secondary downside target: 4,116
Weekly low: 4,024
Invalidation area for sell view: Above 4,312 – 4,363
TRADING SCENARIOS
Buy Scenario – Short-Term Recovery View
If gold holds above the 4,160 – 4,182 buy zone, I will watch for a short-term recovery toward the Fibonacci 0.5 area.
Buy Zone: 4,160 – 4,182
Entry Condition: Bullish rejection, liquidity sweep, or lower-timeframe CHoCH.
Stop Loss: Below 4,160 or below the nearest swing low.
Take Profit:
TP1: 4,240
TP2: 4,280
TP3: 4,312
Sell Scenario – Priority Reaction View
If gold reaches 4,280 – 4,312 and shows rejection, I will watch for a sell reaction from the Fibonacci 0.5, FVG and trendline confluence.
Sell Zone: 4,280 – 4,312
Entry Condition: Bearish rejection, failed breakout, or lower-timeframe CHoCH.
Stop Loss: Above 4,312 or above the nearest swing high.
Take Profit:
TP1: 4,182
TP2: 4,116
TP3: 4,024
Alternative Scenario
If gold breaks below 4,160 – 4,182 with strong momentum, the recovery idea becomes weaker and sellers may return earlier.
Sell Condition: Wait for a clean break and retest below the buy zone.
Target: 4,116 – 4,024
MY VIEW ON GOLD
My current view is that gold may continue its short-term recovery first, with the main upside area sitting around 4,280 – 4,312. This is the zone where I will watch sellers carefully because it combines Fibonacci 0.5, FVG and the descending trendline.
The cleaner plan is not to chase price in the middle. I prefer watching two reactions on the smaller timeframe: first, whether buyers can hold 4,160 – 4,182 for a move higher; second, whether sellers appear strongly around 4,280 – 4,312.
Overall, gold can still recover in the short term, but the main structure remains bearish unless price breaks above the trendline and holds above the sell zone.
Do you think gold will reach the 4,280 – 4,312 Fibonacci zone before sellers react again?
Long 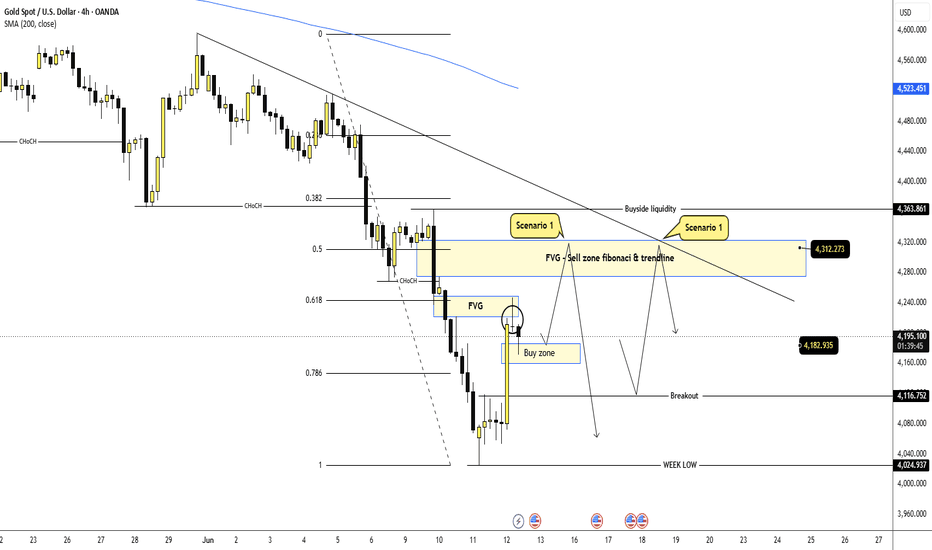
TMCV: Strong Business, Falling Chart. What Next?Tata Motors Commercial Vehicles (TMCV) has been in a steady downward correction since peaking at 509.00. Interestingly, while the company's underlying business remains healthy—showing strong double-digit sales growth and solid quarterly earnings—broader market pressures like rising oil prices have continued to weigh on the stock.
This drop has brought the price down to a very specific technical area where multiple chart patterns meet. Here is an objective, step-by-step look at the current structure.
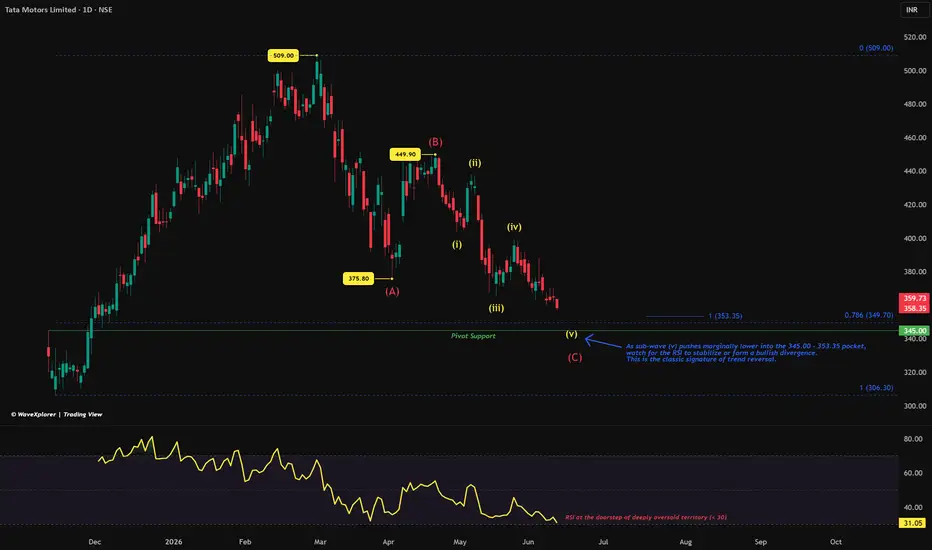
The Elliott Wave Pattern
When looking at the market cycle, the decline from the peak looks like a standard three-wave correction, labeled as (A), (B), and (C).
At the moment, the price is moving through the final stages of the downward Wave (C). Specifically, it is within the fifth sub-wave. In wave theory, these final sub-waves often represent the final phase of selling pressure before a trend settles.
A Three-Layer Support Pocket
Instead of just one single line on the chart, three completely different technical tools are pointing to the exact same price zone between 345.00 and 353.35 . This creates a strong area of interest:
Wave Projection: The mathematical target where the current down-wave equals standard targets sits at 353.35 .
Fibonacci Retracement: Drawing a line from the major low up to the 509.00 peak shows that the deep 78.6% retracement level sits at 349.70 .
Historical Pivot: A major horizontal support line where buyers have stepped in previously sits at 345.00 .
RSI and the Ex-Dividend Factor
The Daily Relative Strength Index (RSI) is currently reading 31.05, meaning the stock is right on the edge of becoming deeply oversold.
There is also a corporate action to keep in mind. The stock goes ex-dividend on June 12 for ₹4 per share. This means the stock price will automatically adjust downward by ₹4 at the market open. This mechanical drop could push the price right into our highlighted 345.00–353.35 support zone. As this happens, we want to watch if the RSI begins to flatten out or show signs of stabilizing, which would indicate that selling momentum is slowing down.
Where the Analysis Fails (Invalidation Level)
No chart pattern is guaranteed to work, and risk management is the most important part of trading.
If the market faces severe pressure and the stock finishes with a decisive daily close below 340.00 , this entire outlook is invalidated. A clear break below 340.00 means the down-wave is stretching longer than expected. In that scenario, the correction could deepen further toward the 300.00–315.00 range, and the idea of immediate support should be discarded.
Disclaimer: This post is for educational purposes only and is not financial advice. I am not a SEBI-registered analyst. Please do your own research and manage your risk carefully. Long 
SENSEX DAILY/ Short Range Level Analysis for 12th Jun 2026🔕 SGMN SplD BULLISH Above => 74000.
🔕 SGMN SplD Bearish BELOW => 73675.
Mentioned analysis based on 2 consecutive candle close in 15 min Time Frame.
━━━━━🟥🟧🟨🟩🟦🟪⬛━━━━━
💥Level Interpretation / description:
✍🏻L#1: If the candle crossed & stays above the “Buy Gen”, it is treated / considered as Bullish bias. Cfm=> Confirmation.
L#2: Possibility / Probability of REVERSAL near 🔕RL/TF1 & 🔔RL/TF2
L#3: If the candle stays above “Sell Gen” but below “Buy Gen”, it is treated / considered as Sidewise. Aggressive Traders can take Long position near “Sell Gen” either retesting or crossed from Below & vice-versa i.e. can take Short position near “Buy Gen” either retesting or crossed downward from Above.
L#4: If the candle crossed & stays below the “Sell Gen”, it is treated / considered a Bearish bias.
L#5: Possibility / Probability of REVERSAL near 🔕RL/TF1 & 🔔RL/TF2
HZB (Buy side) & HZS (Sell side) => Hurdle Zone,
✍🏻 *** Specialty of “HZB#1, HZB#2 HZS#1 & HZS#2” is Sidewise (behaviour in Nature)
Rest Plotted and Mentioned on Chart
Color code Used:
Green, BLUE =. Positive bias.
Safron, RED =. Negative bias.
RED in Between Green means Trend Finder / Momentum Change
/ CYCLE Change and Vice Versa.
Notice One thing: HOW LEVELS are Working.
Use any Momentum Indicator / Oscillator or as you "USED to" to Take entry.
━━━━━🟥🟧🟨🟩🟦🟪⬛━━━━━
⚠️ DISCLAIMER:
The information, views, and ideas shared here are purely for educational and informational purposes only. They are not intended as investment advice or a recommendation to buy, sell, or hold any financial instruments. I am not a SEBI-registered financial adviser.
Trading and investing in the stock market involves risk, and you should do your own research and analysis. You are solely responsible for any decisions made based on this research.
"🔔As HARD EARNED MONEY IS YOUR's, So DECISION SHOULD HAVE TO BE YOUR's".
━━━━━🟥🟧🟨🟩🟦🟪⬛━━━━━
❇️ Follow notification about periodical View
💥 Do Comment for Stock WEEKLY Level Analysis.🚀
📊 Do you agree with this view?
✈️ HIT THE PLANE ICON if this technical observation resonates with you. It will Motivate me.
━━━━━🟥🟧🟨🟩🟦🟪⬛━━━━━
💡 If You LOOKING any CHART & want for Level and ANALYZE?
Share your desired stock names in the comments below! I will try to analyze the chart Levels, patterns and share my technical view (so far my Knowledge).
If Viewers think It can identify meaningful setups. Looking forward to hearing from all of you — let's keep this discussion going and help each other make better trading decisions.
___________🔕^^^⚫⚪^🙏🏼🙏🏼🙏🏼^⚪⚫^^^🔔___________ BANKNIFTY DAILYY /Short Range Level Analysis for 12th Jun 2026🔕 SGMN SplD BULLISH Above => 55362.
🔕 SGMN SplD Bearish BELOW => 54998.
Mentioned analysis based on 2 consecutive candle close in 15 min Time Frame.
━━━━━🟥🟧🟨🟩🟦🟪⬛━━━━━
💥Level Interpretation / description:
✍🏻L#1: If the candle crossed & stays above the “Buy Gen”, it is treated / considered as Bullish bias. Cfm=> Confirmation.
L#2: Possibility / Probability of REVERSAL near 🔕RL/TF1 & 🔔RL/TF2
L#3: If the candle stays above “Sell Gen” but below “Buy Gen”, it is treated / considered as Sidewise. Aggressive Traders can take Long position near “Sell Gen” either retesting or crossed from Below & vice-versa i.e. can take Short position near “Buy Gen” either retesting or crossed downward from Above.
L#4: If the candle crossed & stays below the “Sell Gen”, it is treated / considered a Bearish bias.
L#5: Possibility / Probability of REVERSAL near 🔕RL/TF1 & 🔔RL/TF2
HZB (Buy side) & HZS (Sell side) => Hurdle Zone,
✍🏻 *** Specialty of “HZB#1, HZB#2 HZS#1 & HZS#2” is Sidewise (behaviour in Nature)
Rest Plotted and Mentioned on Chart
Color code Used:
Green, BLUE =. Positive bias.
Safron, RED =. Negative bias.
RED in Between Green means Trend Finder / Momentum Change
/ CYCLE Change and Vice Versa.
Notice One thing: HOW LEVELS are Working.
Use any Momentum Indicator / Oscillator or as you "USED to" to Take entry.
━━━━━🟥🟧🟨🟩🟦🟪⬛━━━━━
⚠️ DISCLAIMER:
The information, views, and ideas shared here are purely for educational and informational purposes only. They are not intended as investment advice or a recommendation to buy, sell, or hold any financial instruments. I am not a SEBI-registered financial adviser.
Trading and investing in the stock market involves risk, and you should do your own research and analysis. You are solely responsible for any decisions made based on this research.
"🔔As HARD EARNED MONEY IS YOUR's, So DECISION SHOULD HAVE TO BE YOUR's".
━━━━━🟥🟧🟨🟩🟦🟪⬛━━━━━
❇️ Follow notification about periodical View
💥 Do Comment for Stock WEEKLY Level Analysis.🚀
📊 Do you agree with this view?
✈️ HIT THE PLANE ICON if this technical observation resonates with you. It will Motivate me.
━━━━━🟥🟧🟨🟩🟦🟪⬛━━━━━
💡 If You LOOKING any CHART & want for Level and ANALYZE?
Share your desired stock names in the comments below! I will try to analyze the chart Levels, patterns and share my technical view (so far my Knowledge).
If Viewers think It can identify meaningful setups. Looking forward to hearing from all of you — let's keep this discussion going and help each other make better trading decisions.
___________🔕^^^⚫⚪^🙏🏼🙏🏼🙏🏼^⚪⚫^^^🔔___________ NIFTY DAILY / Short Range Level Analysis for 12th June 2026🔕 SGMN SplD BULLISH Above => 23211.
🔕 SGMN SplD Bearish BELOW => 23115.
Mentioned analysis based on 2 consecutive candle close in 15 min Time Frame.
━━━━━🟥🟧🟨🟩🟦🟪⬛━━━━━
💥Level Interpretation / description:
✍🏻L#1: If the candle crossed & stays above the “Buy Gen”, it is treated / considered as Bullish bias. Cfm=> Confirmation.
L#2: Possibility / Probability of REVERSAL near 🔕RL/TF1 & 🔔RL/TF2
L#3: If the candle stays above “Sell Gen” but below “Buy Gen”, it is treated / considered as Sidewise. Aggressive Traders can take Long position near “Sell Gen” either retesting or crossed from Below & vice-versa i.e. can take Short position near “Buy Gen” either retesting or crossed downward from Above.
L#4: If the candle crossed & stays below the “Sell Gen”, it is treated / considered a Bearish bias.
L#5: Possibility / Probability of REVERSAL near 🔕RL/TF1 & 🔔RL/TF2
HZB (Buy side) & HZS (Sell side) => Hurdle Zone,
✍🏻 *** Specialty of “HZB#1, HZB#2 HZS#1 & HZS#2” is Sidewise (behaviour in Nature)
Rest Plotted and Mentioned on Chart
Color code Used:
Green, BLUE =. Positive bias.
Safron, RED =. Negative bias.
RED in Between Green means Trend Finder / Momentum Change
/ CYCLE Change and Vice Versa.
Notice One thing: HOW LEVELS are Working.
Use any Momentum Indicator / Oscillator or as you "USED to" to Take entry.
━━━━━🟥🟧🟨🟩🟦🟪⬛━━━━━
⚠️ DISCLAIMER:
The information, views, and ideas shared here are purely for educational and informational purposes only. They are not intended as investment advice or a recommendation to buy, sell, or hold any financial instruments. I am not a SEBI-registered financial adviser.
Trading and investing in the stock market involves risk, and you should do your own research and analysis. You are solely responsible for any decisions made based on this research.
"🔔As HARD EARNED MONEY IS YOUR's, So DECISION SHOULD HAVE TO BE YOUR's".
━━━━━🟥🟧🟨🟩🟦🟪⬛━━━━━
❇️ Follow notification about periodical View
💥 Do Comment for Stock WEEKLY Level Analysis.🚀
📊 Do you agree with this view?
✈️ HIT THE PLANE ICON if this technical observation resonates with you. It will Motivate me.
━━━━━🟥🟧🟨🟩🟦🟪⬛━━━━━
💡 If You LOOKING any CHART & want for Level and ANALYZE?
Share your desired stock names in the comments below! I will try to analyze the chart Levels, patterns and share my technical view (so far my Knowledge).
If Viewers think It can identify meaningful setups. Looking forward to hearing from all of you — let's keep this discussion going and help each other make better trading decisions.
___________🔕^^^⚫⚪^🙏🏼🙏🏼🙏🏼^⚪⚫^^^🔔___________