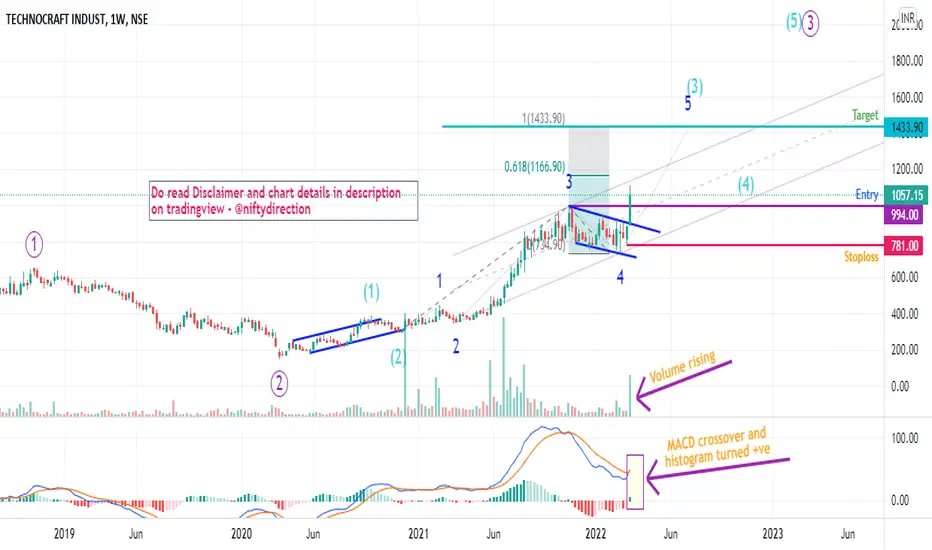
Technocraft Industries Wave 5 comingStock on weekly time frame has given flag breakout and looking bullish.
MACD has given positive crossover above zero line and MACD histogram also turned positive which are signals for upside
Expecting wave 5 to extend more than 0.618 Fibonacci levels.
Entry SL and targets are as per charts.
DISCLAIMER:
There is no guarantee of profits or no exceptions from losses.
The stock and its levels discussed are solely the personal views of my research.
You are advised to re
Fibonacci Extension
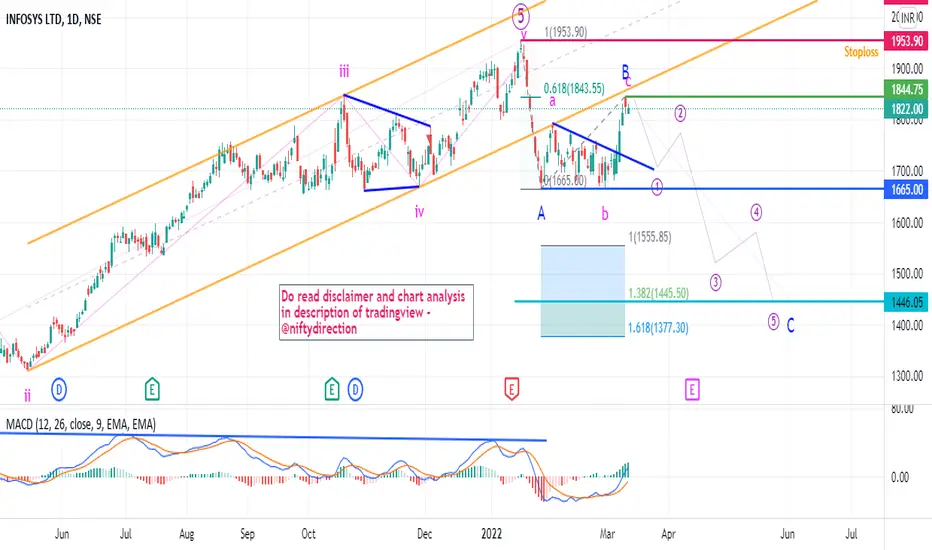
Infosys 400 Points Crack Ahead Wave C about to startInfosys recently made high near 1845 and got rejected from 0.618 Fibonacci.
The recovery it made from recent low 1665 was Flat abc(pink colour) correction where b was exactly touching start of a then wave c retraced up to 1.382 Fibonacci extension near 1845
On Larger degree correction not over yet and looks to be ABC zig zag correction which can take Infy towards 1445 which 1.382 extension in the form of five impulse waves as shown in chart. This expected within 1 month.
Analysis invalidati
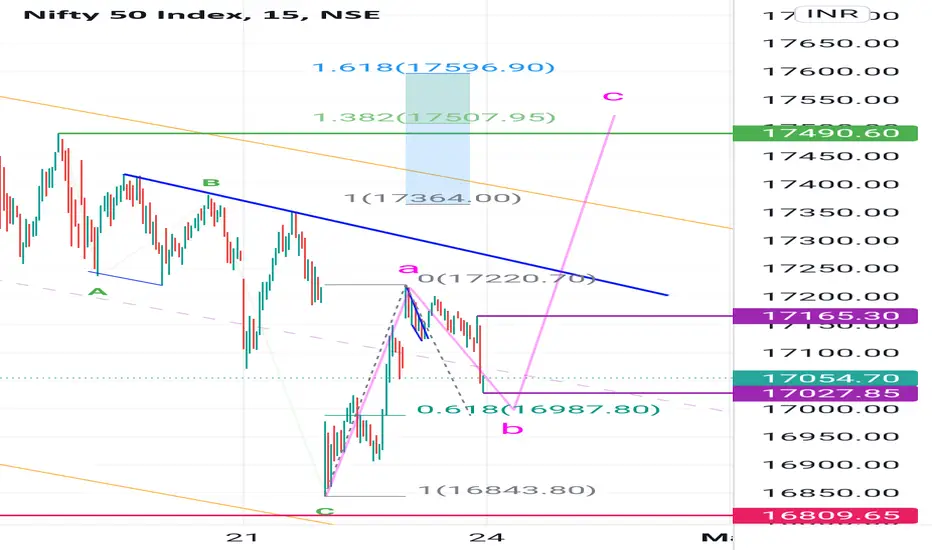
Nifty Tomorrow wave 3 or C to start UpNifty completed today one five wave sequence up at 17220 then in b or wave 2 correction.
Tomorrow any dip below 17000 to 16980 will get bought in for upside towards 17360-540 levels.
Gap up opening or move above 17100 will be first confirmation of rally 2nd confirmation will be swing high 17175 break.
DISCLAIMER:There is no guarantee of profits nor exceptions from losses.
Technical analysis provided on the chart is solely the personal views of my research.
You are advised to rely on your own
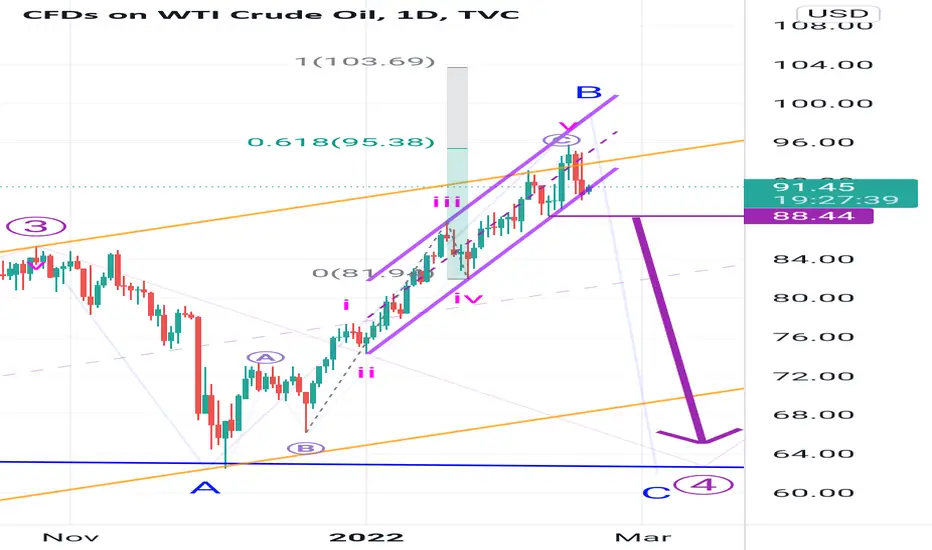
US Oil or Crude Wave 4 Expanding flat correctionCrude seems to be in expanding flat correction as wave A of B is clear 3 wave structure and B wave moved past start of Wave A.
Wave C of B is extended 2.618 fibonacci levels. Wave 5 of C of B is getting rejected at 0.618 fibonacci level also MACD have given negative crossover these are couple of negative signals.
Break of swing 88 will confirm downside as it will come out of channel. This will ensure movement towards end of wave A.
DISCLAIMER:There is no guarantee of profits nor exceptions f
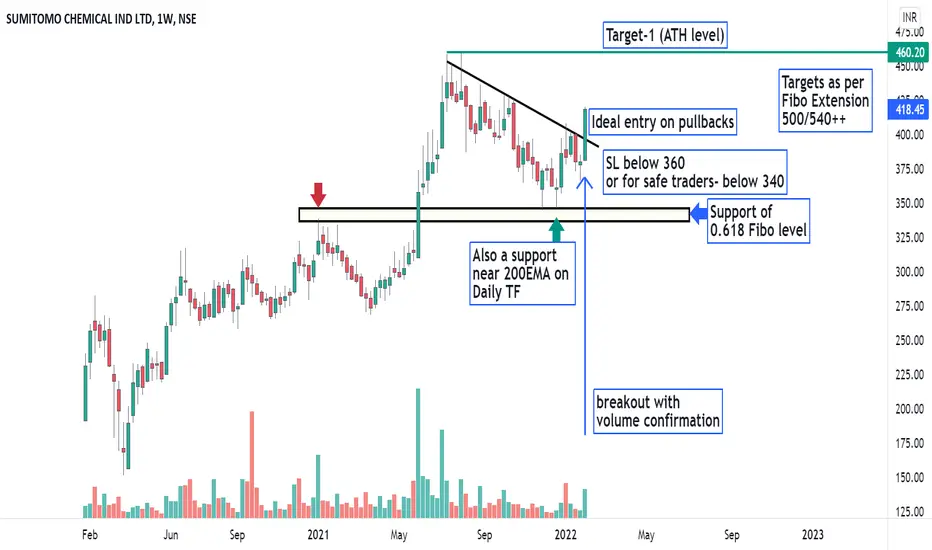
SUMICHEM - Breakout with Volume confirmation - Swing TradeThe analysis is done on weekly TF hence price may take few weeks to few months in order to reach the targets.
Trade setup is explained in image itself.
The above analysis is purely for educational purpose. Traders must do their own study & follow risk management before entering into any trade
Checkout my other ideas to understand how one can earn from stock markets with simple trade setups. Feel Free to comment below this or connect with me for any query or suggestion regarding this stock or P
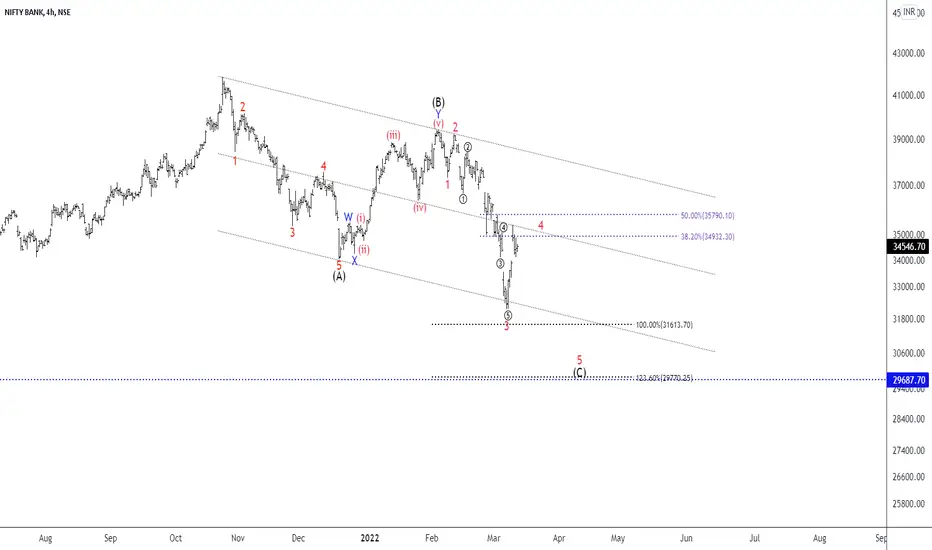
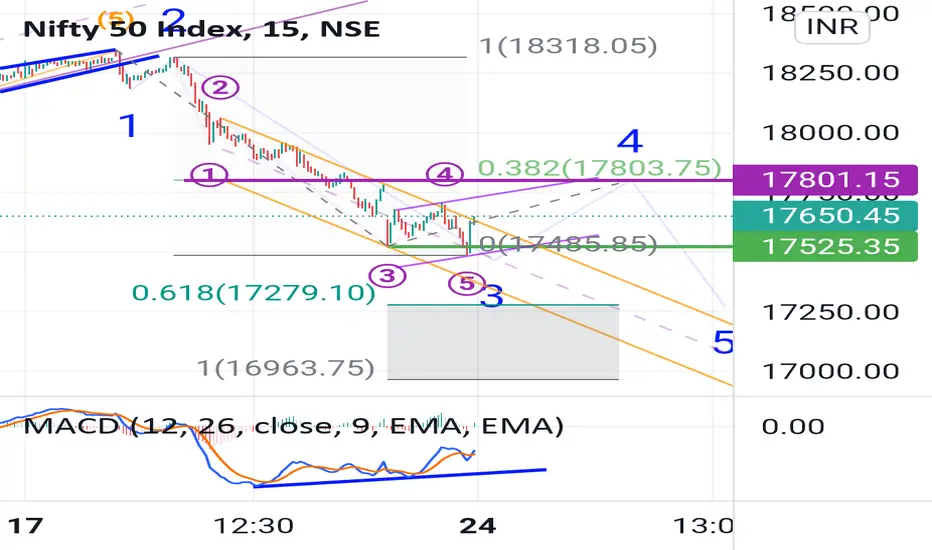
Nifty wave 4 correction to startNifty looks be in deep correction currently in 4th wave which should be flat, triangle or complex correction towards 0.382 fibonacci levels.
5th wave to start after this correction.
Alternative
DISCLAIMER:There is no guarantee of profits nor exceptions from losses.
Technical analysis provided on the chart is solely the personal views of my research.
You are advised to rely on your own judgments while taking any investing/Trading decisions.
Past performance is not an indicator of future ret
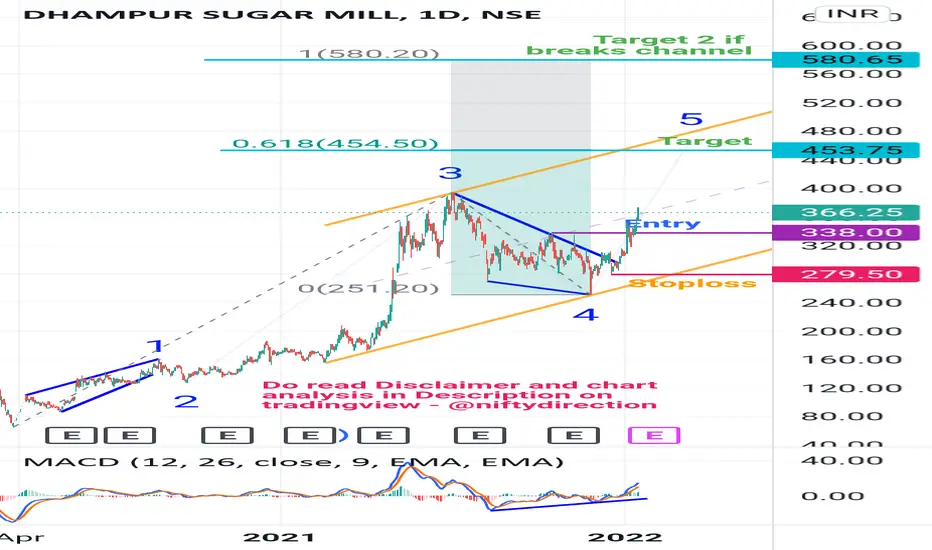
Dhampur Sugar wave 5 in progressStock looks to hgave broken out of consolidation 4th wave and started 5th wave
DISCLAIMER:There is no guarantee of profits nor exceptions from losses.
Technical analysis provided on the chart is solely the personal views of my research.
You are advised to rely on your own judgments while taking any investing/Trading decisions.
Past performance is not an indicator of future returns. Investment/trading is subject to market risks.
Seek help of your financial advisors before investing/trading.
Not
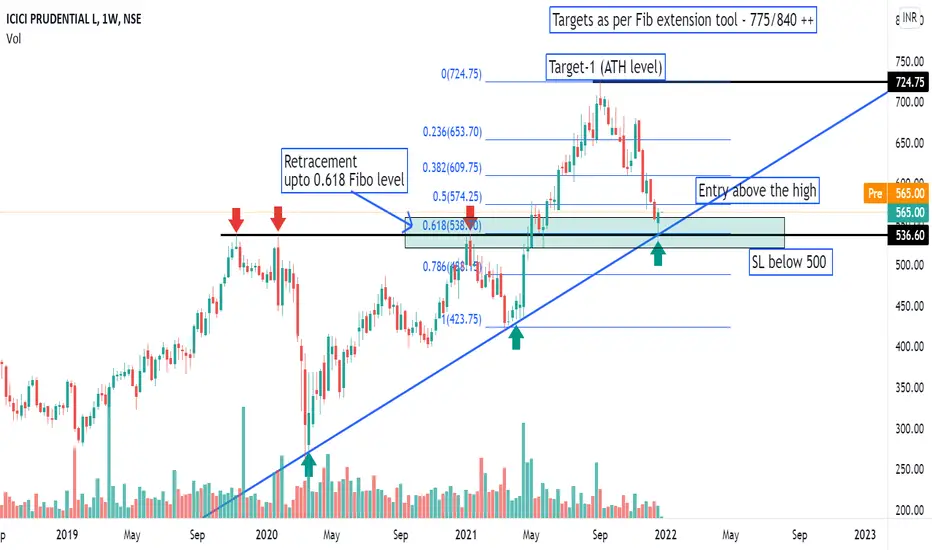
ICICIPRULI - Retest Structure + Fibo Support - Swing TradeThe analysis is done on weekly TF hence price may take few weeks to few months in order to reach the targets.
Trade setup is explained in image itself.
The above analysis is purely for educational purpose. Traders must do their own study & follow risk management before entering into any trade
Checkout my other ideas to understand how one can earn from stock markets with simple trade setups. Feel Free to comment below this or connect with me for any query or suggestion regarding this stock o
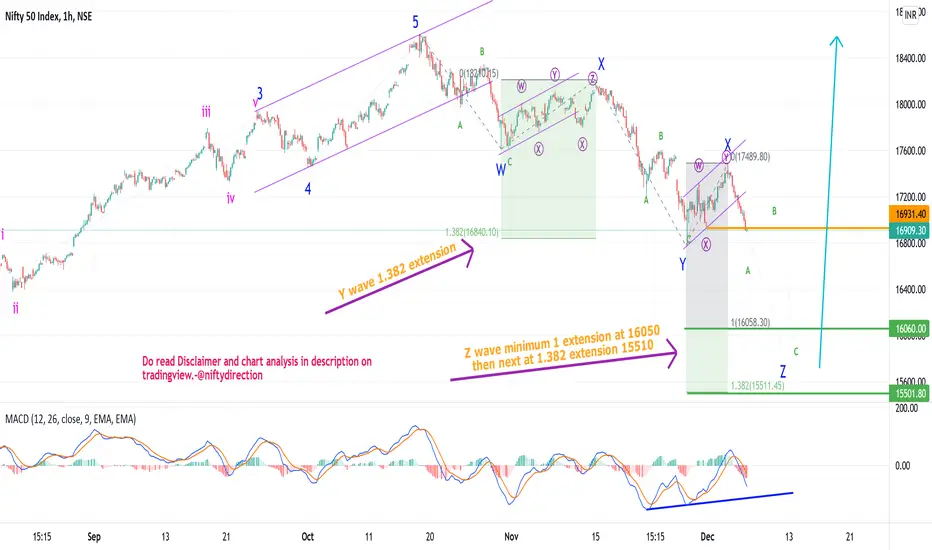
Nifty towards 16k tripple Zig Zag correction in progressAll details mentioned on the chart as per Elliott wave.
DISCLAIMER:There is no guarantee of profits nor exceptions from losses.
Technical analysis provided on the chart is solely the personal views of my research.
You are advised to rely on your own judgments while taking any investing/Trading decisions.
Past performance is not an indicator of future returns. Investment/trading is subject to market risks.
Seek help of your financial advisors before investing/trading.
Not recommended to take Fn
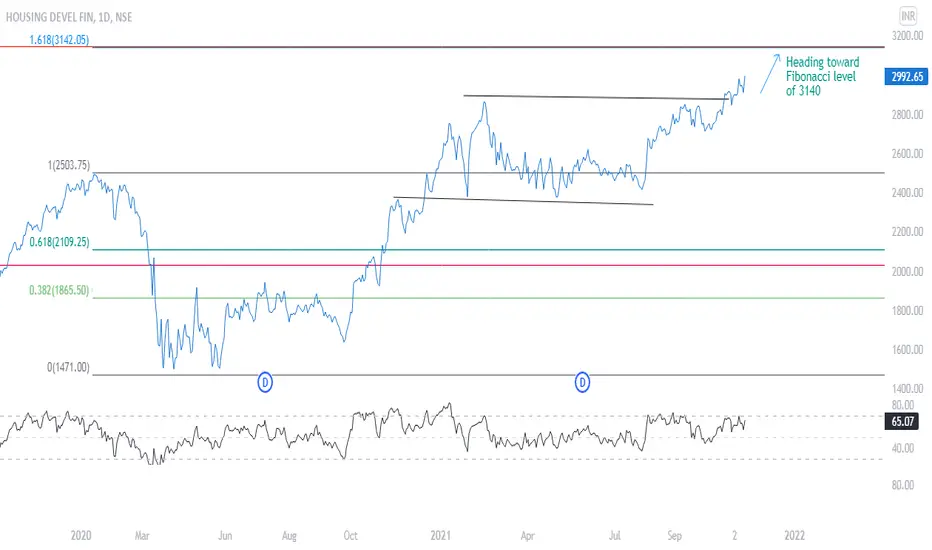
HDFC Heading toward Fibonacci levelHDFC has made a successful breakout-retest-continuation pattern out of its consolidation zone on the daily time frame. The is heading toward the next resistance zone of 3140 which is a dual Fibonacci level.
It is the 1.618 Fibonacci level of the pre-Covid high-low on the 1D time frame. It is also the 4.236 Fibonacci level on the long-term Weekly chart. We are bullish on HDFC with 3140 as target.
HLong
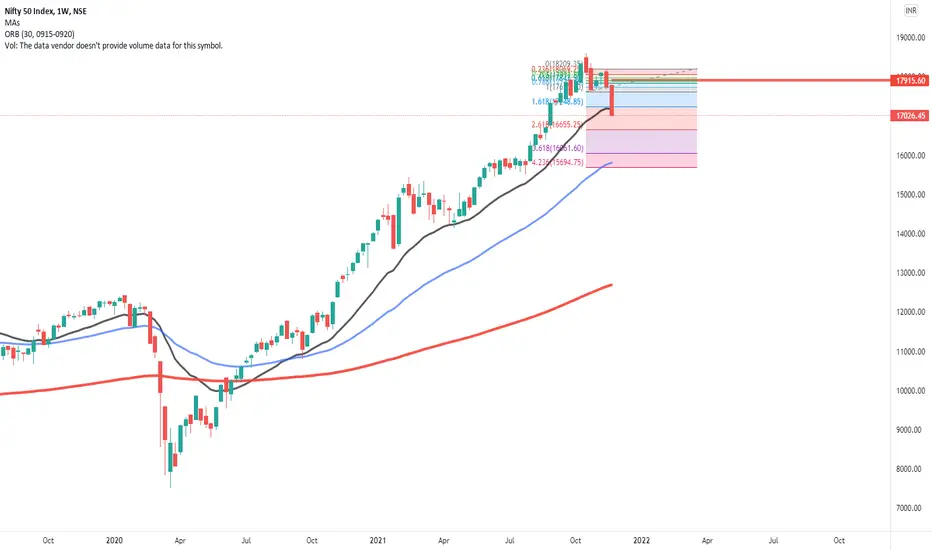
NIFTY BEARISH TARGETS
NIFTY STARTED MAKING LOWER HIGHS AND LOWER LOWS, SINCE MAKING A HIGH AROUND 18600. AS PER FIBONACCI LEVELS OF RECENT RETRACEMENT THE FUTURE TARGETS ARE AS FOLLOW
Nifty started making lower highs and lower lows since making a high around 18600, as per fibonacci levels of recent retracement the targets in coming days are as follows
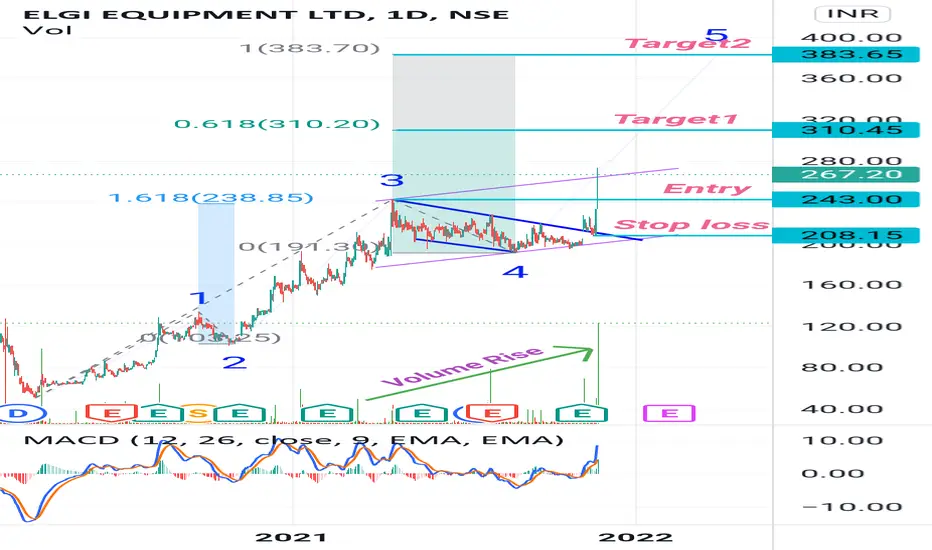
Elgi Equipments Extensions in 5th waveAll details on the chart if you get any pullback towards 250-40 zones add with nearly 15% stop loss for 25-28% target 1. Mostly it will hit target 2 as wave 3 was not extended. Also channel on wave 3-4 broken so it would be bullish.
DISCLAIMER:There is no guarantee of profits nor exceptions from losses.
Technical analysis provided on the chart is solely the personal views of my research.
You are advised to rely on your own judgments while taking any investing/Trading decisions.
Past performanc
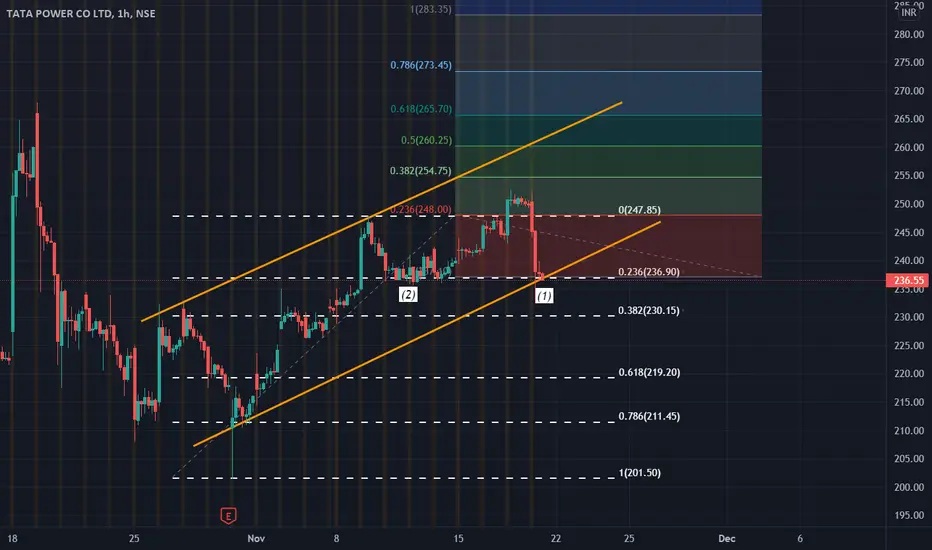
TATAPOWER Analysis 18/11/21; S&RTata Power is building support at current levels of 236-237.
At point 1, we can see a STRONG SUPPORT LEVEL (Trendline support in parallel channel as well as Fibonacci Retracement 0.236 support level.)
As we have already seen previously, TATA POWER has taken support and bounced back from these levels a few days back.
If the stock sustains and respects this strong support level, then a further upmove is expected. Levels can be seen from the colourful fibonacci extension charts. Stock has already
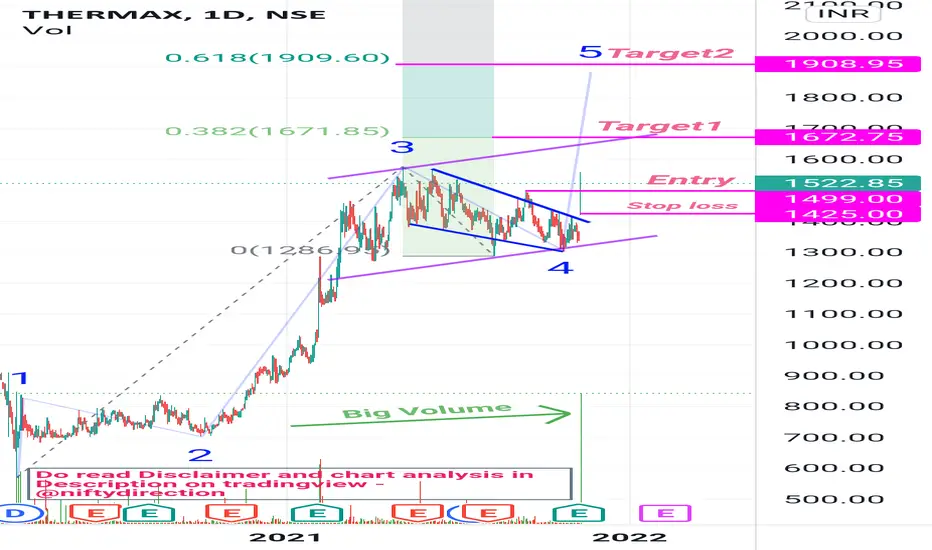
Thermax Huge Volume Wave 5 beginsThermax today came out of long consolidation and gave flag breakout.
Wave 5 is started and expecting to go towards 1900.
Other details with entry and stop loss on chart.
DISCLAIMER:There is no guarantee of profits nor exceptions from losses.
Technical analysis provided on the chart is solely the personal views of my research.
You are advised to rely on your own judgments while taking any investing/Trading decisions.
Past performance is not an indicator of future returns. Investment/trading is
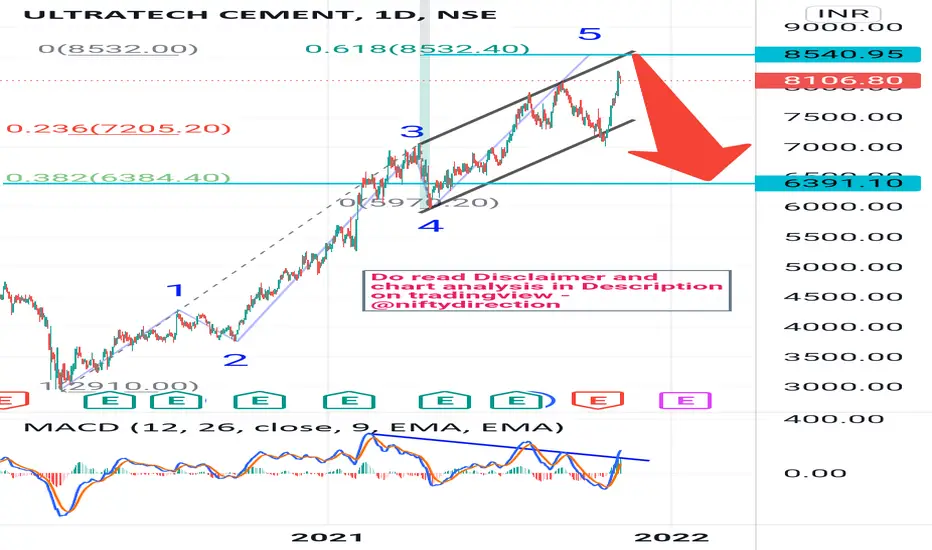
Ultratech Cement On final push then fall aheadUltratech Cement had stellar rally from 2900 to 8000+ looks to be heading max 8532 which is max possible upside for it as wave 5.
Then a corrective wave will start towards 6300 which is 0.382 fibonacci levels.
Notice MACD Negative Divergence price making higher high and MACD higher lows.
DISCLAIMER:There is no guarantee of profits nor exceptions from losses.
Technical analysis provided on the chart is solely the personal views of my research.
You are advised to rely on your own judgments whil
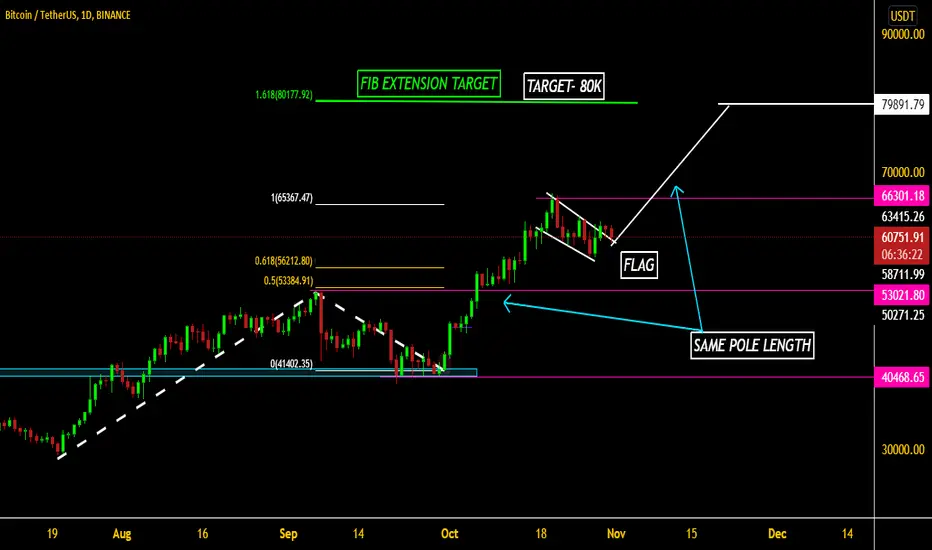
BITCOIN 80k soon : FIB Extension & Flag-Pole theory (READ CAP) Bitcoin projected targets are 80k as per both of my theories:-
1st THEORY- FLAG & POLE - Widely used Flag Pole is basically plotted to guess further targets when an asset is at ATH . Bitcoin went into consolidation and formed a slant flag after a huge rally, here the rally is considered as a pole. So we just draw a trendline from the bottom to the top of the rally till the current consolidation phase and paste the same pole ahead of the flag. Our projected target is 80k here. This is a very simp
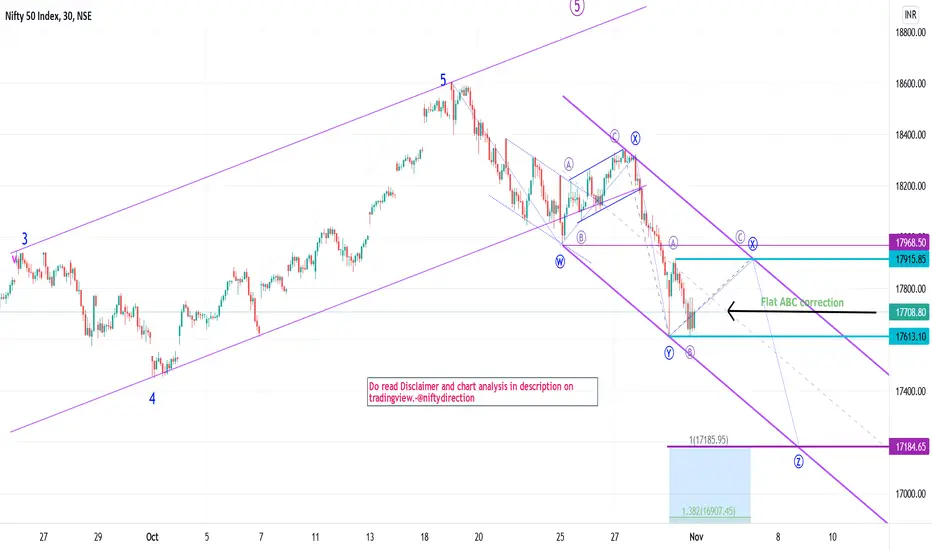
Nifty Flat Elliott Wave corretion ahead before final fallNifty after going continuously up taking breather.
Currently in triple zig-zag correction of which XX wave in progress which is expected to be flat till 17915-70 levels.
The last correction wave is suppose to end near 17180 if we consider nifty starts drop from 17915.
Z wave targets will change based on where flat ABC (or XX) end.
Off course bounce is expected on upside from 17200 odd levels
DISCLAIMER:There is no guarantee of profits nor exceptions from losses.
Technical analysis provided
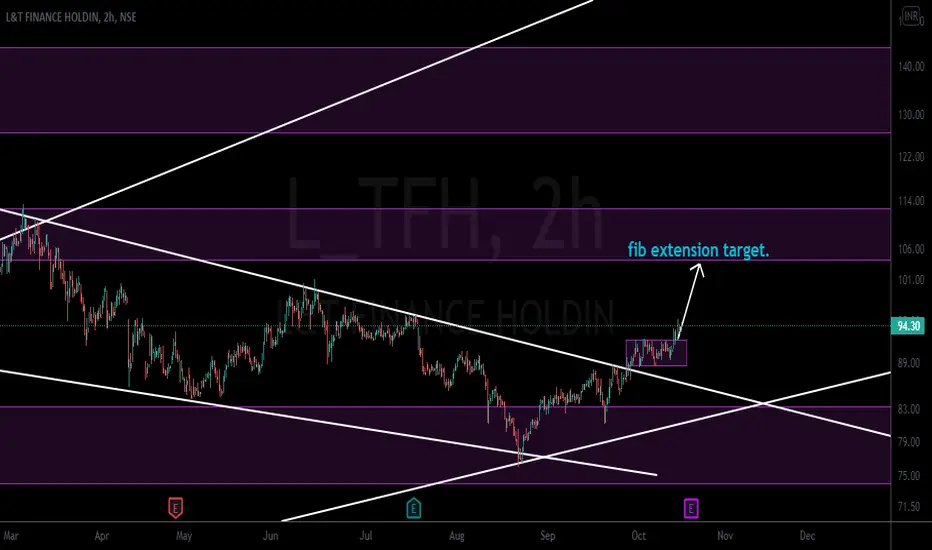
L&T FINANCEStock was in descending channel pattern for a long time and has broken it with a bullish momentum and was accumulating for few days the stock can touch to the support zone which is also a fib extension target, enter at current levels and place a stop at below the accumulation zone..
" EDUCATIONAL PURPOSE ONLY"..