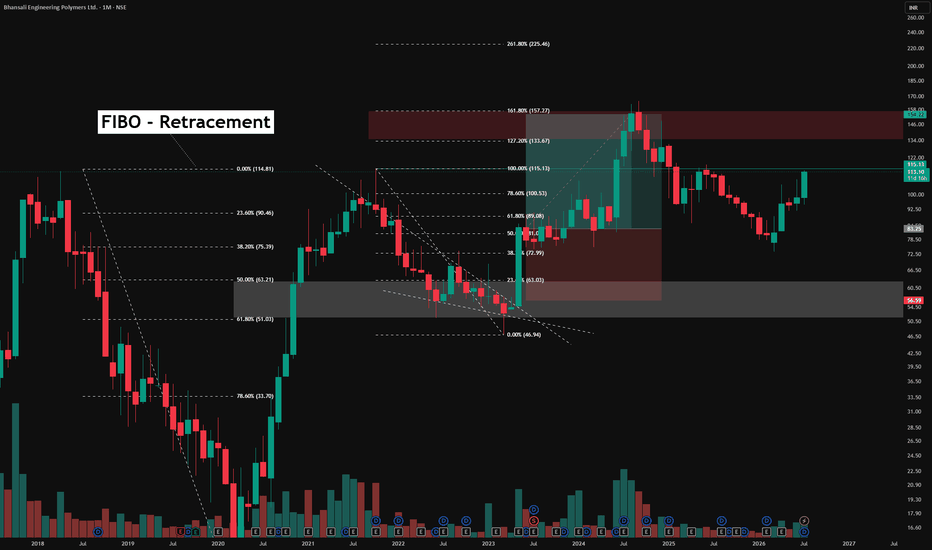
Why I Still Use Fibonacci in Market AnalysisFibonacci is one of the most debated tools in trading.
Some traders see 0.382, 0.5, and 0.618 as almost “magical” price zones. Others believe they are just numbers traders give meaning to.
In my view, both interpretations miss the point.
Fibonacci is useful not because it predicts the future, but because it helps measure the depth of a pullback and identify areas where price reaction may become important.
1. Fibonacci Is Not a Buy/Sell Button
Imagine the market is trending strongly higher
Fibonacci Retracement
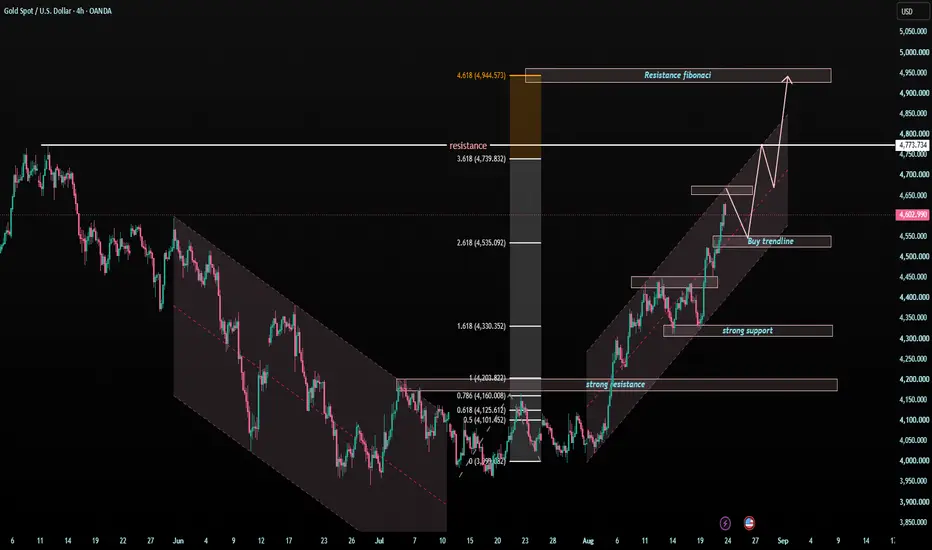
XAUUSD — 4,550 Holds, 4,945 Opens?XAUUSD — 4,550 Holds, 4,945 Opens?
Gold is now trading inside a strong bullish recovery channel after breaking away from the old bearish structure.
The market has already shifted from accumulation into expansion, and price is now holding around 4,600.
The trend is clearly bullish.
But after a strong move, the best plan is still not to chase the candle.
The simple read
Gold is currently moving above the buy trendline area.
As long as price holds above the 4,535 - 4,550 support zone, buyers
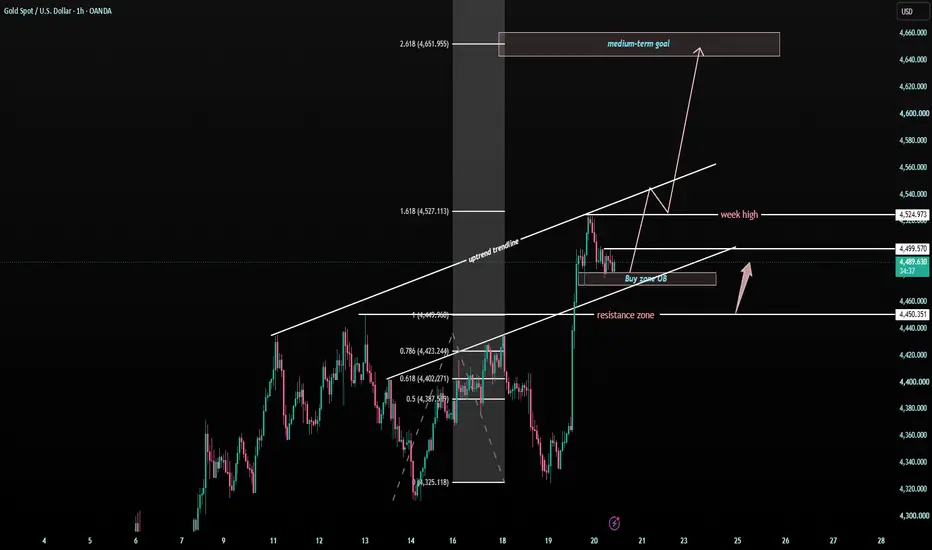
XAUUSD — 4,500 Is the Gate to 4,650?🌸 XAUUSD — 4,500 Is the Gate to 4,650?
Gold is showing a strong bullish structure after breaking above the previous resistance zone.
The market pushed sharply from the lower support area and is now trading around 4,480 - 4,500, right under the short-term breakout line.
This is where the chart becomes very interesting.
The trend is bullish.
But after a strong move, I still do not want to chase the candle.
I want to see if buyers can defend the new structure.
The simple read
4,500 is the f
XAUUSD (H1) | Gold Coils Below $4,080 Resistance
Weekly Close Shakeout or Pre-FOMC Bear Trap?
The Gold market (XAUUSD) enters a highly anticipated Friday session under tight technical compression as market participants prepare for the upcoming weekly close. With the crucial US Federal Reserve policy decision looming next week, institutional desks (Smart Money) are actively de-risking and rebalancing positions.
Fundamentally, the intraday order flow is guided by automated trading algorithms capitalizing on pre-FOMC positioning. As broader m
XAUUSD — Bearish Continuation Toward Fibonacci Target
Fundamental Analysis
Gold remains sensitive to USD momentum, Treasury yields, and upcoming U.S. macro data. For next week, the technical bias still leans bearish while price stays below the major descending structure.
Technical Analysis
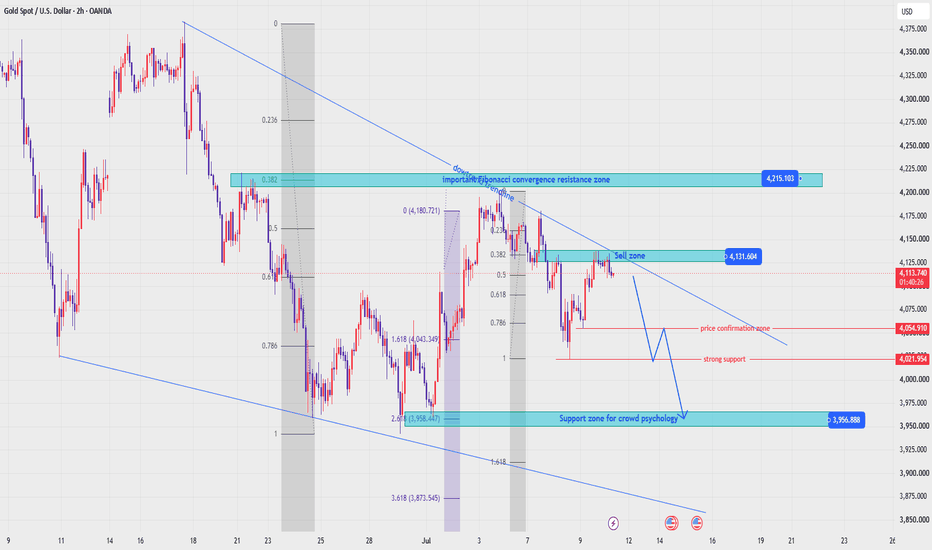
On the 4H chart, XAUUSD is trading around 4,017 after losing momentum under the downtrend trendline. The nearest sell reaction zone is around 4,050 - 4,070, where price may retest the Fibonacci sell area before another downside move. If this zone rejects price
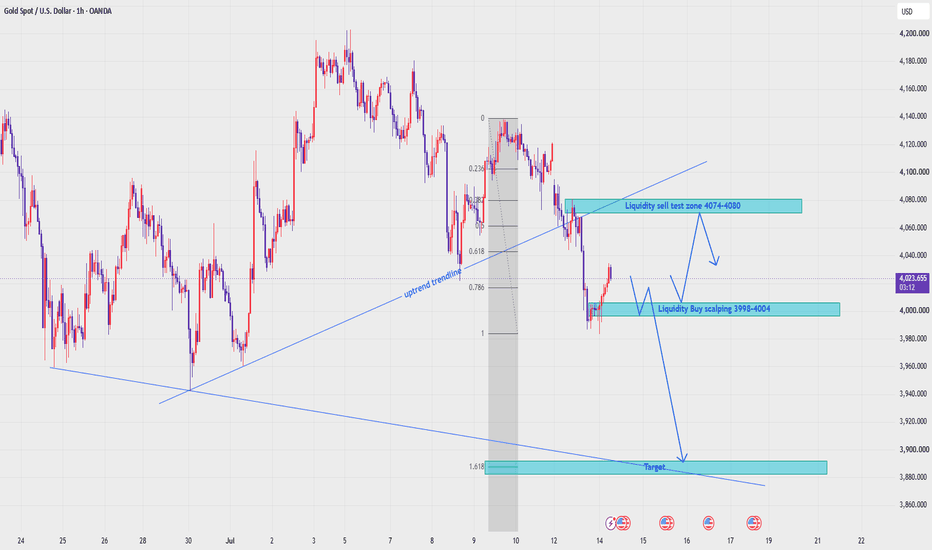
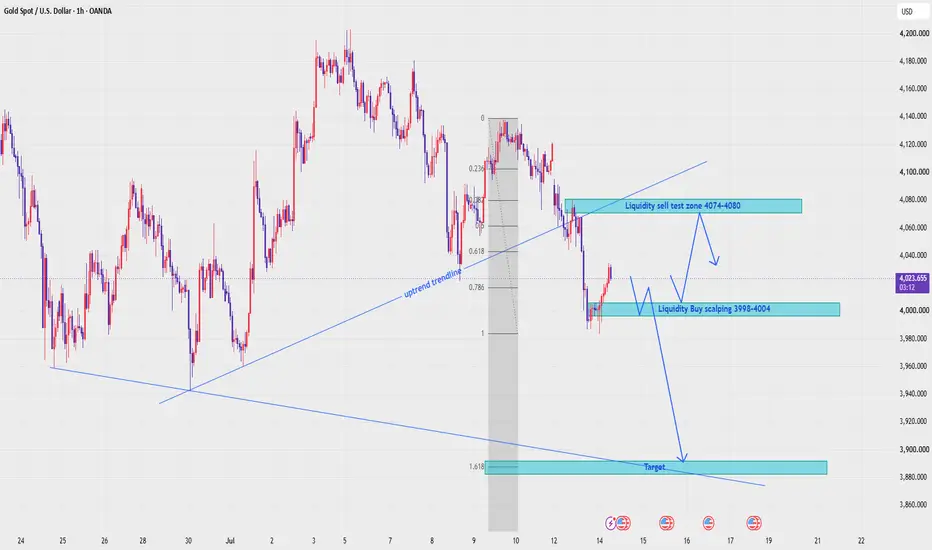
XAUUSD — Bearish Pressure Below Liquidity Sell Zone
Fundamental Analysis
Gold remains sensitive to USD momentum, Treasury yields, and upcoming U.S. macro data. For now, the market is still showing defensive price action, with sellers controlling the structure after price failed to hold above the previous trendline.
Technical Analysis
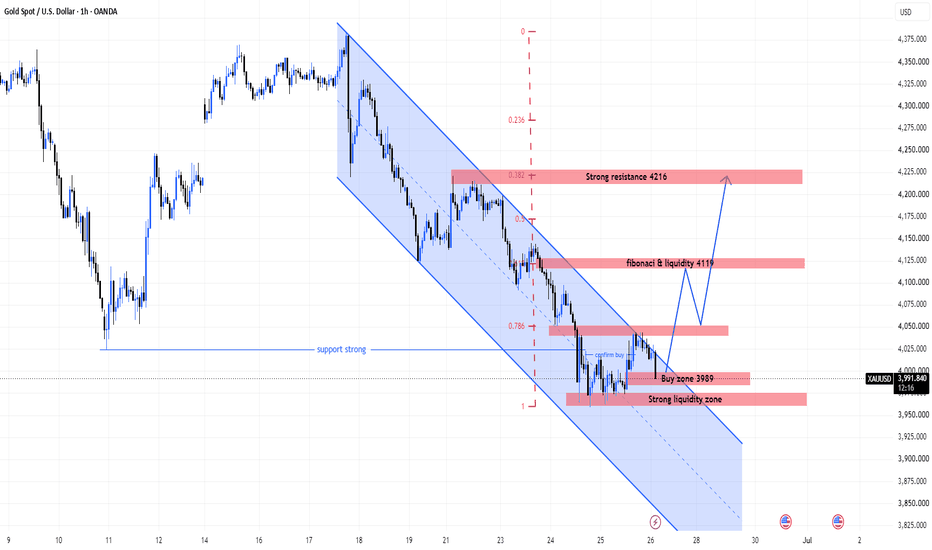
On the 1H chart, XAUUSD is trading around 4,026 after breaking below the short-term uptrend structure. The nearest reaction area is the liquidity buy scalping zone at 3,998 - 4,004, where price may create a short b
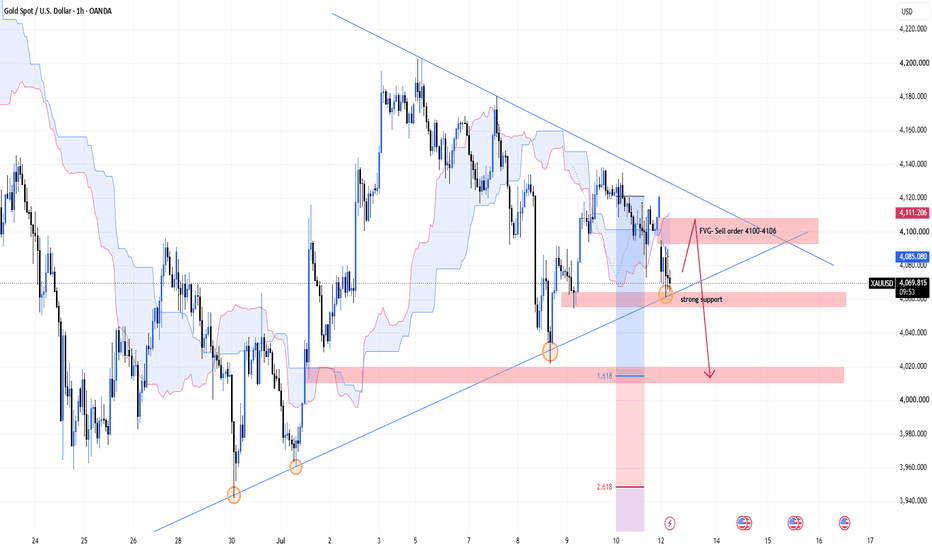
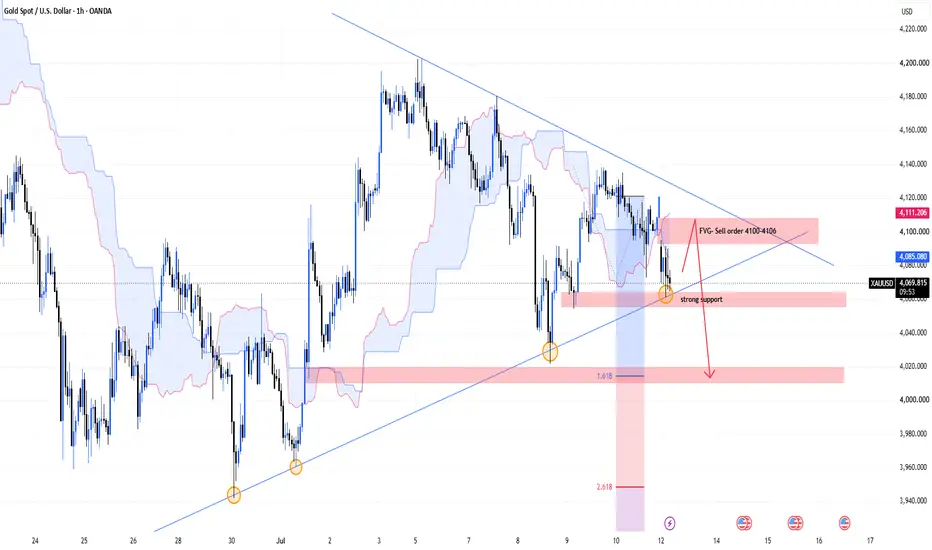
MASON XAUUSD – Trendline Break May Target FibonacciXAUUSD is trading around 4,071 after losing short-term recovery momentum near the Ichimoku structure. Price is now testing the rising trendline support, and the early-week focus is on whether gold can hold this structure or break lower.
The priority view is bearish if gold breaks below the trendline and strong support area. A clean breakdown may open the way toward the Fibonacci extension targets.
Technical View
Gold is currently moving inside a tightening structure between the descending resi
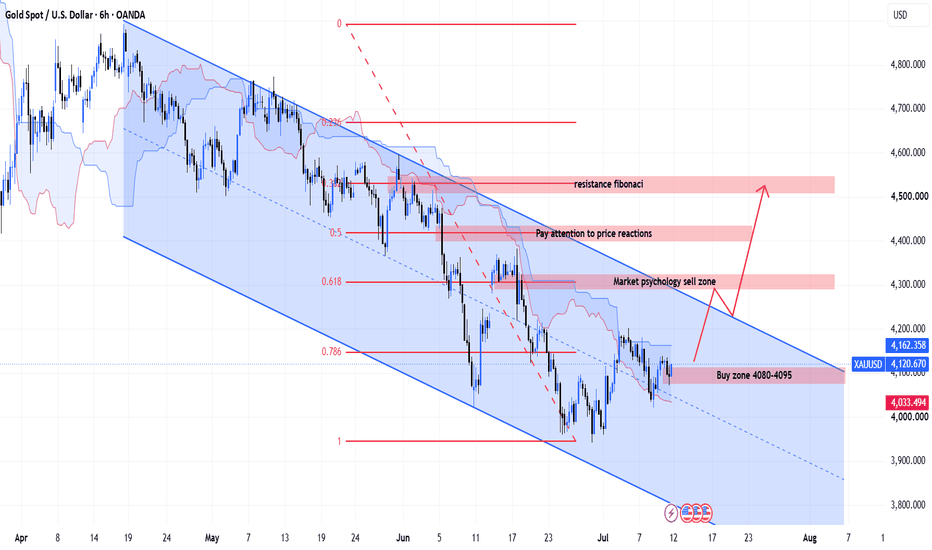
MASON XAUUSD – Accumulation Inside Bearish Channel
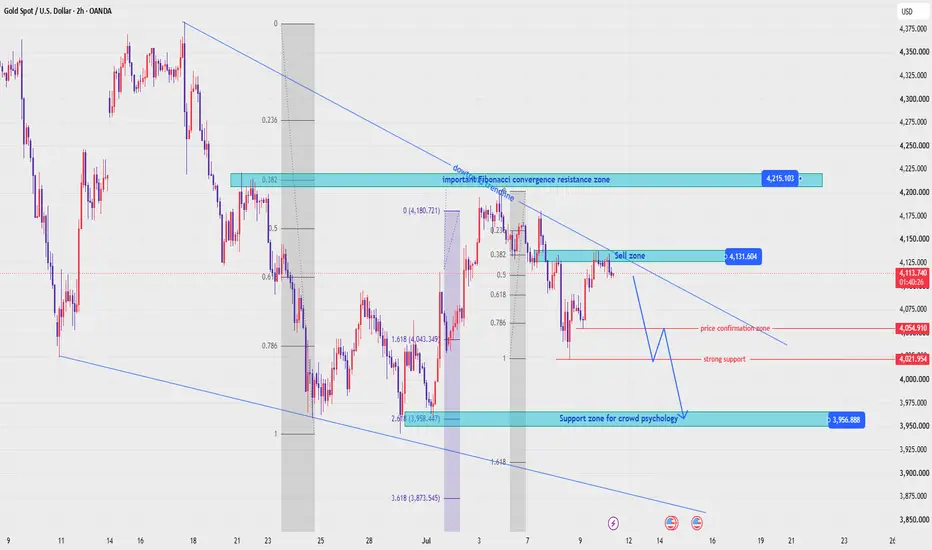
XAUUSD is trading around 4,120 while still moving inside the medium-term descending channel. Although the broader structure has not fully broken out yet, gold is showing strong accumulation around the lower-middle area of the channel.
The priority view is that gold may continue building a base above the 4,080–4,095 buy zone before attempting a stronger medium-term recovery toward the upper resistance zones.
Technical View
Gold is still inside a bearish price channel on the 6H structure. The
XAUUSD — Bullish Channel Holds Above Buy Zone
Fundamental Analysis
Gold is still reacting to USD momentum, Treasury yields, and upcoming U.S. macro data. For now, the short-term structure remains positive while price continues to hold inside the rising channel.
Technical Analysis
On the 2H chart, XAUUSD is trading around 4,142 and still respecting the bullish channel structure. The main buy order trendline zone is around 4,141 - 4,143. If price holds this area, buyers may continue to defend the trend and push gold toward the liquidity zo
XAUUSD — Sell From Fibonacci Value Zone With EMA TrendXAUUSD — Sell From Fibonacci Value Zone With EMA Trend
Fundamental Analysis
Gold remains under pressure as traders continue to watch USD strength, Treasury yields, and upcoming U.S. macro data.
For now, the technical structure still favours sellers while price trades below the main EMA resistance area. Any recovery should be treated as a pullback unless gold can reclaim the EMA value zone with strong confirmation.
Technical Analysis
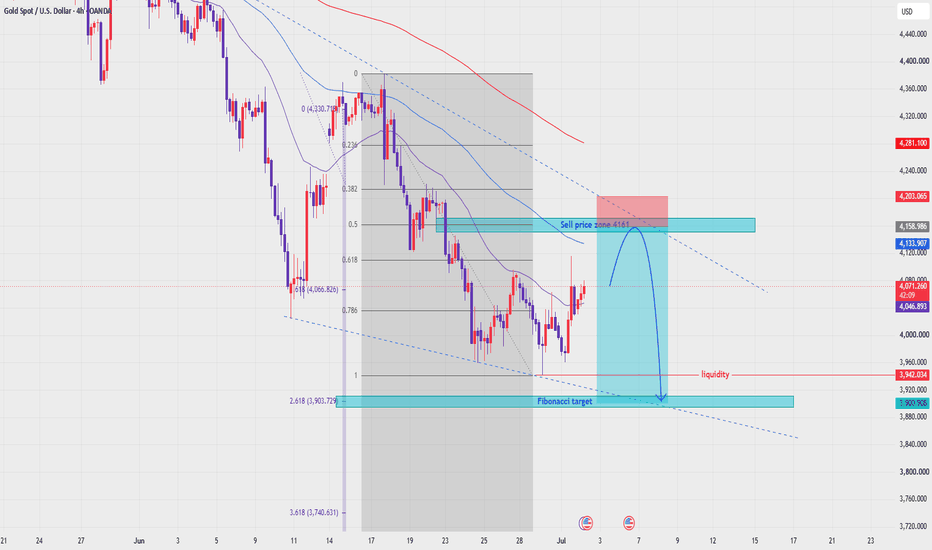
On the 4H chart, XAUUSD is still moving inside a bearish s
MASON XAUUSD – Trendline Break Confirms Bullish Recovery
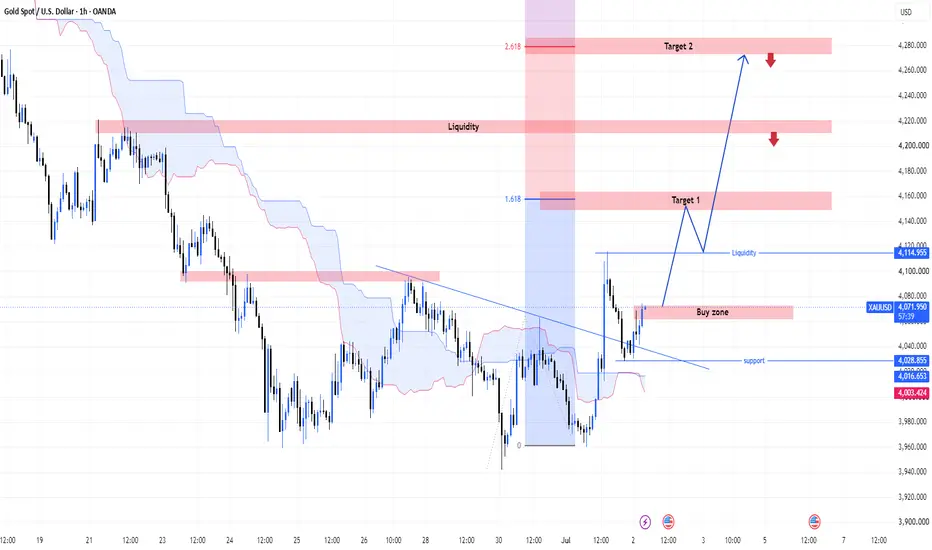
XAUUSD is trading around 4,070 after breaking above the descending trendline and recovering above the Ichimoku structure. This breakout changes the short-term structure from bearish pressure into a bullish recovery phase.
The priority view is buy on pullback, as long as gold continues to hold above the broken trendline and the nearest support zone.
Technical View
Gold has broken above the descending trendline that previously capped the upside move. This is an important shift because the mark
XAUUSD — Medium-Term Bearish Shift Below EMA Structure
Fundamental Analysis
Gold remains under pressure as the market continues to watch USD momentum, Treasury yields, and upcoming U.S. macro data.
For now, the medium-term structure is weakening. As long as gold trades below the main EMA area, recovery attempts should be treated as technical pullbacks rather than a full bullish reversal.
Technical Analysis
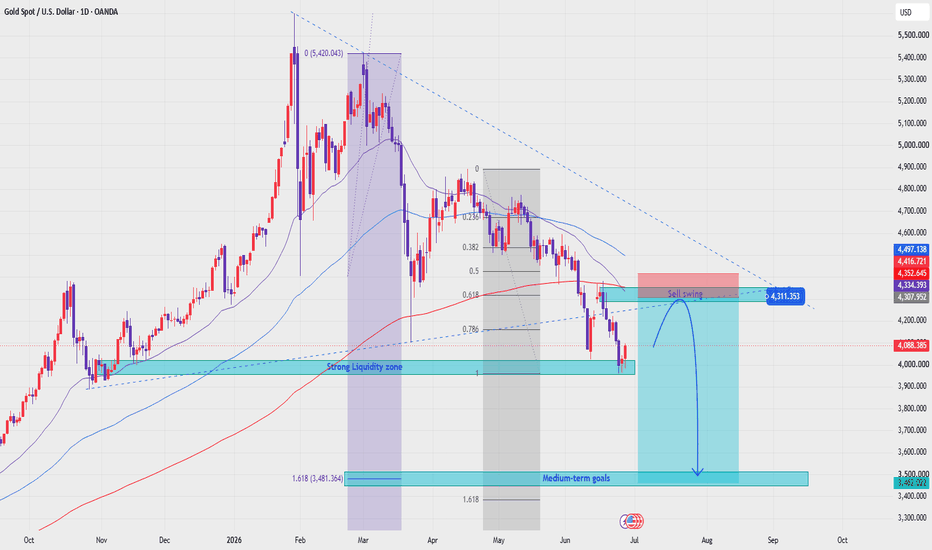
On the daily chart, XAUUSD is showing a clear medium-term bearish shift. After failing to hold the higher structure near the previous swing
MASON XAUUSD – Important Rebound Zone AheadMASON XAUUSD – Gold May Rebound Toward Fibonacci Before Next Decision
XAUUSD is trading around 3,997 after a strong bearish move inside the descending channel. Price remains below the Ichimoku cloud, so the main structure is still bearish.
However, gold is reacting near the strong liquidity zone and buy area around 3,960–3,990, so a short corrective rebound may appear before the next trend confirmation.
Technical View
Gold is still moving inside a clear bearish channel. The market has been cr
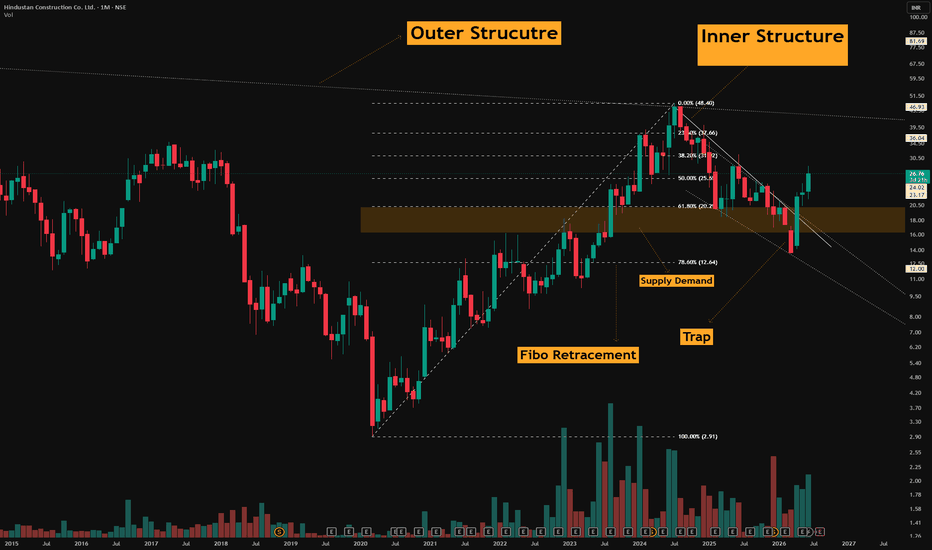
Reading Between the Tools: Fibonacci, Flip Zones and moreFibonacci Retracement
A tool that measures key levels (like 38.2%, 50%, 61.8%) between a significant high and low to identify where price may pause, react, or reverse during a pullback. It doesn't predict direction — it simply highlights mathematically significant zones traders watch.
Orange Zone — Supply/Demand Conversion
This marks a major flip zone, where a level that once acted as supply (resistance) has converted into demand (support), or vice versa. These zones often carry weight becau
The Psychology Behind FibonacciAsk ten traders how they identify potential reversal zones, and chances are several of them will mention the Fibonacci Retracement tool.
Whether they trade stocks, forex, cryptocurrencies, or commodities, Fibonacci levels appear on charts across every financial market.
This naturally raises an interesting question.
Why do Fibonacci levels seem to work?
Is there something magical about the numbers?
Or is something else happening beneath the surface?
The truth is that Fibonacci is less abo
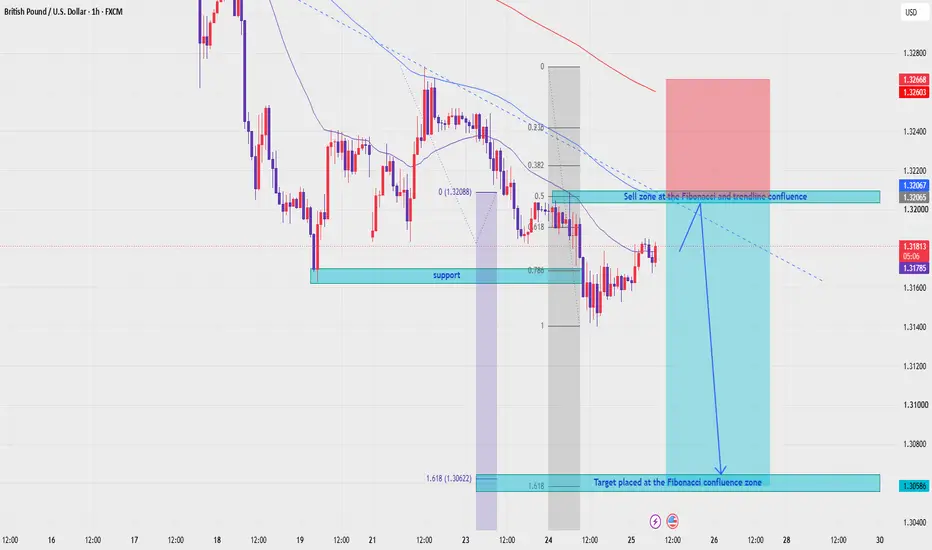
GBPUSD — EMA Bearish Trend, Sell From Fibonacci Confluence
Fundamental Analysis
GBPUSD remains under pressure as traders continue to watch USD momentum, U.K. data, and broader market risk sentiment.
For now, the technical structure still favours sellers while price trades below the main EMA range. Any recovery should be treated as a corrective pullback unless GBPUSD can reclaim the key resistance zone with strong confirmation.
Technical Analysis
On the 1H chart, GBPUSD is still trading below EMA 34, EMA 89, and EMA 200. This confirms that the shor
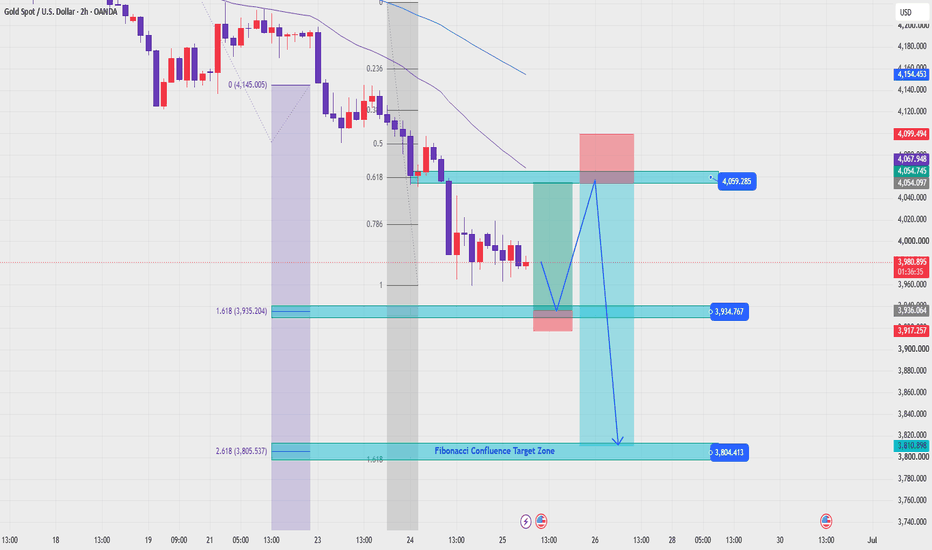
XAUUSD — EMA Bearish Trend, Fibonacci Confluence Target in Focus
Fundamental Analysis
Gold remains under pressure as price continues to trade below the main EMA structure. Traders are still watching USD momentum, Treasury yields, and upcoming U.S. macro data.
For now, the technical structure still favours sellers while recovery attempts remain weak below EMA resistance.
Technical Analysis
On the 2H chart, XAUUSD is trading below EMA 34, EMA 89, and EMA 200. This confirms that the short-term trend remains bearish, with the EMA structure acting as dynamic
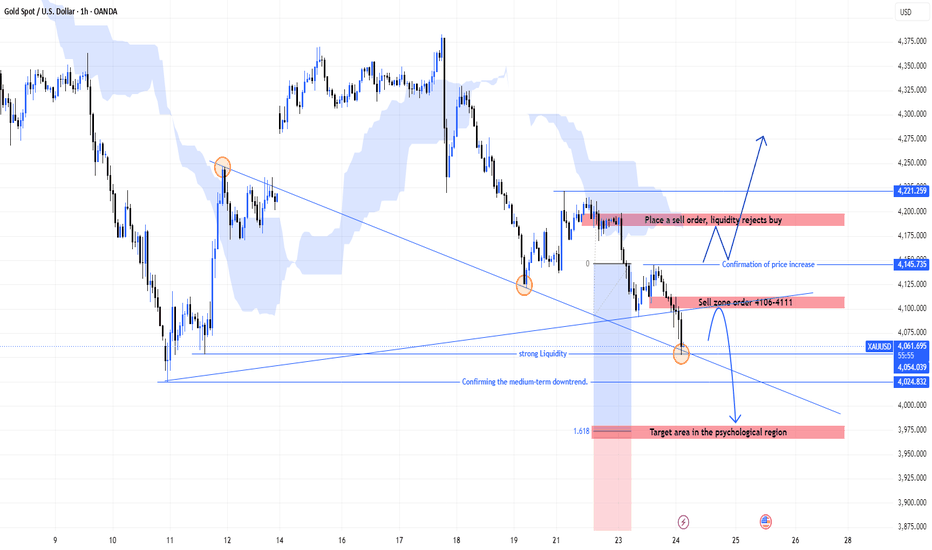
MASON XAUUSD – Downtrend Still Dominates, Rebound Is Secondary
XAUUSD is trading around 4,062 after another strong bearish move. Price remains below the Ichimoku cloud and below the broken trendline, so the main structure is still bearish.
The primary view is sell continuation, while the secondary scenario is a short technical rebound before the next confirmation.
Technical View
Gold is still moving under clear bearish pressure after breaking the previous trendline support. The latest reaction around 4,054 shows that price is testing a strong liquidity
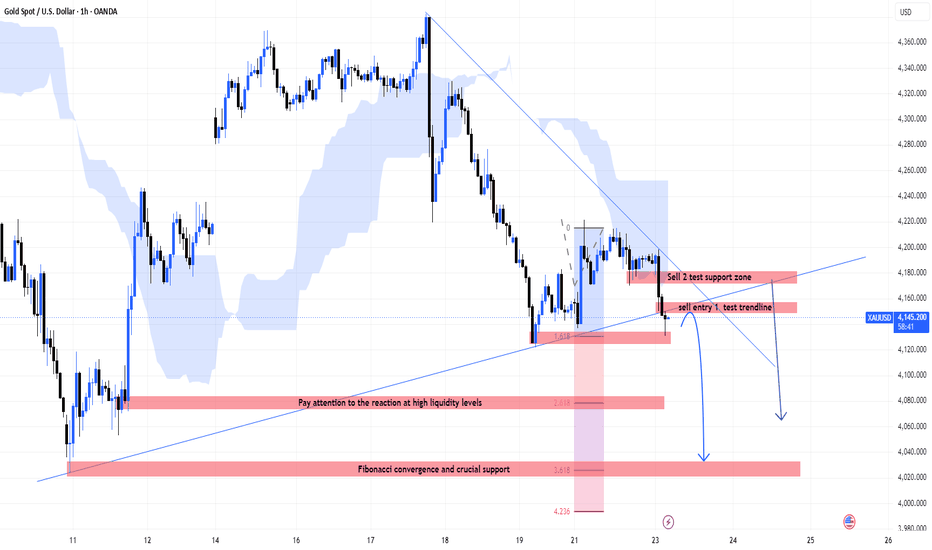
MASON XAUUSD – Gold Breaks Trendline, Sell Continuation In Focus
XAUUSD is trading around 4,140 after a strong bearish move. Price has broken below the short-term rising trendline and remains below the Ichimoku cloud, showing that sellers are still controlling the structure.
The main view is sell continuation, especially if price retests the broken trendline or previous support zones.
Technical View
Gold has broken the rising trendline that previously supported the recovery wave. This is an important signal because the market is no longer respecting the s
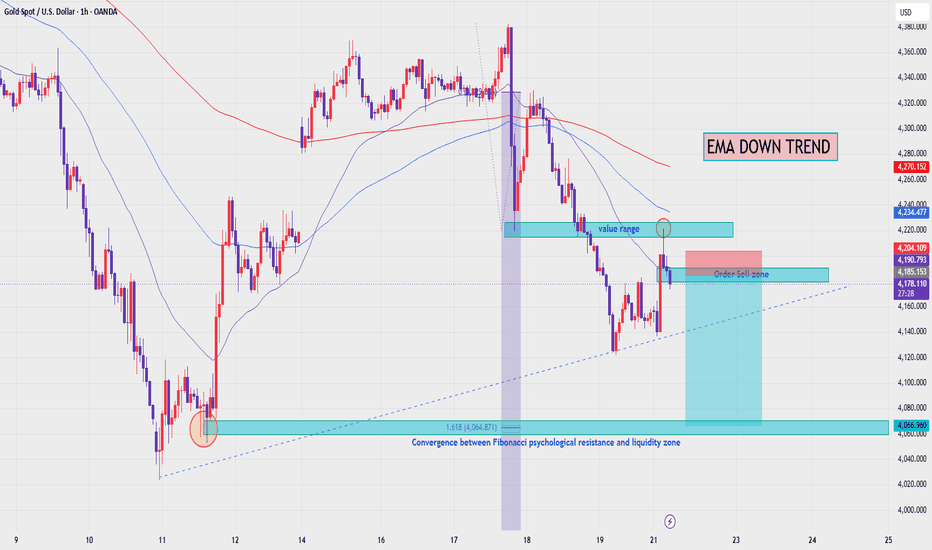
XAUUSD — EMA Downtrend Holds, Sell Position Remains Active
Fundamental Analysis
Gold remains under pressure as price continues to trade below the main EMA structure. Traders are still watching USD strength, Treasury yields, and upcoming U.S. macro data.
For now, the technical structure still favours sellers while recovery attempts are rejected from the value sell zone.
Technical Analysis
On the 1H chart, XAUUSD is trading below EMA 34, EMA 89, and EMA 200. The EMA structure is still pointing lower, showing that the short-term trend remains bearish
Fibonacci: Nature Wrote These Levels. Markets Obey ThemFibonacci: Nature Wrote These Levels 800 Years Ago. Markets Have Been Obeying Them Ever Since.
The same mathematical ratio that governs sunflowers, seashells, and galaxies also governs how far stock prices pull back before continuing. This is not a coincidence.
In the 13th century, an Italian mathematician named Leonardo Fibonacci described a number sequence: 1, 1, 2, 3, 5, 8, 13, 21, 34, 55, 89... Each number is the sum of the two before it. And the ratio between consecutive numbers approa
EURUSD — Bearish Continuation From Fibonacci Value Zones
Fundamental Analysis
EURUSD remains under pressure as price trades below the main EMA structure. For next week, traders should continue watching USD momentum, Fed expectations, and upcoming U.S. data, as these factors may drive volatility around key Fibonacci zones.
For now, the technical structure still favours sellers while recovery attempts remain capped below EMA resistance.
Technical Analysis
On the 4H chart, EURUSD is still moving inside a descending structure. EMA 34, EMA 89, and EM
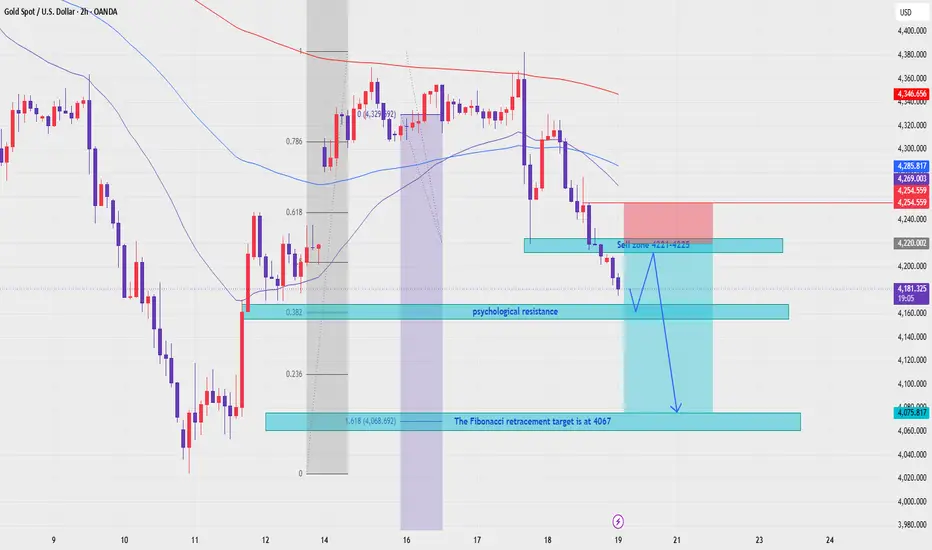
XAUUSD — EMA Bearish Trend, Fibonacci Target in Focus
Fundamental Analysis
Gold remains under pressure as traders continue to watch USD strength, Treasury yields, and upcoming U.S. macro data.
For now, the structure still favours sellers while XAUUSD trades below the main EMA range. Any recovery should be treated as a technical pullback unless price can reclaim the EMA resistance zone with strong confirmation.
Technical Analysis
On the 2H chart, XAUUSD is trading below EMA 34, EMA 89, and EMA 200. This confirms that the current trend remains