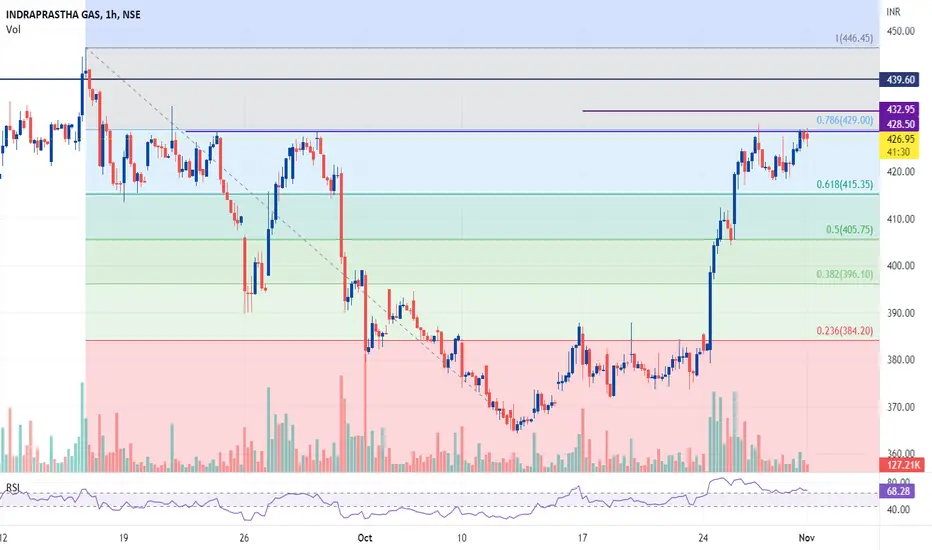
Fibonacci Retracement
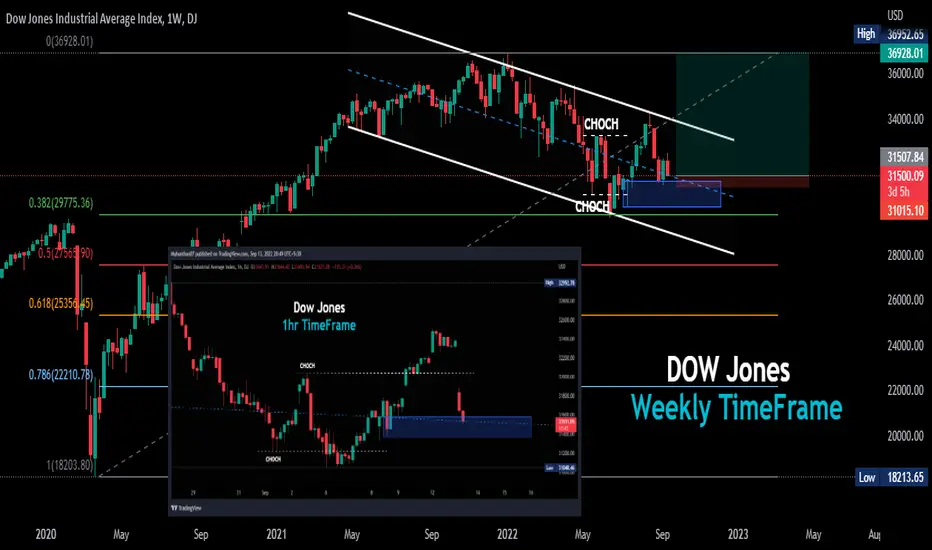
Dow jones Can resume his down trend ?Dow jones:- As per chart it is trading in down trend. Now reach to upper most potential resistance Zone 32400-32800. yesterday a inverted hammer candle come which is sign of rejection or reversal.
It may be correct quickly 1000-1500 in 2-3 days and also more pain come on chart soon. Nifty and B-nifty also feel pressure from global cues.
IBREALEST IS AT SUPPORT LINE WE EXCEPT 15-40% ROI📈🔥🔥Ibrealest At Suport Stock Shall Bonus Back With 15-40% Roi .
Follow For More !
ILong
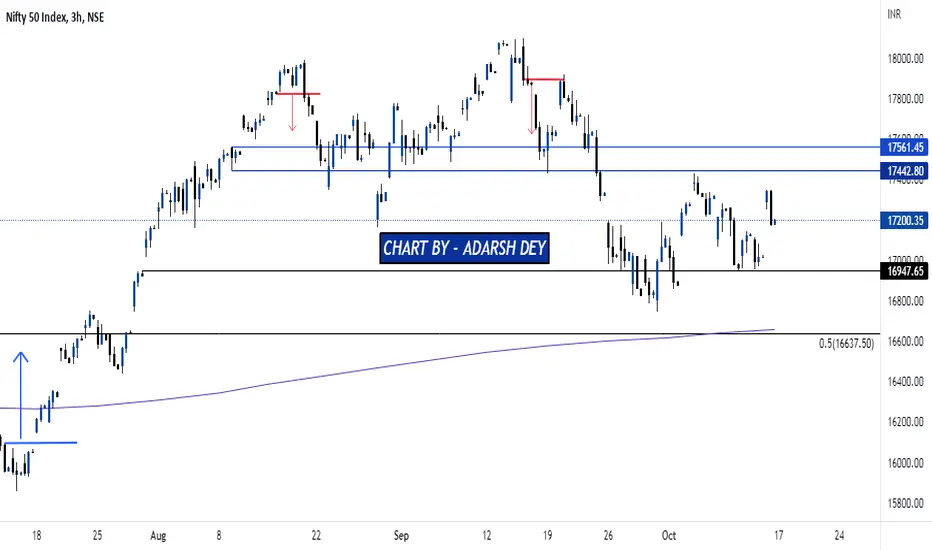
NIFTY OUTLOOKIn the Previous Nifty Outlook, I mentioned on 13th or 14th Oct, the low will be formed before a good bounce that is expected to be made. Nifty made a low on 13th and gave a huge Gap up on 14th.. And previously the support level were 17081 incase of the gap down of 10th Oct and once if it breaks gradually the next support was 16900. Nifty made huge gap down on 10th Oct and a low at 17064.70, Just 15 points from the mentioned level and rallied perfectly on Intraday Basis. And during the entire we
SBI Card SHORT - So Wave E high did not get taken out all this while even though, hence Setup still valid
- A 5 wave Fall (Wave i) on Hourly Charts can be Counted from Wave E high
- A 3 Wave Corrective Rise (Wave ii) in the form of an Expanded Flat retraced 0.618% of the Fall from Wave E high
- Price did Wave i and then ii, and now iii on Downside has Started📉
Wave i= Wave iii equality comes at ~ 845🎯
Trade Plan as follows:
Short at CMP= 915.5
Downside Target Zone= 850 - 840
Stop Loss= above 940
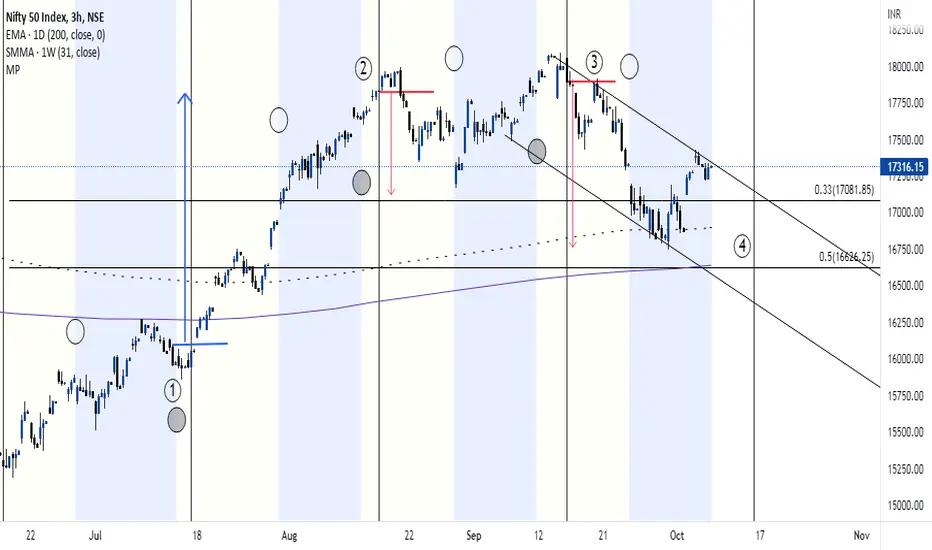
NIFTY OUTLOOKThis is a 180 Min TF NIFTY chart. By the end of this post we would try to understand the short term trend and the trade setup for the next week. An update on daily basis will be given in the update idea section.
- TIME CYCLE:
If we study the time cycle starting at 17 June 2022. I have adjusted the cycles at certain TF for better adjustment. We can observe the low made at point 1 and the breakout lead to a good up move. And vice a versa was seen at point 2 and 3. Accordingly the low before a goo
NIFTY: OCTOBER ANALYSISHi all 👋 this is my current take on Nifty.
✅Nifty failed to break out of the resistance line, which I have stretched from October 2021 highs, at two occasions, that is in August and September 2022. There was a breakout of the 18000 level but this break failed near April 2022 swing highs. Thereafter, Nifty had a vertical reaction in September.
✅This reaction has been holding near a prior key resistance area of 16800. As we always say that a prior strong resistance area once taken out may act as
'SWING' your losses into profits with 'SWING' trading strategiesIn prior posts, we have covered some great teachings about the market and,
in this post, we will elaborately cover the swing trading strategies. Let's start !!
->Definition of swing trading -: Swing trading is generally referred to as a trade carried out for a short time. Swing traders do not wait
till the price action opposes their direction, they are known for their prior moves.
They are good at identifying the shifts in market trends with the help of various techniques which are explained
Granules long opportunityNSE:GRANULES
Stock -> Granules
TimeFrame -> Weekly
Hello all!
Granules has been forming a flag and pole pattern.
It finally broke out of the flag in the last week of September with heavy volumes and I believe this generates a good opportunity to go long!
There are multiple other factors that strengthen my conviction on going long
-The stock is taking support from its 50-week EMA
-Stock has support from both 50 and 200-day EMA
-Flag breakout occurred after a strong bounceback from the Fibonacc
Ambuja Cement giving a break down of Head and Shoulder.The stock has given a nice break down of the Head and shoulder pattern.
The markets are in the negative and the stock has given 40% (approx) returns in 30-35 days time.
Stock has broken the neck line of the of the pattern and closed below it.
The stock has closed below its 50% Fibonnaci levels.
Wait for the stock to retest the price level of the neck line and watch for the price action near the levels for shorting the stock.
The targets and Stop loss are mentioned in the chart.
An intraday
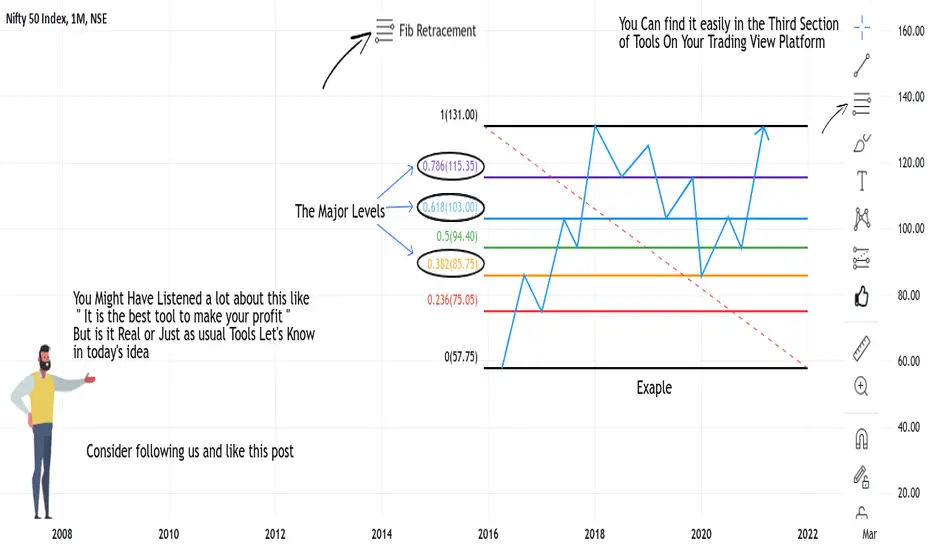
You Might Have Heard A Lot About This Hey Everyone,
Today we are again with a lot of information and a bunch of topics, so consider following us for regular ideas and market updates
Let's go Strictly into the idea
So What is a Fib Retracement ?
Now You might think it is just making lines and deciding on support or resistance but it's way too far, as shown in the thumbnail " The Major Levels " it means the levels that can be a support or resistance and can be found easily as shown.
So Now we have learned What is Fibonacci Retrace
Banknifty Possible move on 26/9/2022After forming double top on 20th Sep, Bank Nifty on hourly time frame is likely to continue its downward trend till its support region of 38500.
There is also likelihood of it retracing it 40000 levels and then continue it journey downwards.
Rest I think chart is pretty self explanatory.
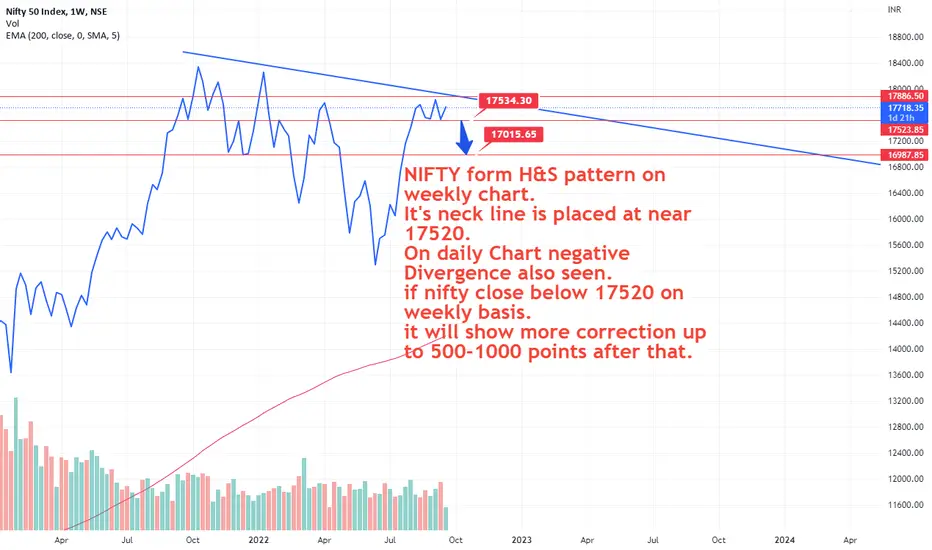
Multidimensional Nifty Analysis !!!Due to the strong bearish candle on Friday's session, the Nifty has formed a bearish engulfing candle
on weekly charts which indicates exhaustion of the uptrend. Is this so? let's take a multidimensional view
Nifty has passed below 20DEMA above which it was taking support in last few days
which is a sign of weakness and a signal of strength exhaustion.
Nifty has also formed a double top along with RSI divergence which further is a bearish signal
though the pattern isn't confirmed as a bre