Fibonacci Retracement
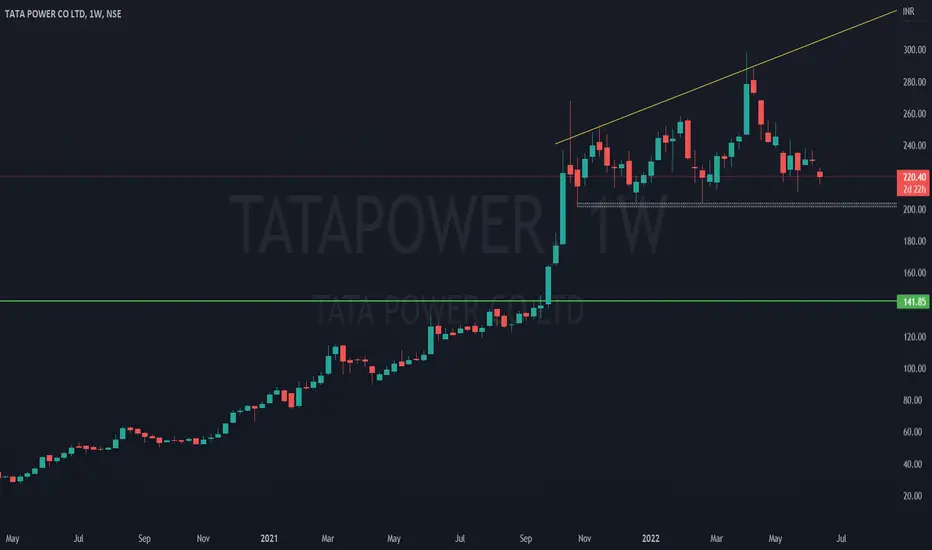
TATA POWER BEARISH DIVERGENCEThere's a clear indication of bearish divergence in this script as we can see here Price is making Higher Highs and the RSI is making lower Highs.
Also, there's a retracement pending after the 10-year breakout of the price from 2008-2010 Highs.
We can see 160 levels in the coming months for this script.
This analysis is purely for educational purposes!!!
Please do your due diligence before investing or trading in any instrument.
Nifty AnalysisNifty is currently taking support from previous week high which is near 16400 and a break below this can take nifty to 16200 which is the last support for the index post this we can see nifty at 15900-15800. On the upside resistance is at 16970 & 17200 which are also near Fibonacci levels of 0.5% & 0.618%
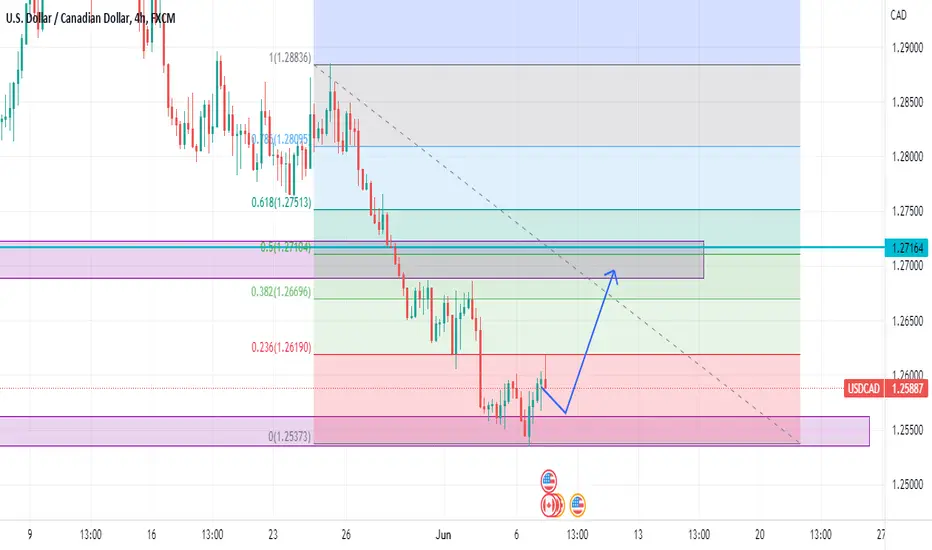
What is Fibonacci retracement?If you have been in the market for some time, you may have heard of “Fibonacci retracements” . Today we are going to share an informative write-up along with a few exhibits that may help you solidify your understanding of this concept.
Table of Contents:
1. What are Fibonacci levels?
2. What is the significance of retracement levels?
3. How to find retracement levels?
4. How to use the retracement levels?
Without further ado, let’s jump in!
What are Fibonacci Retracement levels?
Th
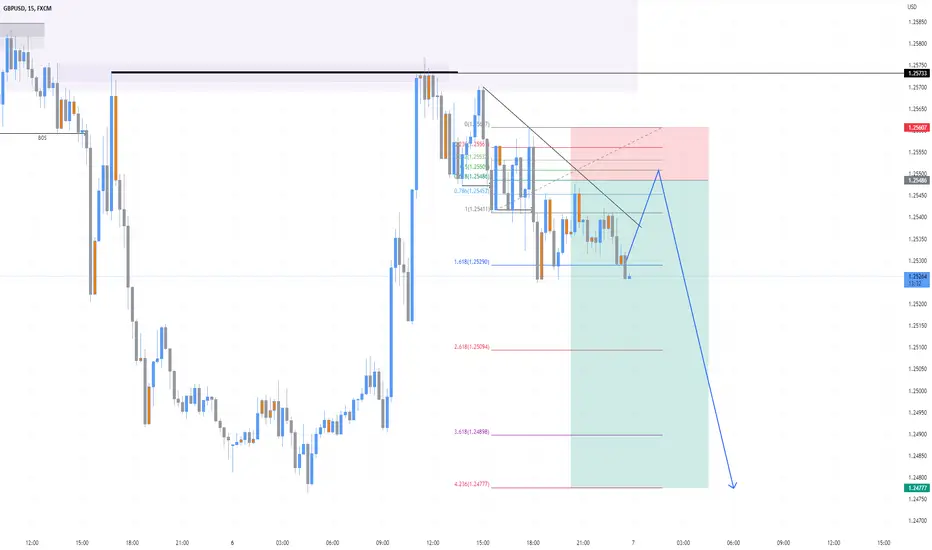
Banknifty strongest Wave 3 of Fall to startBanknifty recovered up after fall from 34820. Currently wave 2 of zig zag in progress.
Risky option would to go short near 34700 with SL 34820 or can wait for confirmation break of 34530 for downside fall minimum target 34000.
Wave 3 will go beyond 1.618 fibonacci extensions level. Channel break needed for sharp fall so watch as plotted on chart.
DISCLAIMER:There is no guarantee of profits nor exceptions from losses.
Technical analysis provided on the chart is solely the personal views of my
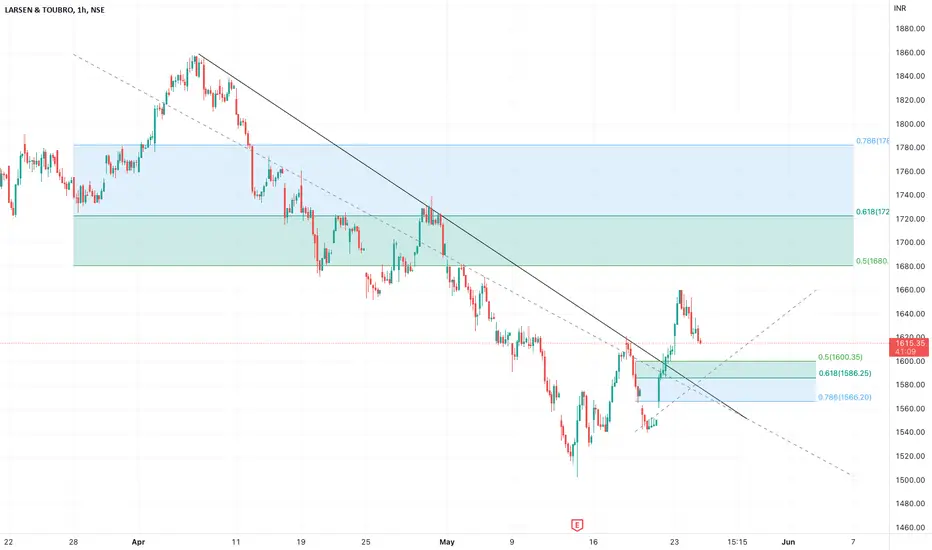
LT getting ready for a big move up?LT gave a good breakout of the trendline & is now on its way back down to retest the trendline. The ideal place to buy will be between 1585-1600 as it is also the retracement into the fib golden zone of its last move up. the recent import duty cuts on raw materials like Iron & levy of export duty on steel products should also be of benefit to the stock.
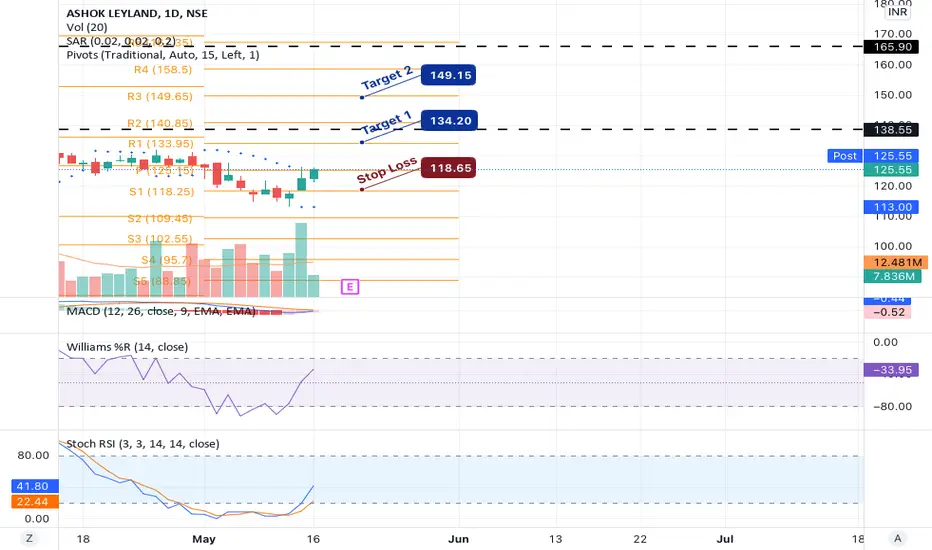
ASHOK LEYLAND: Upward TrendNSE:ASHOKLEY shows strong buy indicated by PSAR, MACD & Fisher crossover followed by EMA & MA Crossover
Target 2: 149.15
Target 1: 134.20
Stop Loss: 118.65
𝑫𝒊𝒔𝒄𝒍𝒂𝒊𝒎𝒆𝒓:
The analysis is only for illustration purposes only. Please consult your financial advisor, agent, broker before acting on any information. We may or may not have positions in the stock and our actions may be contrary to the one mentioned here. This analysis may or may not be updated. We would not be responsible for the profit/
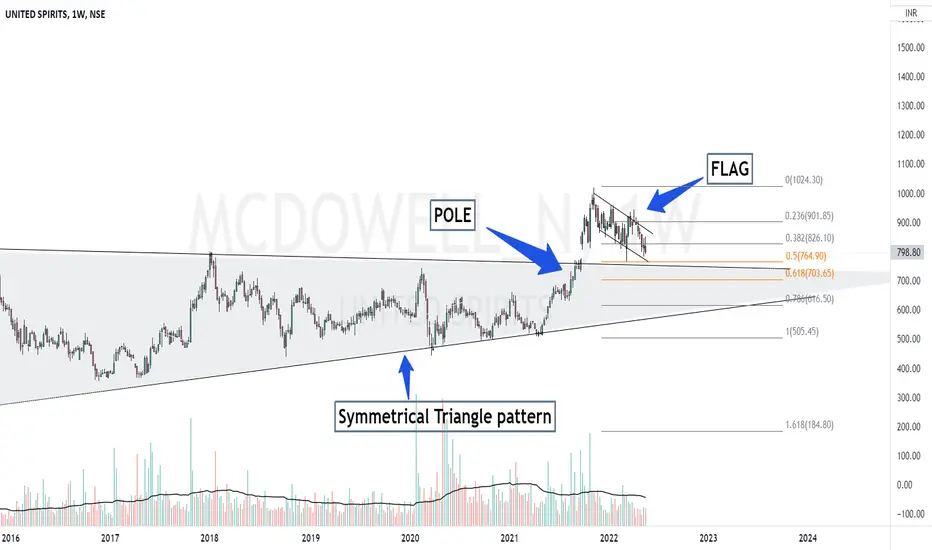
McDowell Long opportunityNSE:MCDOWELL_N
Stock -> United Spirits (McDowell)
TimeFrame -> Weekly
Hello all!
United Spirits broke out of the symmetrical triangle pattern on 27 September 2021. The stock since then has been consolidating ever since thus forming a flag and pole pattern and has now finally come to retest the triangle it broke out of. It makes for a good opportunity to go long.
The perfect entry would be after the breakout of the flag pattern. The stock is also nearing its "Golden zone" (between 50%-61.8%
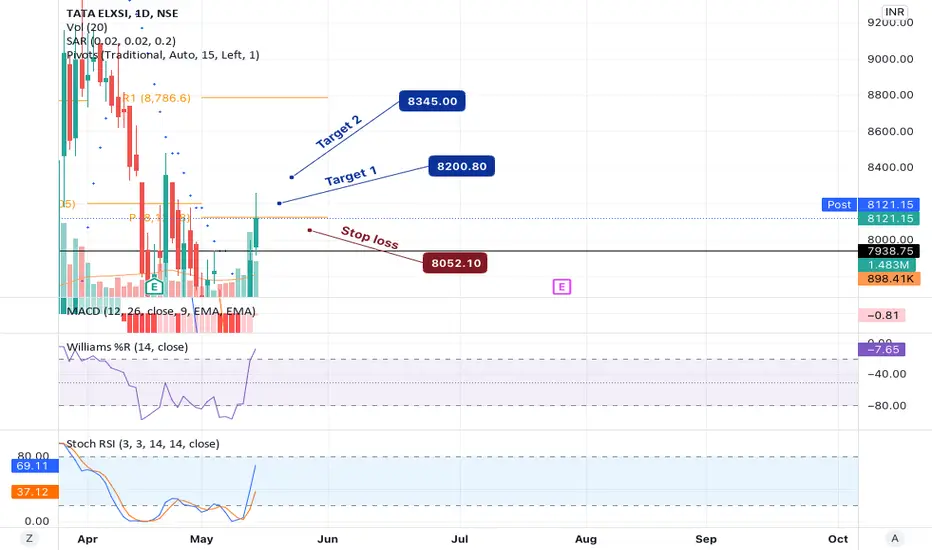
TATA ELXSI: POSITIVE TRENDNSE:TATAELXSI shows strong buy indicated by PSAR, MACD & Fisher crossover followed by EMA & MA Crossover
Target 2: 8345.00
Target 1: 8200.80
Stop Loss: 8052.0
𝑫𝒊𝒔𝒄𝒍𝒂𝒊𝒎𝒆𝒓:
The analysis is only for illustration purposes only. Please consult your financial advisor, agent, broker before acting on any information. We may or may not have positions in the stock and our actions may be contrary to the one mentioned here. This analysis may or may not be updated. We would not be responsible for the prof
MLong
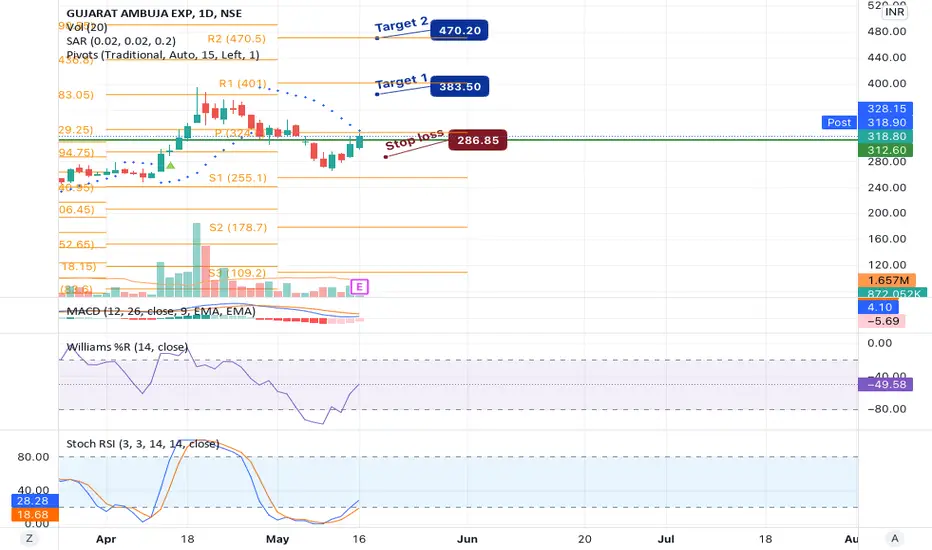
GUJARAT AMBUJA EXPORTS: Long term positive outlook NSE:GAEL shows strong buy indicated by PSAR, MACD & Fisher crossover followed by EMA & MA Crossover
Target 2: 470.20
Target 1: 383.50
Stop Loss: 286.85
𝑫𝒊𝒄𝒍𝒂𝒊𝒎𝒆𝒓:
The analysis is only for illustration purposes only. Please consult your financial advisor, agent, broker before acting on any information. We may or may not have positions in the stock and our actions may be contrary to the one mentioned here. This analysis may or may not be updated. We would not be responsible for the profit/los
Hindustan Unilever long opportunityNSE:HINDUNILVR
Stock -> Hindustan Unilever
TimeFrame -> Weekly
Hello all!
Hindustan Unilever has corrected about 40% from its highs in September 2021. The stock has been in a downtrend since then and has been taking stiff resistance from trendline 1. It approached its strong support band of 1850-2000 and took a strong bounce from there with good volumes and also broke trendline 1. The retest of the trendline has been done and its followed by a bullish candle. This thus makes for a good oppor
NHPC LTD: GROWTH TREND NSE:NHPC shows strong buy indicated by PSAR, MACD & Fisher crossover followed by EMA & MA Crossover
Target 2: 37.60
Target 1: 34.85
Stop Loss: 29.05
𝑫𝒊𝒔𝒄𝒍𝒂𝒊𝒎𝒆𝒓:
The analysis is only for illustration purposes only. Please consult your financial advisor, agent, broker before acting on any information. We may or may not have positions in the stock and our actions may be contrary to the one mentioned here. This analysis may or may not be updated. We would not be responsible for the profit/loss