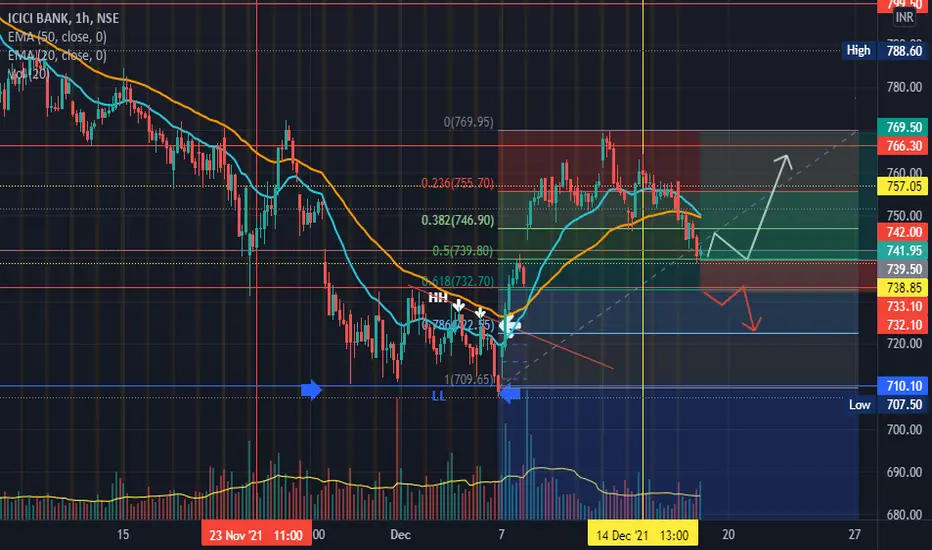
ICICI Bank is now on the radar.On Thursday(16/12/2021), we saw many banking stocks close in the red. The indices, also in red, closed above 36,500. Well, we know it's an important level of banknifty. It also important to watch how Banknifty is going to perform.
* ICICI BANK, with a weightage of 5.84 percent NIFTY50 stock, is down nearly 18 percent from its recent high, making now an good time to add to your long-term portfolio.
*Recently, many analysts were also bullish on the stock, and we saw it shoot up. price action mov
Fibonacci Retracement
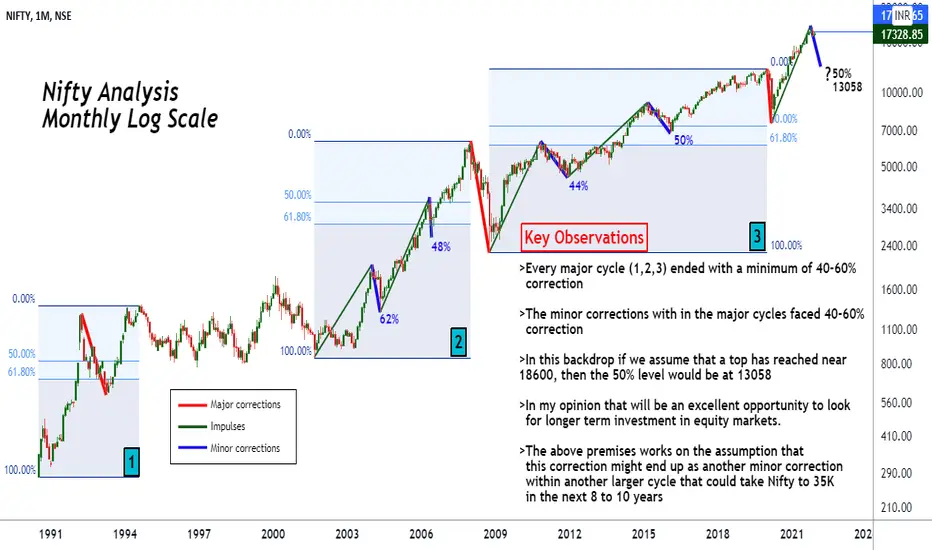
Nifty Analysis: Monthly Log ScaleThis chart presents three major cycles. Each cycle representing a decade. First cycle worked in 90s; second one in the first decade of 21st century and the third one in the second decade. Perhaps we are in the fourth cycle that would represent the third decade.
The first two major cycles ended with more than 62% percent correction of the entire decadal bull run. The third cycle (recent 2020) was an exception with 40% correction.
There are many ups and down, in each decadal major cycle, called
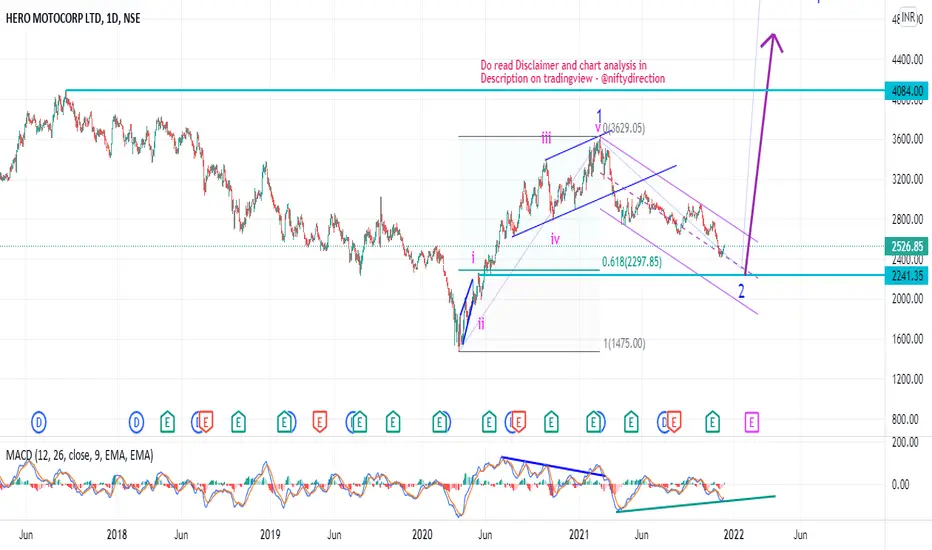
Hero MotoCorp 2x-3x potential in long termStock is in wave 2 zig zag correction and dropping towards 0.618 Fibonacci.
Good to add in range 2500-2200 with Stop Loss 1980 for long term for 2x-3x returns
DISCLAIMER:
There is no guarantee of profits or no exceptions from losses.
The stock and its levels discussed are solely the personal views of my research.
You are advised to rely on your judgement while investing/Trading decisions.
Seek help of your financial advisor before investing/trading.
TATA Consumer looks strong…TATA Consumer looks strong…
Reasons/Traits :
• Today gave a break out from two day inside bars with a big green bar with very good volume
• Above 13 and 50 EMA
• Price touched 0.618 retracements levels
• RSI increasing
• Bearish Crab harmonic pattern formation is in place
What can happen next :
Scenario 1 : Price sustaining above 850/853 levels can take it to 865/870/915/940 levels
Scenario 2 : Price break down below 834 can take it down to 812/800/775/750 levels
Disclaimer : This analysis
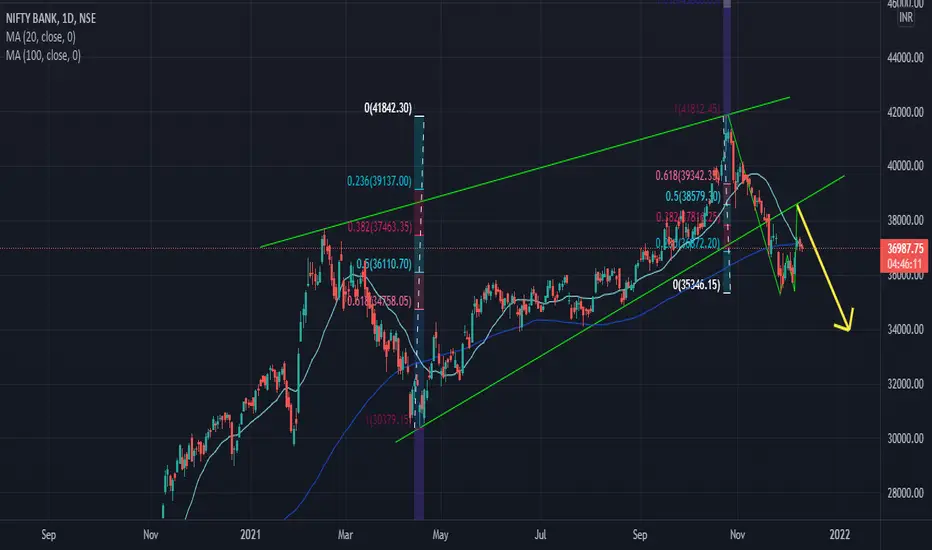
Bank Nifty Daily Chart OverviewHello Traders, hope you all are doing amazing!
Today I will be showing you the daily chart overview of BankNifty, so traders as you can see, on the 1D chart a huge rising wedge pattern has been made which has recently broken down to 35327. Now here, I won't say I can see a double bottom but yes, I can definitely see a "W" pattern which will probably hit the lower band of the rising wedge pattern and fall down again, because if I pull a Fibo retracement from up 41871 to down 35257, we can see th
IRCTC TRADE SETUP FOR TOMORROWAs you can see in the chart, IRCTC has made the between 824-780.
.
So stock has already filled the gap and then took a correction now it again in the upward momentum.
.
So for tomorrow if stock goes above 825, you can buy this trade for the target of 838.
.
What's your view on this comment below in the box.
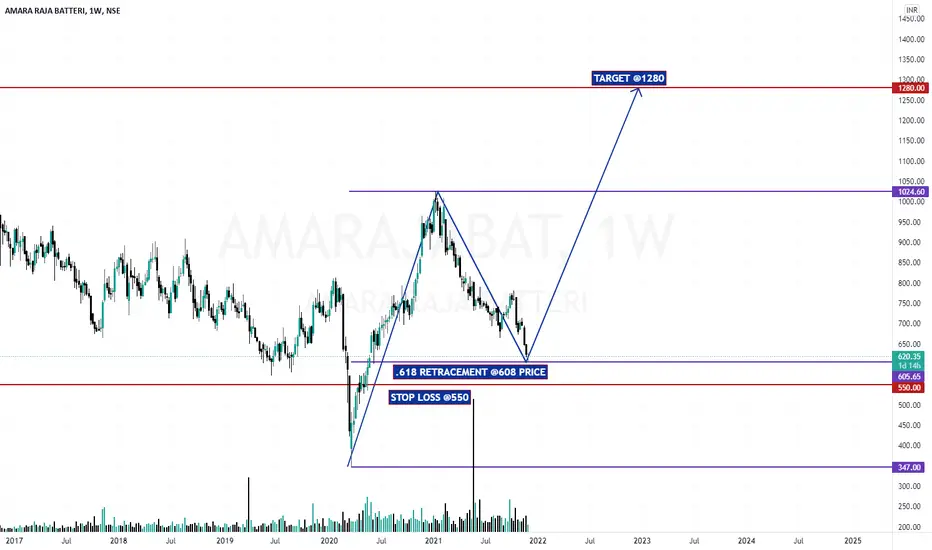
AMAR RAJA BATTERYi have mentioned everything on chart, you can also ask me in comments if you have any questions
Thanks
ALong
SAIL - Potential Reversal with excellent Risk Reward
BUY GUIDANCE:
Never buy before 3PM (for positional trading). I have been burnt many times over. Try to buy between 3:15 - 3:30PM, later the better.
SL: Depending on your risk appetite: Below Weekly BO Candle / Below Daily BO Candle / 50% of Weekly BO candle / Below 20DMA
TGT: After a 10-15%+ vertical move, breakdown of 20DMA (on a daily close basis)
SELL GUIDANCE:
Selling in Profit:
Sell earlier in the session when the prices are higher, around 11AM.
Selling at SL:
Give your stock a chance
RBL BANK - CRUCIAL LEVEL - Retracement from 61.8 Fibonacci LevelBased upon the Levels Provided below,one can attempt the trade in the following stock.
Disclaimer:
This view is purely for educational purpose and it's my personal.
Please consult your financial advisor before attempting any trade.
We're not responsible for any loss or profits.
TATA Motors : AnalysisTata motors has given 90 degree breakout after consolidation for several months. Possibility of breakdown is good.
Note:- This analysis is done on weekly time frame hence traded accordingly.
Creation of possible supply zone at higher level depicts the upcoming fall. If this zone is a supply zone then market coming down and retesting 400 levels is a possibility.
Possibility of consolidating at higher levels for few more days is good. Wait for it to close below recent low 470 levels which ta
Bank Nifty 1 Hr Chart with Fibonacci Retracement Target 38200Bank Nifty 1 Hr Chart with Fibonacci Retracement towards Target of 38200
Option/ Future buyers- Buy only December Month expiry
Also with a view of Monthly and weekly expiry.. Volatility will be there to eat premiums are on both Side.
Dont trade option with November Month Expiry. Still if you want to trade , go only with 1 lot of 38000 with very stick stop loss as per your Risk management.
opportunity for long term investment in INDUS TOWERSIndus Towers Limited is formed by the merger of Bharti Infratel Limited and Indus Towers. This combined strength makes Indus one of the largest telecom tower companies in the world. Indus Towers Limited has over 183,462 towers and a nationwide presence covering all 22 telecom circles. Indus’ leading customers are Bharti Airtel (together with Bharti Hexacom), Vodafone Idea Limited and Reliance Jio Infocomm Limited, which are the leading wireless telecommunications service providers in India by r
Support-Resistance, Volume, Fibonacci, EMA & Breakout Case studyCase study of DISHTV for Educational Purpose.
This stock was facing resistance at particular level since last 2 years,
and also got consolidation in parallel channel from last 1 year,
now Stock making higher highs and higher lows ( Up Trend )
each and every time when price was correcting, the Volume was decreasing, which can makes conviction towards positive.
co-incidentally top of parallel channel and 2 years resistance level both are at same level,
finally it has given good breakout from tha