Fibonacci Retracement
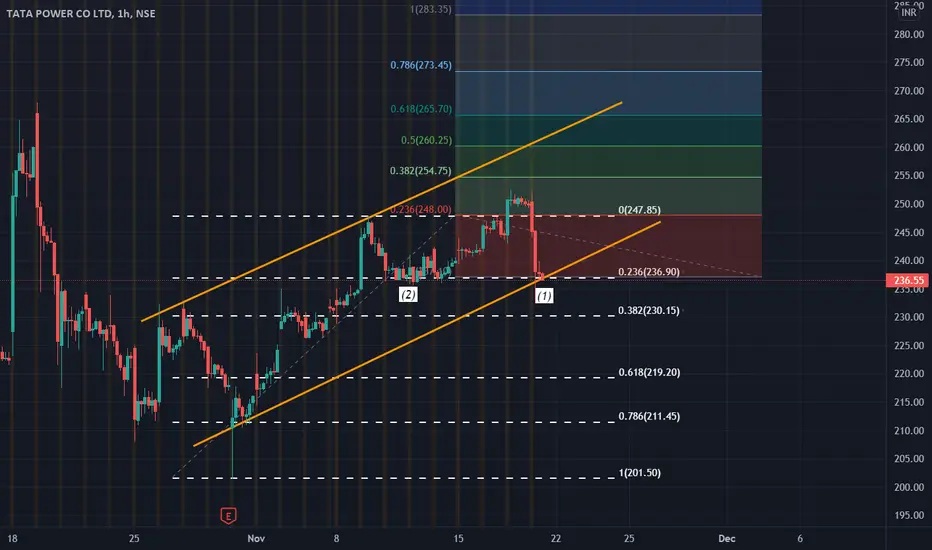
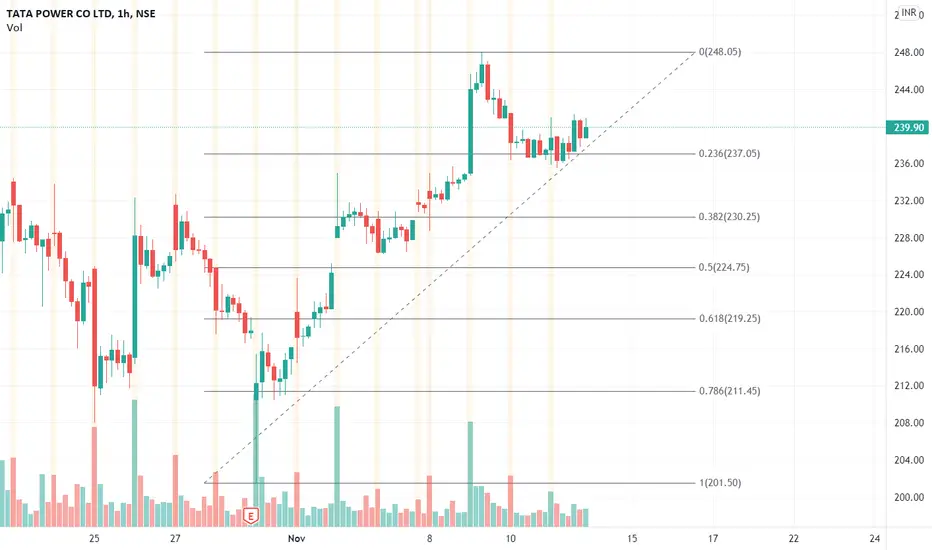
TATAPOWER Analysis 18/11/21; S&RTata Power is building support at current levels of 236-237.
At point 1, we can see a STRONG SUPPORT LEVEL (Trendline support in parallel channel as well as Fibonacci Retracement 0.236 support level.)
As we have already seen previously, TATA POWER has taken support and bounced back from these levels a few days back.
If the stock sustains and respects this strong support level, then a further upmove is expected. Levels can be seen from the colourful fibonacci extension charts. Stock has already
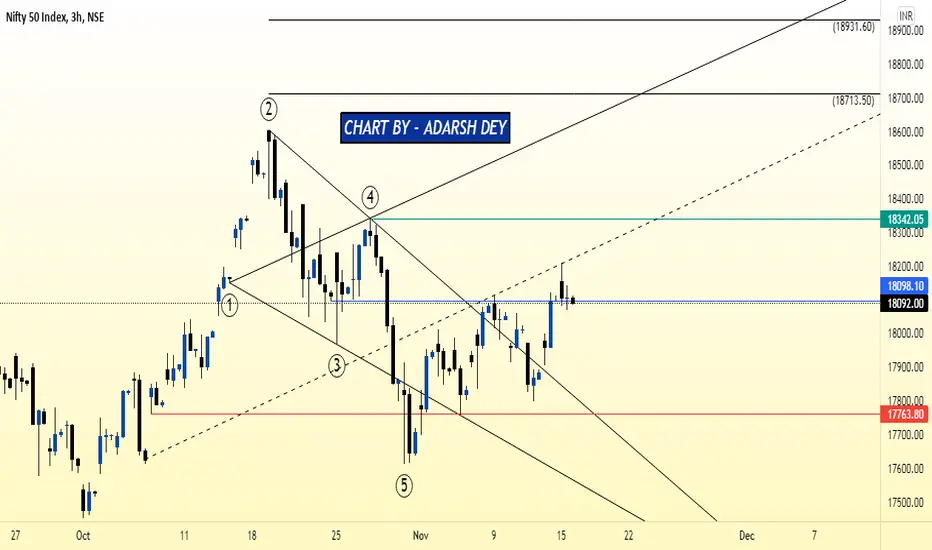
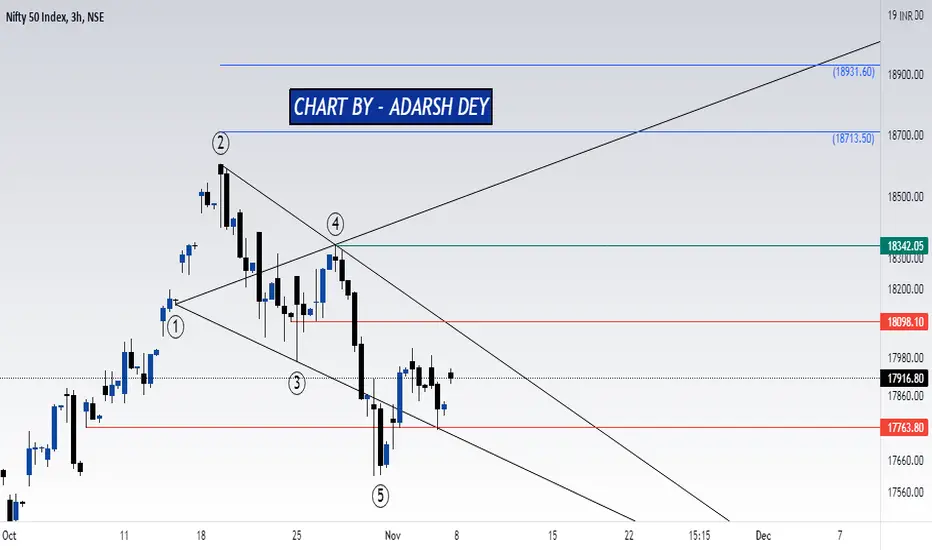
NIFTY OUTLOOKPreviously in NIFTY Outlook (7th Nov 2021) post:
-18098 was the first target, it is achieved on 9th Nov very accurately and market reversed to retest support afterwards.
-17763 was the mentioned support, Nifty was saved by almost 40 Points.
-Today Nifty tried to breach the first target (18098) with a Gap up but was unable to sustain above it.
-The second target remains to be at 18342.
(LINK TO THE PREVIOUS NIFTY Outlook (7th Nov 2021) IS GIVEN BELOW)
Now:
-The chart setup is still the same,
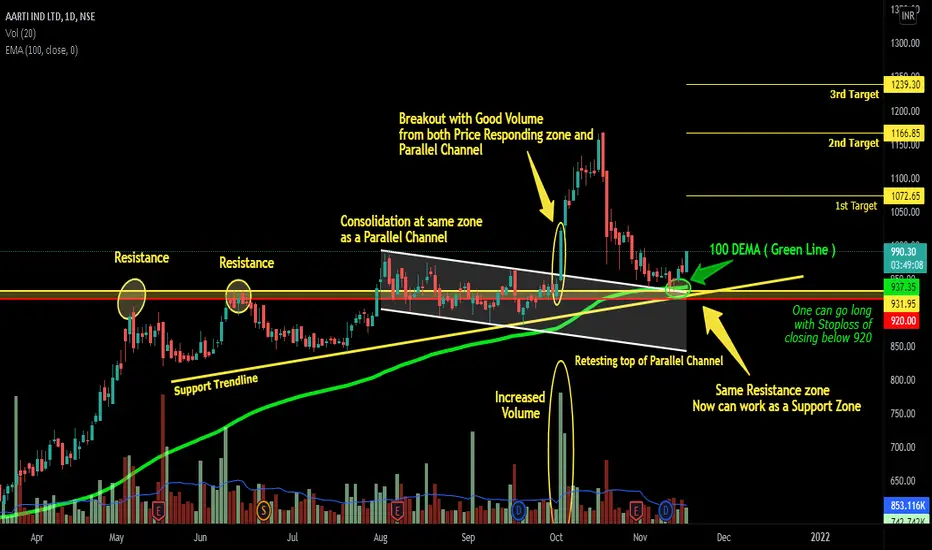
U-TURN Resistance converts into Support (EDUCATIONAL -AARTIIND) Aarti Ind. ltd. This stock has taken Resistance twice at same level, then it consolidated as a parallel channel at that same zone,
and then it given good breakout from parallel channel along with good intensity of volume,
Now it has retraced almost 78.6%, co-incidentally (1) same resistance zone, (2) Parallel channel's top, (3) Support trend line and (4) 200 DEMA, all are there at similar point location, All these 5 conditions met at same level that can provide good support. This scenario make
ICICI BANK case studyIcici bank spot cmp 763
counter gave a gap up opening few days a go,, but the opening candle of particular day was not crossed and there was no follow through buying,
now counter have reversed and filled the gap,, currently around demand zone of gap levels and golden means retracement ratio of previous swing.
very small candle formation around lower levels with low volume
divergence on rsi on all lower time frame till 60 min
RSI over sold on all time frame below 60 mins
reversal in counter poss
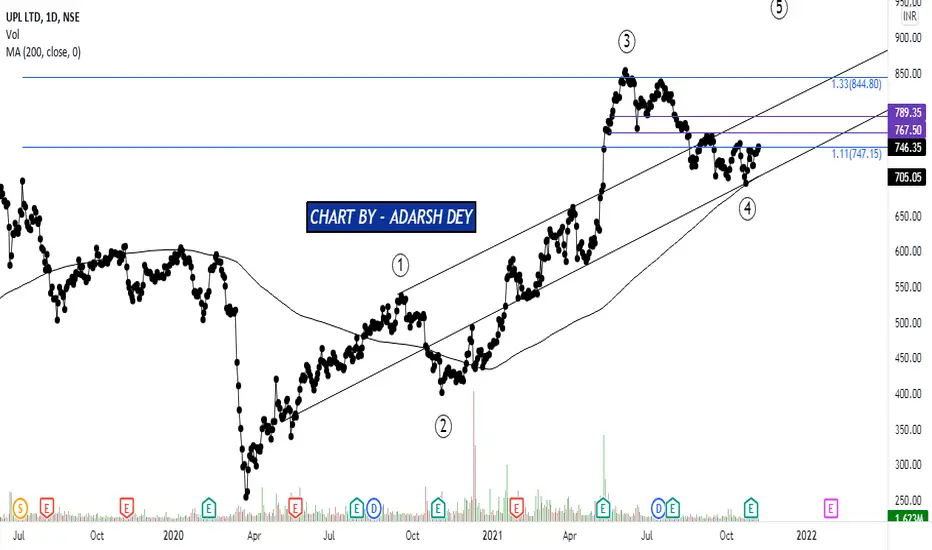
UPL: Picture abhi baki hai mere DostThe chart is self Explanatory, So i am not going to explain anything more.
And this is an Investment Idea not Trading idea. Those who wants to invest Have patience and add on dips.And for trading purpose 790 is a good level to book profit.
Chart & Analysis By - ADARSH DEY
BIOCON ( Ready for Marathon)BIOCON:
Few key points to note:
- Seems like Wave 4 is completed and Wave 5th have been initiated.
-Respected the Golden Ratio of the prior trend.
- RSI Bullish Divergence (Double Bottom)
- Support taken at 200 Weekly Moving Average & EMA
- Bullish Candlestick pattern formed at Official Level (Golden Ratio) & Moving Averages.
I expect upside reversal in BIOCON from this point. However the trade gets activated once it closes above 350 and the expected target is 421-544-596.Please note, this
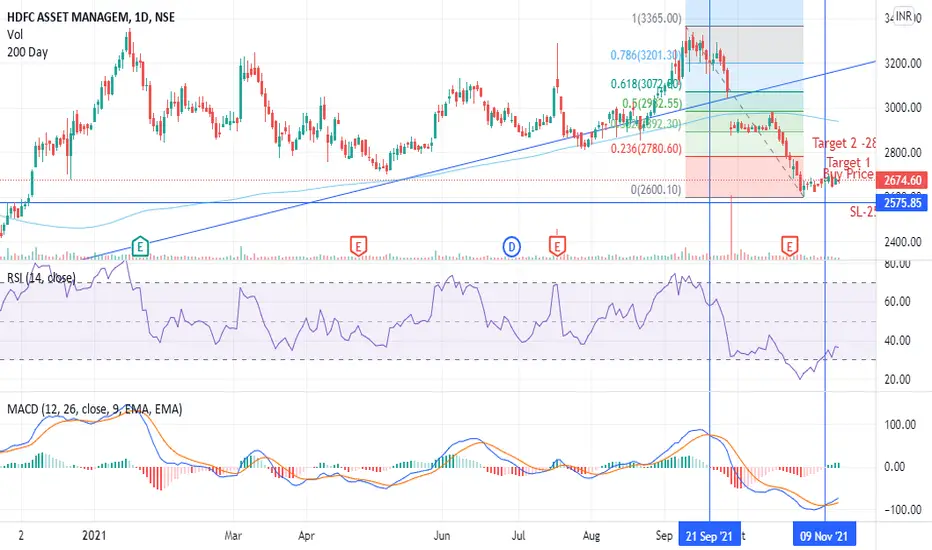
HDFC AMC BUY Price 2660 RSI divergence MACD crossoverHDFC AMC has completed its correction and there is crossover in MACD and RSI has also moved from oversold to buy zone . Stock is trading below 200 DMA . Target recommended from Fibonacci retracement .
Target 1 23 % retracement .
Target 2 - 38 % retracement .
SL-2580
(Please note : DO your analysis as I am not Sebi-registered analyst)
JINDAL STEEL & POWER(SHORT TERM BOUNCE)JINDAL STEEL & POWER:
Few key points to note:
- Near the support & resistance trend line
- At golden ratio of prior trend.
- Waves counting are mentioned
- Recently tested 200 EMA
I expect a small bounce from this point for 420-430-447, but we don’t have any reversal signal yet. Once a bullish candle is formed at this level, we can long for the mentioned targets.
However for long term (1 YEAR & ABOVE) I am not bullish on this stock at this point of time because few important parameters are
For Education Only - GBPJPY PairHello Traders,
Hope you all are doing good!!
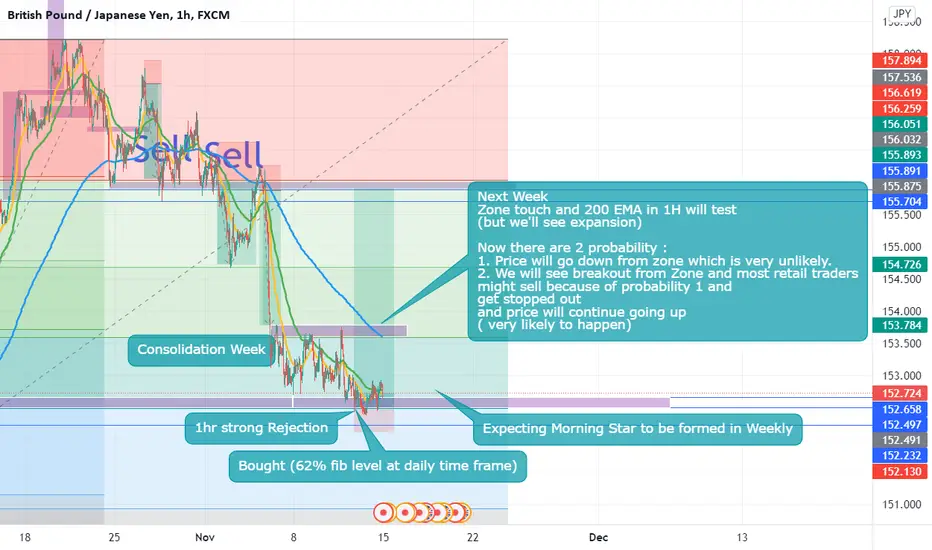
My analysis on GBPJPY is bullish biased, If you look at daily time frame and draw Fibonacci Retracement from swing low to swing high you can clearly see price tested at 0.62 fib level.
Now if you go to weekly time frame you can see this week was doji and previous week was huge bear candle so now I'm expecting bullish candle in next week because it can form a morning star in weekly time frame if it gonna be so.
Now open 1H time frame and look at
JSW Steel looks weak…JSW Steel looks weak…
Reasons/Traits :
• Ascending triangle formation seen
• Below 50 EMA
• Price moving between 0.236 and 0.382 retracements levels since few days from recent high
• Constantly falling RSI
• Force index 3 is greater than 0 and Force index 13 is less than 0
• ADX negative is greater than ADX positive
What can happen next :
Scenario 1 : Price sustaining above 690/692 levels can take it to 700/720/730/740/750/760 levels
Scenario 2 : Price break down below 665 can take it down to
IB Real Estate Fib Retracement 38.2% levelsIB Real Estate recently hit its all time high around 195-196 zones. After this upmove, stock corrected to its 38.2% levels i.e. around 177-178 zones. This zone has previously also acted as a strong support (demand zone) for the stock. This time also the stock has respected this support level and bounced back from it. A strong sustained support from the current levels can lead the stock towards its all time highs. I am personally bullish on this stock.
*** I am not SEBI Registered Advisor, do co
ILong
Tata Power Fibonacci Retracement SupportOn the 1H chart, we draw Fibonacci taking swing highs and swing lows. It's clearly visible that TaPo takes support at 0.236 retracements. If it sustains and respects these support levels, a further upmove to the levels where it faced resistance (i.e. the recent high tested yesterday 10/11/21).
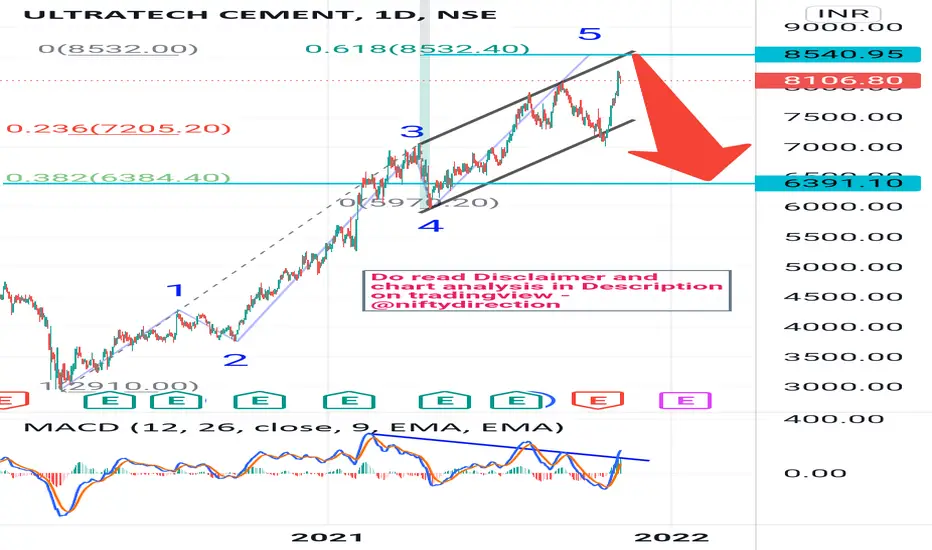
Ultratech Cement On final push then fall aheadUltratech Cement had stellar rally from 2900 to 8000+ looks to be heading max 8532 which is max possible upside for it as wave 5.
Then a corrective wave will start towards 6300 which is 0.382 fibonacci levels.
Notice MACD Negative Divergence price making higher high and MACD higher lows.
DISCLAIMER:There is no guarantee of profits nor exceptions from losses.
Technical analysis provided on the chart is solely the personal views of my research.
You are advised to rely on your own judgments whil
NIFTY OUTLOOKIn my previous Nifty Outlook post the findings were that we should expect a reversal of this point and as it is last day of the month(29th Oct) so I expect the correction to be over. And thankfully market respected the pattern and till now it hasn't breached the Low of 29th Oct.
The link for the previous study:
Now during this entire fall, luckily a Bullish wolfe wave has been spotted. And recently on 3rd November NIFTY has tested the 135 TL successfully by making a low exactly at 135 TL. The