NIFTY VIEWnifty stuck in narrow range of 16500-16720 range bond market currently nifty has supply zone near 16700Shortby MDstockmagic0
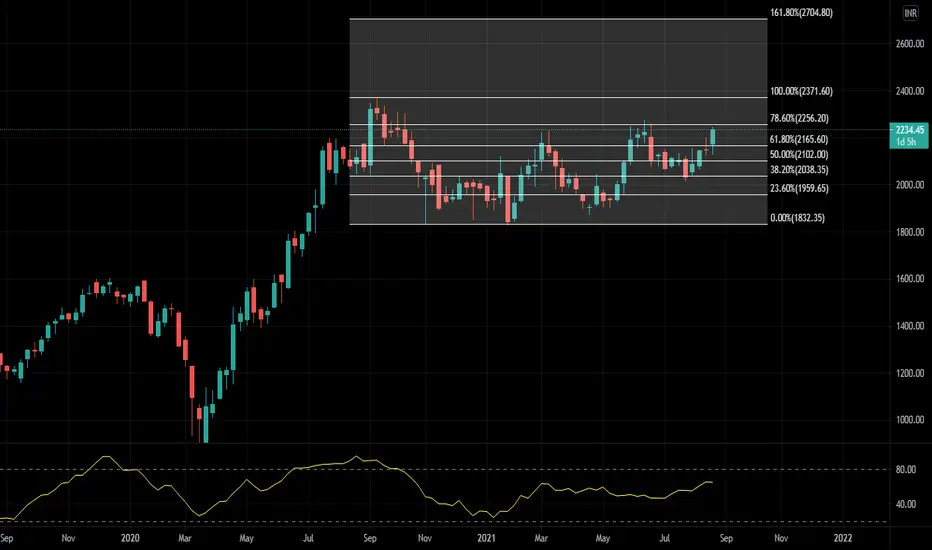
RELIANCE LOOKING STRONG ON WEEKLY CHARTNSE:RELIANCE After 1 yr of consolidation Stocks looks Strong on Weekly Chart. Trading between 61.8% & 78.6% levels as per Fib Retracement. once closes above 78.6% then will go for 100% and will try to creat ATH. and above it strong upward rally can be seen once again. **EDUCATIONAL PURPOSELongby Prabodhan_K2
GESHIP - Fibonacci breakoutBSE:GESHIP GESHIP is showing recovery from pullback. If the breakout above the 345 Level Its good bet for Target of 380.Longby sakashik0
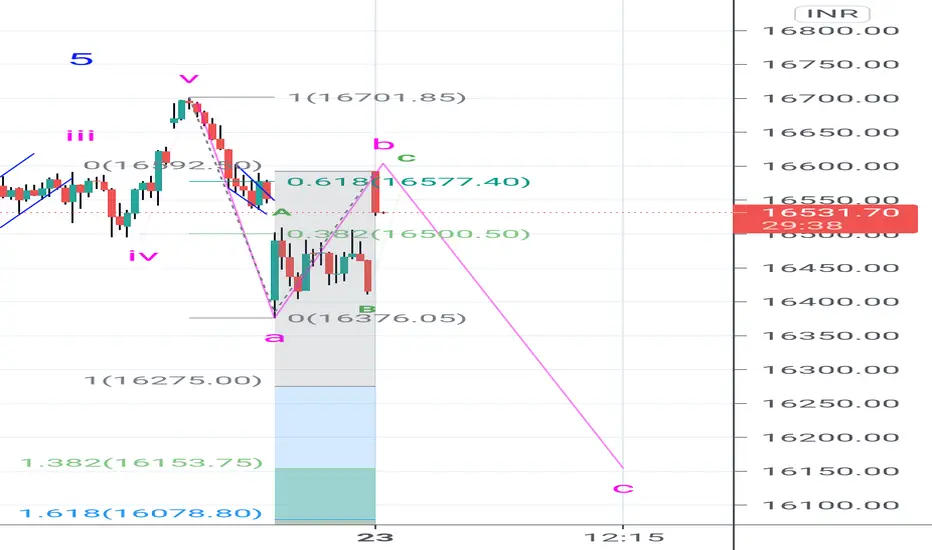
Nifty In flat correction Wave B about to complete. Wave B is complex correction which retraced more than 0.618 fibonacci level of wave A. Wave B can strech upto 16695 which is 0.382 fibonacci. Stop loss of this analysis will be 16703 just a point above all time high. Downside C wave targets would be 16400 or 0.382 fibonacci level retracement 16250. DISCLAIMER:There is no guarantee of profits or no exceptions from losses. The study provided is solely the personal views of my research. You are advised to rely on your judgment while investing/TShortby Niftydirection210
Fantom Buy on retest.FTM/USDT is taking resistance on the Fibonacci Re-tracement level. Also RSI is highest somewhere around 80 and MACD is about to give crossover. Yellow box is the buying zone and can give up to at least 20% in short term. If holding don't exit (buy more on support),if not enter after 4 hr candle closes above in yellow zone. Fby neerajmali254
Fantom Buy on retest.FTM/USDT is taking resistance on the Fibonacci Re-tracement level. Also RSI is highest somewhere around 80 and MACD is about to give crossover. Yellow box is the buying zone and can give up to at least 20% in short term. If holding don't exit (buy more on support),if not enter after 4 hr candle closes above in yellow zone. Fby neerajmali250
Nifty wave C about to startNifty wave A is 3 wave structure completed near 16376. Wave B was zig zag correction moving more thann 0.618 fibonacci level of wave A. Considering 16592 as top Wave C is expected to end in zones 16275 (100% of Wave A) to 16153 (138.2% of Wave A) DISCLAIMER:There is no guarantee of profits or no exceptions from losses. The study provided is solely the personal views of my research. You are advised to rely on your judgment while investing/Trading decisions. Past performance is not an indicator oShortby Niftydirection39
Hindustan Unilever long opportunityHello People! HUL has been taking consistent supports from the bottom trendline since 2018. Thus there is a high probability it would act the same way here as well. But I jumped in a bit earlier and I have solid reasons for that. The first being that HUL has shown a massive bullish candle right at support. So chances of a trend reversal seem high. The second reason is the solid weekly 50EMA and daily 200EMA support. The stock made a bullish candle right at these crucial averages. The thiLongby Traders_TownUpdated 1
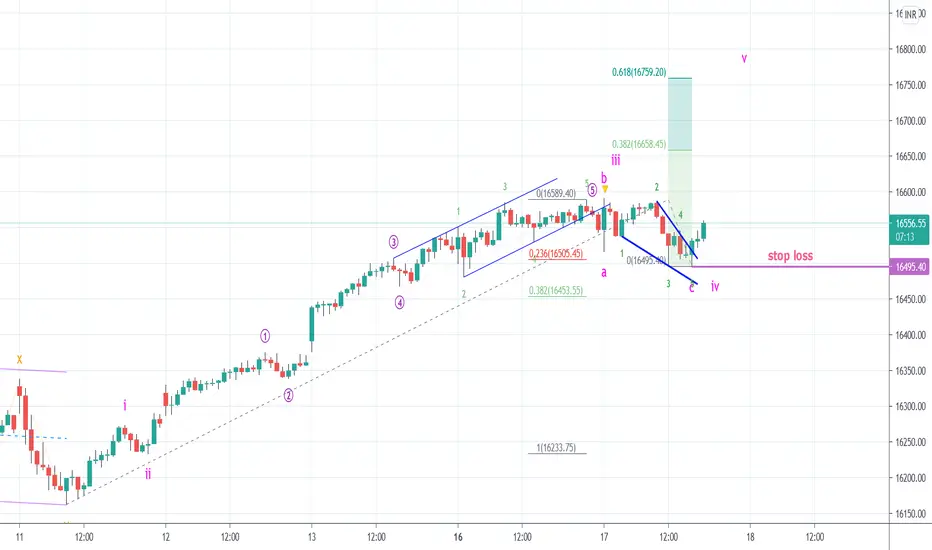
Nifty Upmove towards 16660-760 as wave 5Nifty retraced 0.236 Fibonacci with Irregular flat. Wave C of irregular flat was ending diagonal which finished at 16495.40 Upside wave 5 target is expected to move 0.382 Fibonacci extension 16660 or 16760 which is 0.618 Fibonacci. DISCLAIMER:There is no guarantee of profits nor exceptions from losses. Technical analysis provided on the chart is solely the personal views of my research. You are advised to rely on your own judgments while taking any investing/Trading decisions. Past performanceLongby Niftydirection13
Nifty upmove expected beyond 16700Nifty 15 min chart looks wave iii completed today for upmove started from 16162. Wave iv is expected to end between 16505 which is 0.236 fibonacci retracement or 16453 0.382. Consider 0.382 fibonacci retracement wave V target will be 16716 if reversal takes place from 16505 the target will be 16770. DISCLAIMER:There is no guarantee of profits or no exceptions from losses. The study provided is solely the personal views of my research. You are advised to rely on your judgment while investing/by Niftydirection1
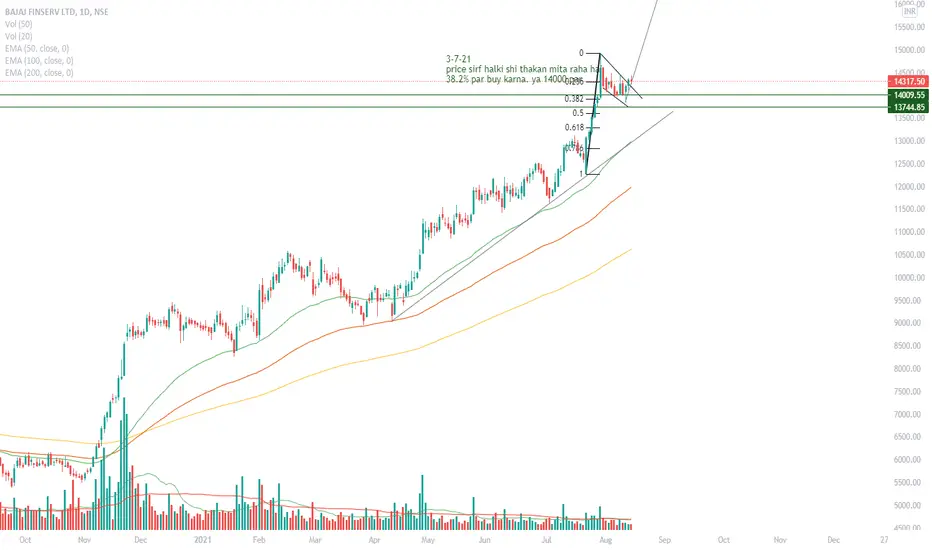
Buy signal in BAJAJFINSVNSE:BAJAJFINSV price flag pattern bana rha hai. jo apne high se low volume ke sath 38.2% retrace hua hai. price ne abhi retest kia hai ab ye relly ko ready hai. buy call= 14168 stoploss = 13682 exit = 16400 ya jab 30 min ke 200EMA ko break kare. NOTE: ENTRY KA RIGHT TIME 13900 THA JO LATE HO GYA HAI. BUT ABHI BHI ENTRY LI JA SAKTI HAI.Longby StopLoss_trader1
Amara Raja Batteries long opportunityNSE:AMARAJABAT Hello People!! Amara Raja batteries has been on my watchlist since the start of 2021. It gave a beautiful breakout in October 2020 and I was waiting for a retest. Finally, it is happening now. We can also see that along with a retest of the trendline, it is also consolidating in a flag and pole pattern for quite some time now. The stock is already at decent support and also at 50% Fib level. All these factors along with a good Risk to reward ratio contribute to it being a gooALongby Traders_Town1
Cadila HCCadila retracing from 0.5 Fibonacci levels. Could be good buy. Do your own analysis before taking trade. Correct me if I'm wrong Thanks.CLongby TheEthicalTrader2
KIMS - POSITIONAL TRADEBUY KIMS SAFE ENTRY ABOVE 1305 & AGGRESSIVE ENTRY AT CMP TARGETS 1340, 1450, 1550++ SL BELOW 1145 ON CLOSING BASIS (TRAIL SL ONCE TARGETS ARE NEARING) Disclaimer: All Charts are for Educational Purpose. Please consult your financial advisor before investing.Longby parthsharma_999Updated 21
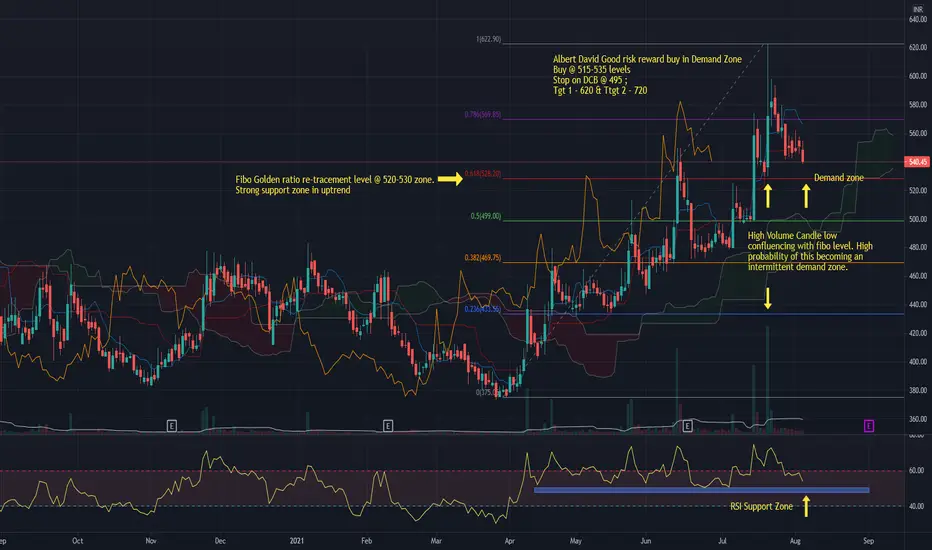
Albert David - Approaching strong demand zone @ 525-30 LevelsAlbert David is coming out of a 2 year range with strong volumes. It first attempted to break free from the range in mid July, but could not sustain above the range high. It has now corrected and is approaching a strong demand zone @ 525-30 Levels. The Fibonacci re-tracement level of 61.8 also confluences with the demand zone. The RSI levels also show support in 50 zone. The volumes on correction have been thin suggesting it to be a pullback rather than a reversal from top. Going long @ 525-30 lLongby Absolute_InvestmentsUpdated 1
VOLTAS STANDING AT SUPPORT LEVELStanding at a good support level and i think we can see a upside move from there. Please do your analysis before entering the trade and if you have any idea please tell me in the comments.Longby SamratSinghYadav1
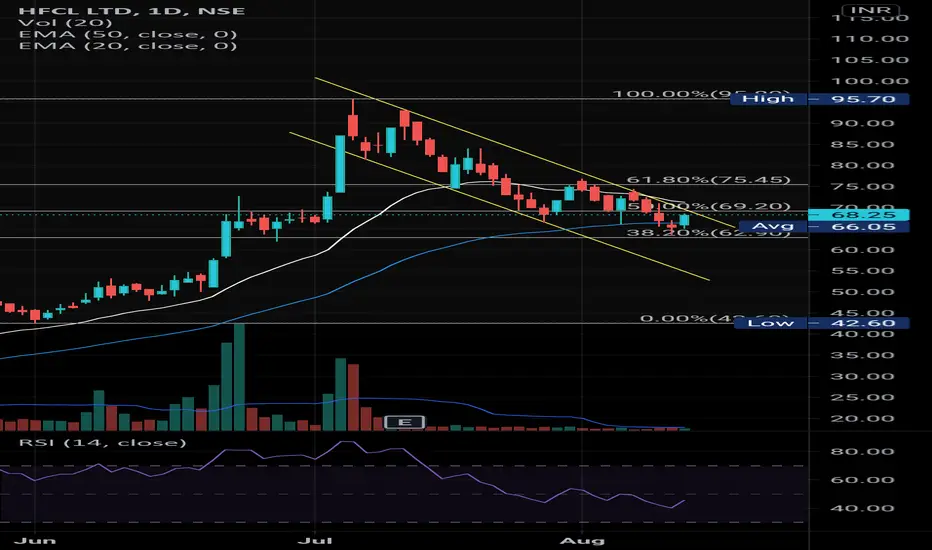
#HFCL Descending channel retraced 61.8 Wait for Descending channel breakout. Do your due diligence before taking trade. Longby Liquid_Bull12
BankNifty view0.236 acting as a good support And at same levels its acting as a demand zone "Not to worry about break-away gap" These gaps are often a good indication of bullish moves in the market. And are often created after a major completion of price action pattern. Let me know You views also. Longby KSR010Updated 4
IBULHSGFIN LONG POSITIONAL/SWING TRADE In depth price action analysis : 1. Indiabulls Housing Finance seems to have found a bottom after the covid crash in March 2020, forming an ascending triangle ever since, and recently giving a breakout with decent volume. 2. There has been an increase in volume not seen before post 2020 suggesting interest in stock. Currently price is retracing back to support zone. 3. The pullback in price has decreasing volume compared to the breakout volume suggesting that this is possibly not a throwbackILongby apratimbanerjee0859
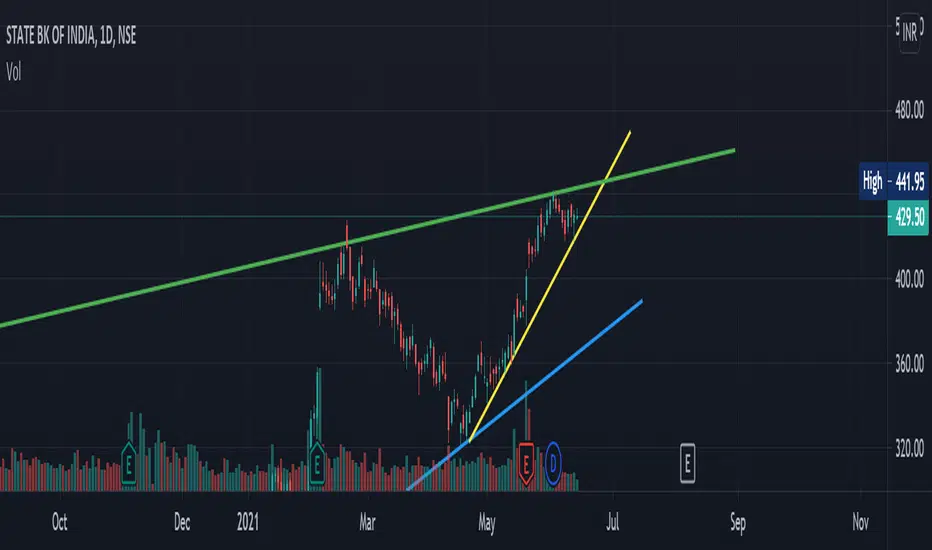
SBIN LONGOn the daily charts of SBIN, it can be seen that it is taking support of its recent trendline (yellow one) and there is a year old resistance too (green one). (OPEN CHART ABOVE) Also, on the weekly charts, a breakout then a retracement kind of action is seen. Also there is a good buying pressure at the day end today. This shows that soon a breakout is expected on the daily charts from the green line. One may look for buying opportunities above 445 with good volumes and good candle body. ExpLongby Keshav2329Updated 23
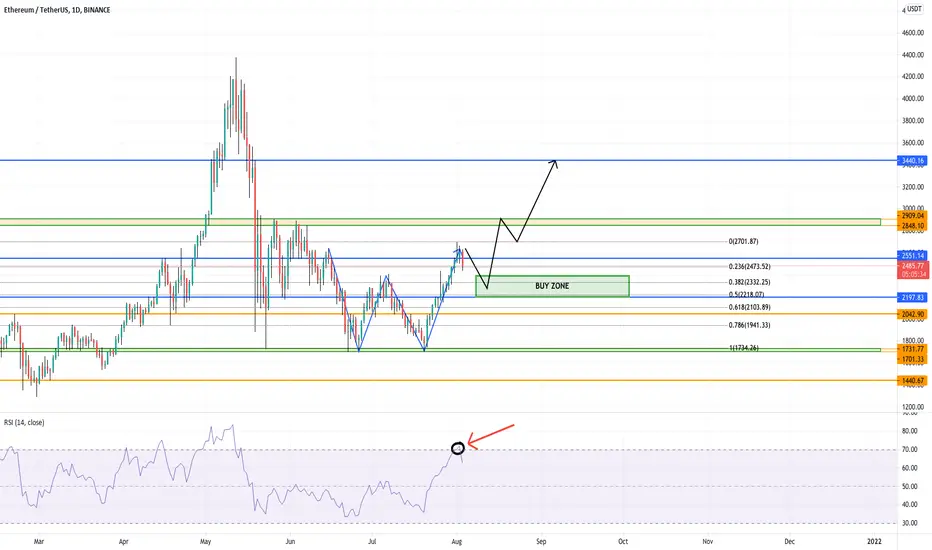
Huge opportunity on Ethereum.Reasons why I'm bullish: - All of the daily Moving Averages are pointing up, meaning that the prince is tending to go up. - ETH went up for 13 consecutive days, we need a pullback to keep going up. - The daily RSI showed that ETH was overbought for the first time after 13 days (Good sign for a pullback). - We have a nice and clean Double Bottom on the daily chart . - The (0.382) Fibonacci Retracement is extremely close to our zone of action in our double bottom and the (0.5) Fibonacci is rLongby ClubCryptoTraders0
Cypher Harmonic With Crazy Confluences Both on 35k and 45k!here you see a crazy Potential Cypher Harmonic that i found with crazy confluence on 35k. my plan is to take the long on B (35k) and trade it up to C ( 45k ) There i have crazy Confluences aswell. this is just godmode if it happens on 8th of august. i love it when it all comes together. Smash that Like button , and hit me in the comments! for more Crazy Confluences Provided by Thunderboy21 Bringing Thunder in the markets! Take care!Longby Thunderboy2126
 ShortShort
 Long
 LongShortShort
 LongLong
 Long
 Long
 Long
 Long
 Long

 LongLong
 Long
 Long
 Long