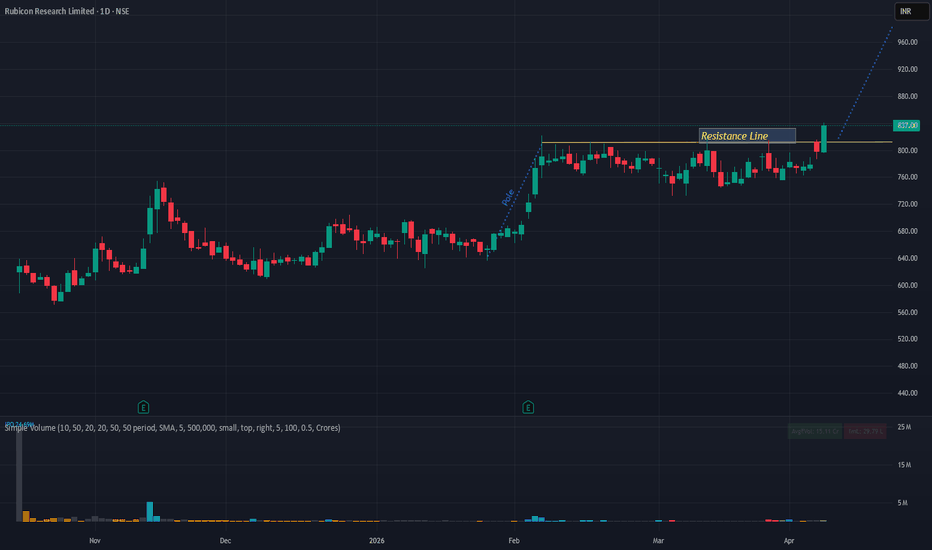
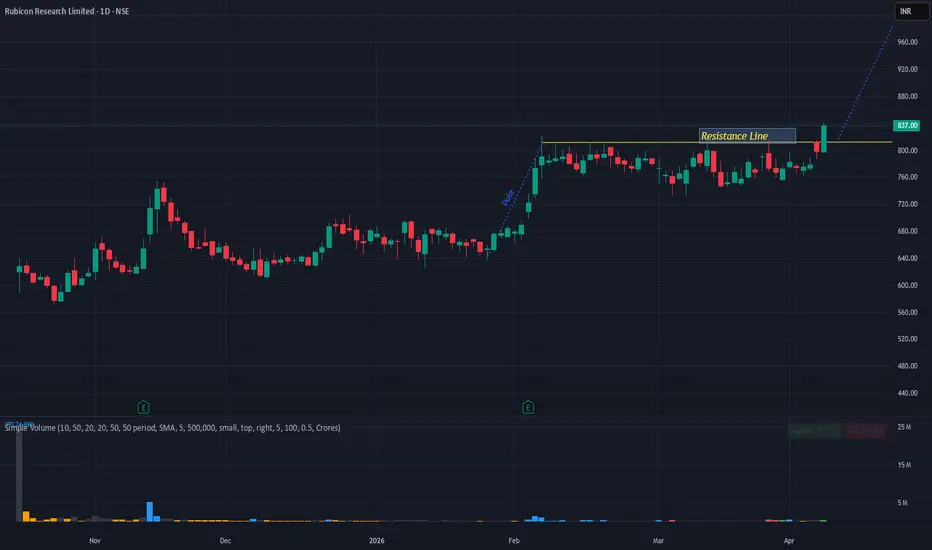
Flagandpolepattern
WeWork India cmp 626.55 Daily Chart since listedWeWork India cmp 626.55 Daily Chart since listed
- Support Zone 580 to 620 Price Band
- Resistance Zone 650 to ATH 678.90 Price Band
- Fairly Decent Support Base made at 610 to 620 band
- Volumes needed for fresh upside price momentum trend
- Bullish Cup and Handle made by the Support Zone neckline
- Flag and Pole pattern formed and waiting to breakout upside
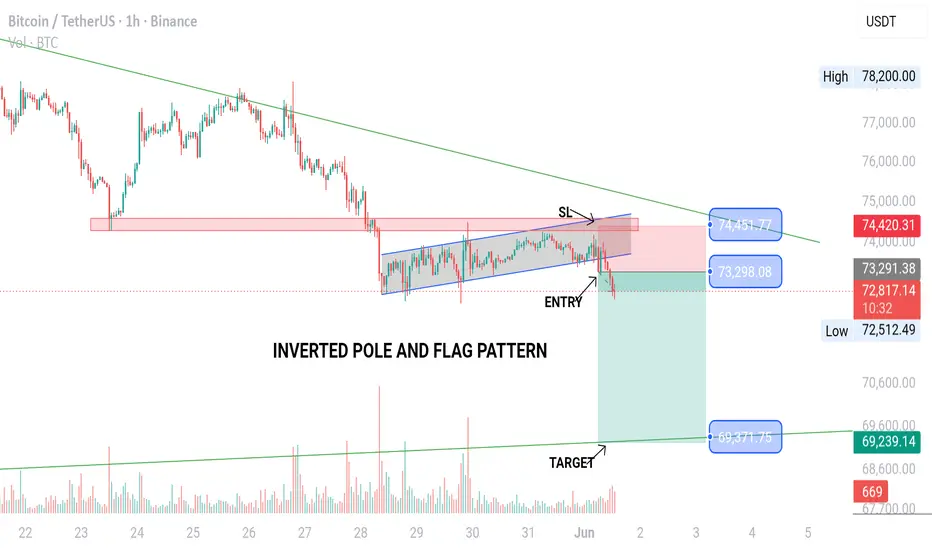
Bitcoin Bearish Continuation | Inverted Pole and Flag PatternBitcoin has triggered a high-probability bearish continuation setup on the H1/H4 timeframes after breaking down from an Inverted Pole and Flag pattern.
Trade Execution Metrics (Given in Chart)
Entry: Short position initiated on the definitive H1 candle breakdown below the ascending channel support.
Stop-Loss (SL): Situated safely above the flag's recent upper boundary and local structural resistance to protect capital against potential fakeouts.
Target (TP): Technical objective locked. Align
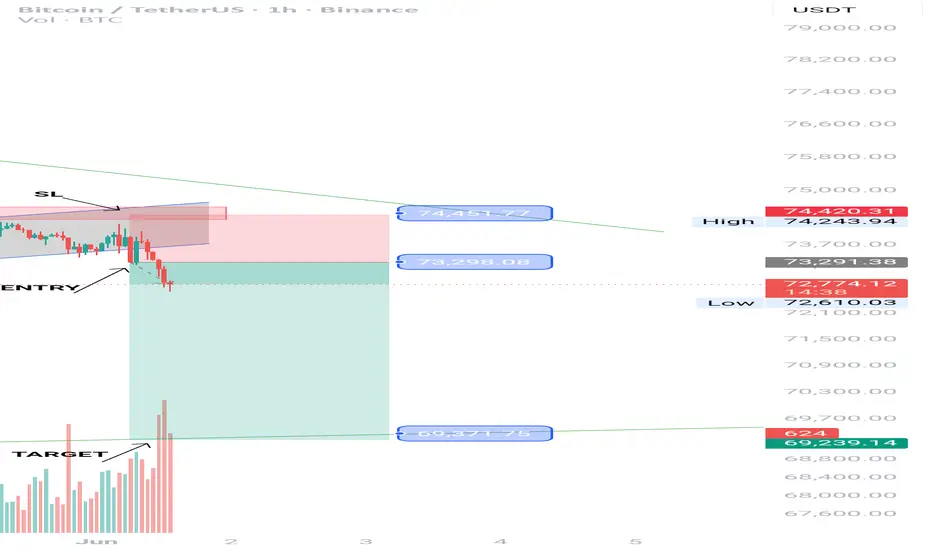
Bitcoin (BTC) Bearish Continuation. Inverted Pole and flag patteBitcoin has triggered a high-probability bearish continuation setup on the H1/H4 timeframes after breaking down from an Inverted Pole and Flag pattern.
Trade Execution Metrics
Entry: Short position initiated on the definitive H1 candle breakdown below the ascending channel support.
Stop-Loss (SL): Situated safely above the flag's recent upper boundary and local structural resistance to protect capital against potential fakeouts.
Target (TP): Technical objective locked. Aligning with a macro
Buy MCX#MCX (Multi Commodity Exchange) Technical Analysis Summary
Current Market Price : ₹8,051.50
Dow Theory Analysis
The chart perfectly demonstrates **Dow Theory principles** in action:
Bullish Structure
Higher Highs : Clear progression from previous peaks
Higher Lows : Each dip maintains above previous lows
Fresh Higher High : Recent peak establishing new uptrend confirmation
Key Technical Levels
Daily Resistance : 8,339.00
Weekly Resistance : 8,901.50
Previous ATH : 9,115.00
Multiple Pattern Con
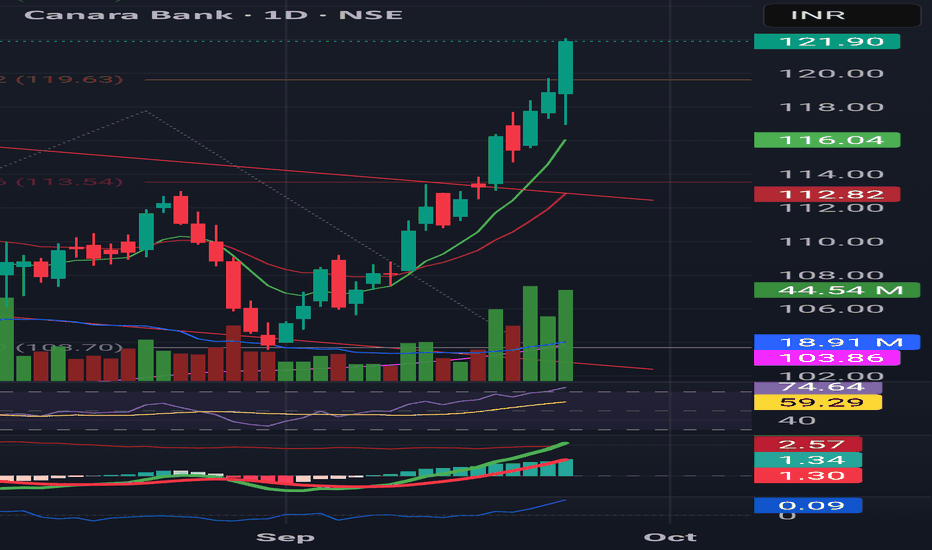
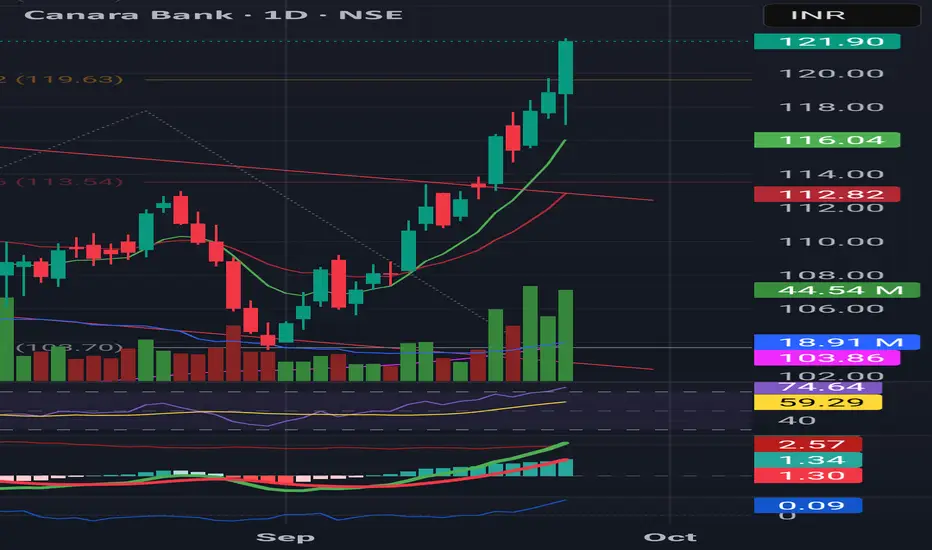
Canara Bank (CANBK)Breakout above ₹119.50 with strong volume confirms momentum.
Entry Zone: Near breakout (₹119.50–122)
Stoploss: ATR-based, just below breakout (~₹116)
Targets: ₹129.40 → ₹136.40 (Fib extension)
Macro Drivers:
Hopes of RBI rate cuts after Fed dovish stance
Stronger economic data supporting financials
Robust domestic credit growth
GST boost to liquidity
PSU Bank sector leadership
👉 Setup looks solid for continuation, provided volumes sustain.
MOBIKWIK : Breakout Candidate#MOBIKWIK #chartpattern #flagandpolepattern #chartpatternbreakout #swingtrade
MOBIKWIK : Swing Trade
>> Breakout Candidate
>> Chart pattern Visible
>> Flag & Pole Pattern
>> Volume Contraction
>> Good Strength in Stock
Swing Traders can lock profit at 10% and keep Trailing
Please Boost, comment and follow us for more Learnings.
Disc : Charts shared are for learning purpose only, not a Trade recommendation. Do your own research and consult your financial advisor before taking any position.
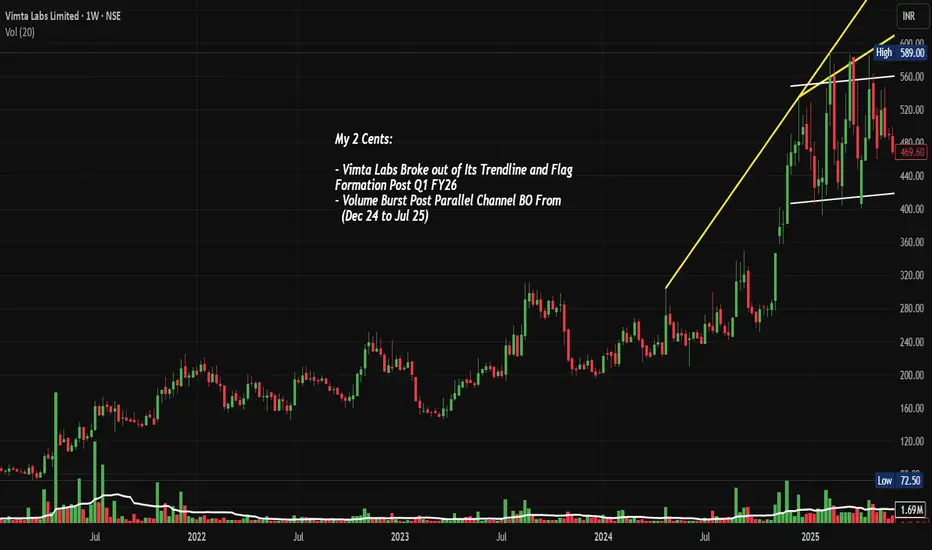
VIMTALABS: Parallel Channel & Flag BO, Chart of the WeekNSE:VIMTALABS Explodes 50%: From Parallel Channel Prison to Trendline Freedom Post Q1 FY26 Flag Breakout. Let's analyse it in the "Chart of the Week"
As per the Latest SEBI Mandate, this isn't a Trading/Investment RECOMMENDATION nor for Educational Purposes; it is just for Informational purposes only. The chart data used is 3 Months old, as Showing Live Chart Data is not allowed according to the New SEBI Mandate.
Disclaimer: "I am not a SEBI REGISTERED RESEARCH ANALYST AND INVESTMENT ADVISER
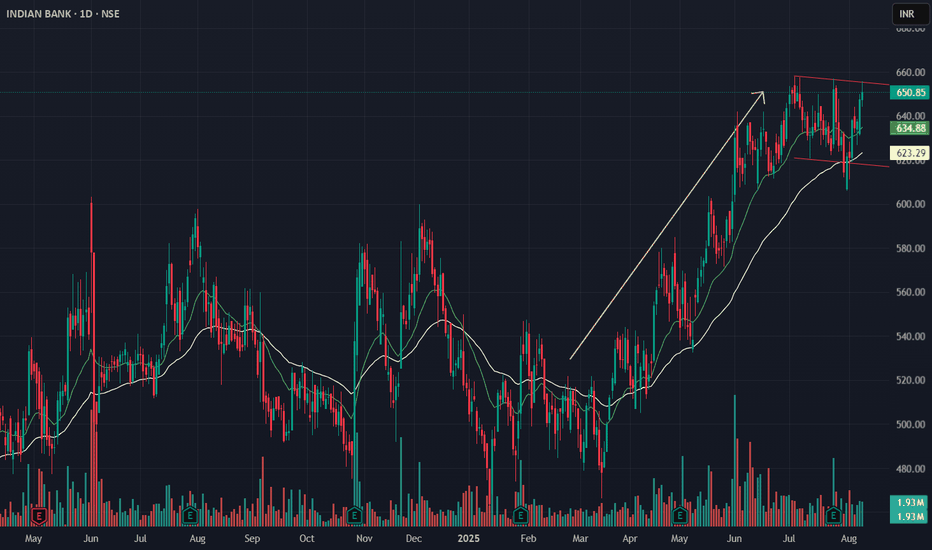
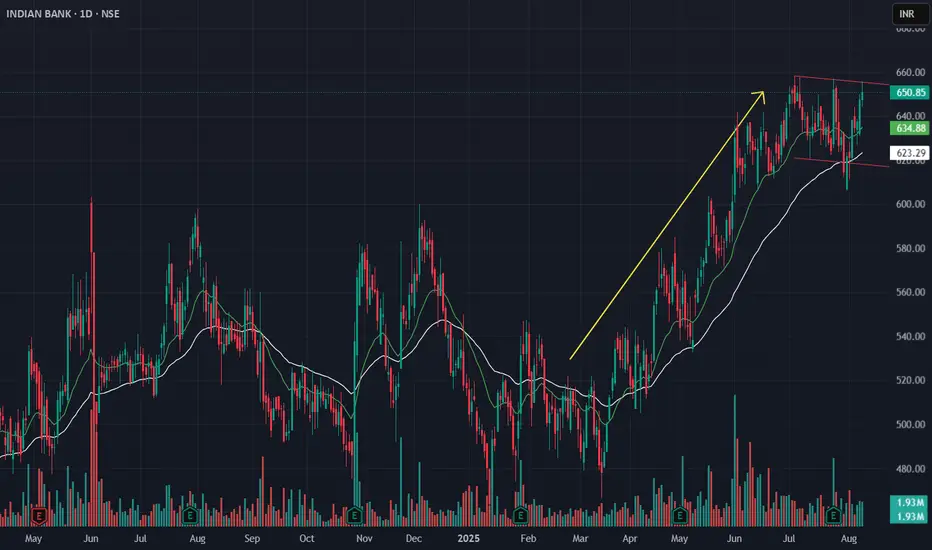
Indian Bank – Flag Breakout Setup from Sector Rotation ScreeningIn the latest sector rotation review, PSU Banks moved into the Improving quadrant, showing early signs of leadership. Within this space, Indian Bank was shortlisted based on:
-- Alignment of 9 EMA & 21 EMA across daily and weekly timeframes
-- MACD trending positively
-- EFI (Elders Force Index) showing accumulation on higher timeframes
Technical Structure:
On the Daily and Weekly charts, Indian Bank is consolidating in a flag pattern after a strong uptrend. The EMAs are acting as dynamic s
Against the Herd: My CAMS Big Short Moment at ₹4,000?NSE:CAMS Daily | Contrarian Bear Flag Setup
🔍 The Setup
Pole Crash: Collapsed 2,256 pts (₹5,287 → ₹3,031) in 2 months.
Flag Trap: Now stuck in ₹4,000–4,500 range (bulls in denial 😴).
Trigger: Daily close < ₹4,000 = breakdown confirmed!
Void If: Price climbs > ₹4,500 (run away 🏃♂️).
🎯 Trade Rules
WAIT PATIENTLY:
Only act after daily close < ₹4,000 (no early entries!).
SELL THE BOUNCES:
Short every pullback to ₹3,900–4,000 (zombie rallies).
PROFIT TARGETS:
Quick exit at ₹3,500 (bank 12%)
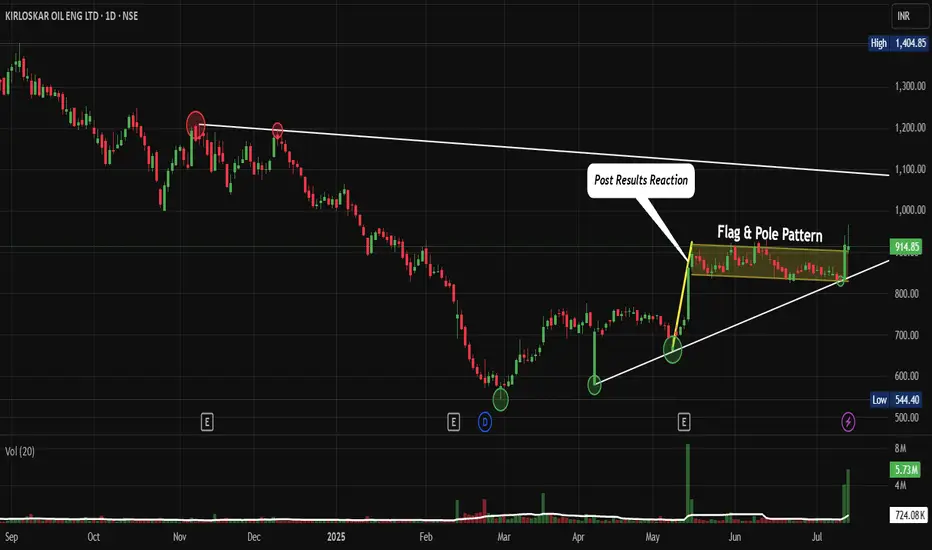
KIRLOSENG: Post-Results Breakout and Consolidation. F&P PatternNSE:KIRLOSENG : How This Hidden Gem Could Be Your Next Big Winner After Post-Results Breakout and Consolidation Let's Analyze in my "Chart of the Week"
Price Action:
- The stock shows a classic recovery pattern from March 2025 lows around ₹590-600
- Current price at ₹914.85 represents a significant 52% recovery from the March bottom
- The stock has been forming higher lows since March, indicating underlying strength
- Recent breakout above the ₹850 resistance level with strong volume confirm
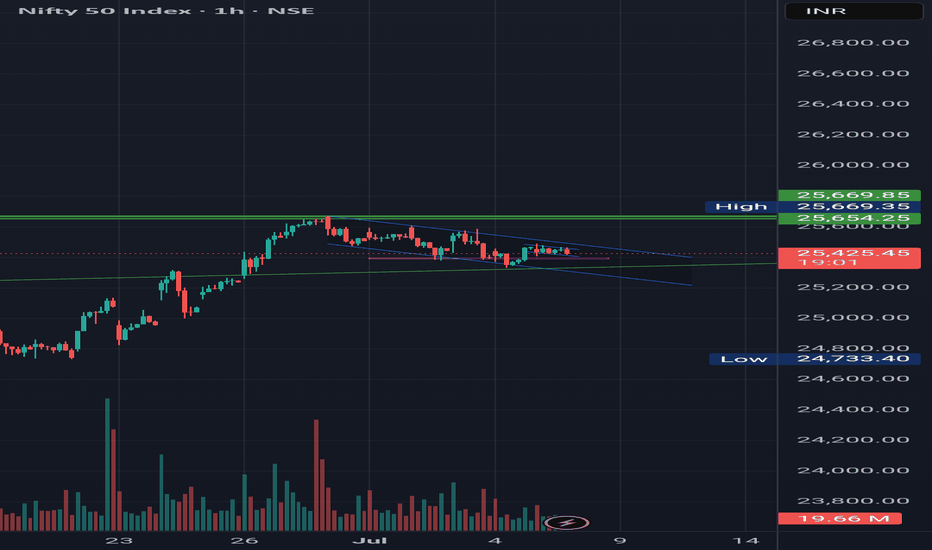
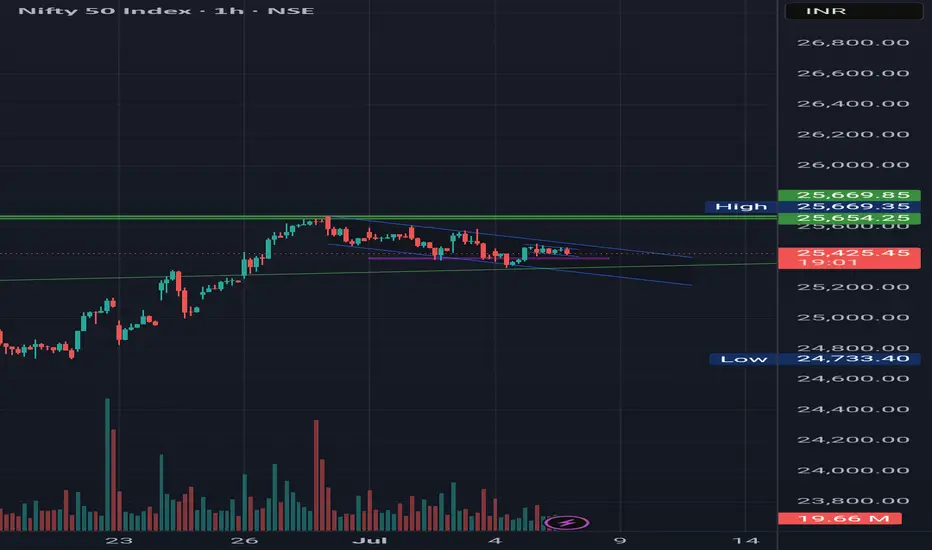
Nifty in a pole and flag pattern consolidation or M pattern.Nifty is in consolidation range waiting for the India US trade deal which has deadline of 9th july.
Based on the news the pattern can be made as Pole and flag if the news becomes positive.
Else, can make M pattern if deal doesn't happen.
Both side good targets are available.
Note: This analysis is for Educational Purpose Only. Please invest after consulting a professional financial advisor.
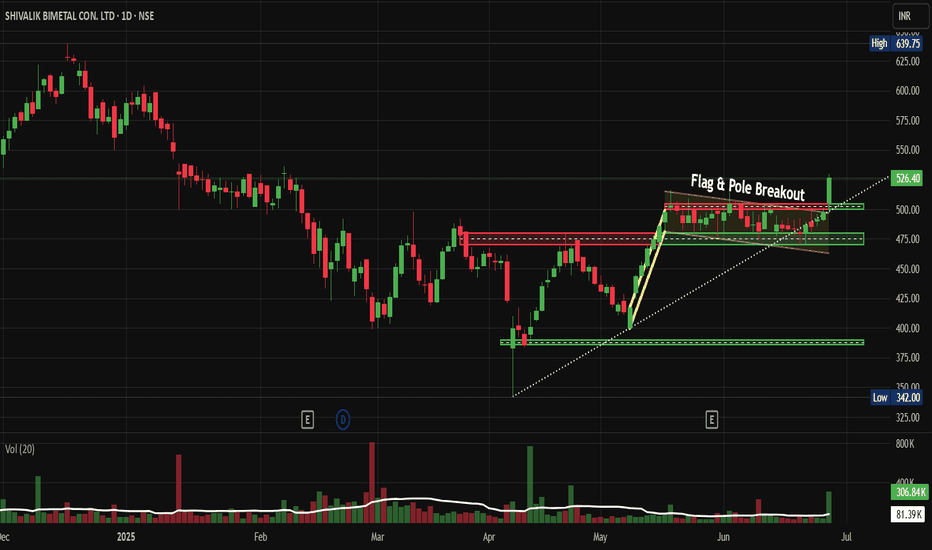
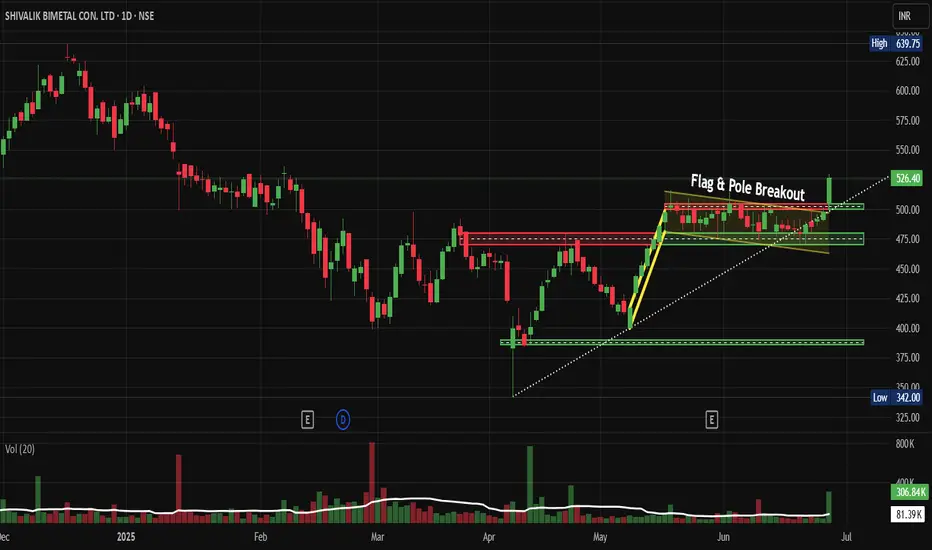
Shivalik Bimetal Controls Breaks Out Flag & Pole Pattern NSE:SBCL Breaks Out: Flag Pattern Signals Bullish Momentum in Speciality Metals Space
Price Action Analysis:
- Current Price: ₹526.40 (as of June 26, 2025)
- Daily Gain: +29.05 (+5.84%)
- 52-Week High: ₹639.75
- 52-Week Low: ₹342.00
- Trading Volume: 306.84K (compared to 20-day average of 81.39K)
Volume Spread Analysis:
- Breakout Volume: 306.84K (nearly 4x the 20-day average)
- Volume Confirmation: Strong volume surge supports genuine breakout
- Volume Pattern: Declining volume during fl
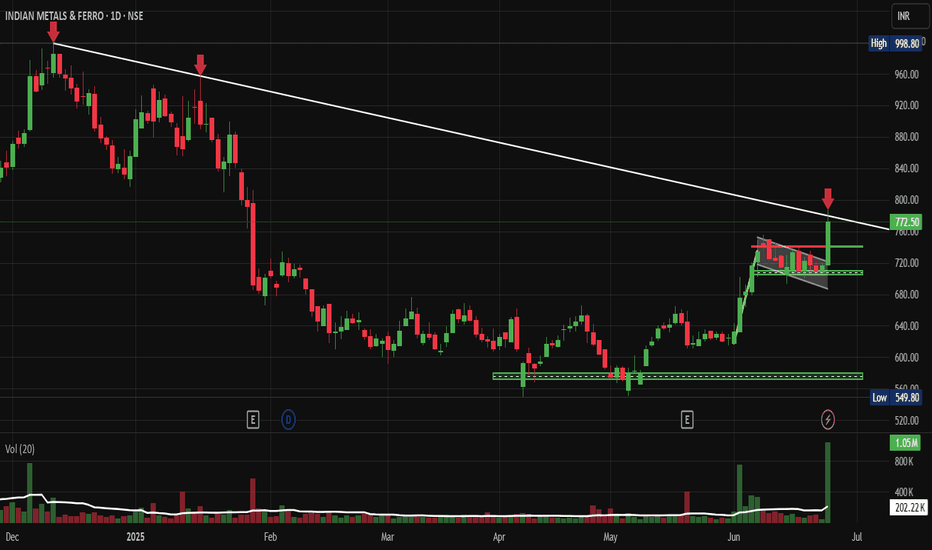
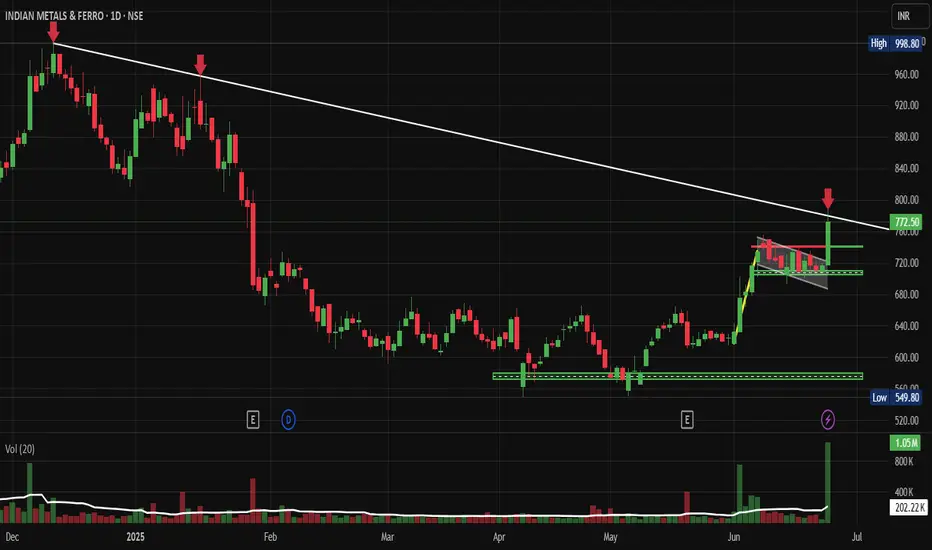
Indian Metals & Ferro Alloy: Flag & Pole BONSE:IMFA Breaks out of the Flag & Pole Pattern with Huge Volumes today.
Price Action Analysis:
- Stock experienced a significant decline from highs around 998.80 to lows near 549.80, representing approximately a 45% correction
- Recent breakout above 720 levels shows strong momentum reversal
- Current price at 772.50 (+ 7.77%) indicates bullish sentiment returning
- Higher highs and higher lows pattern emerging on the right side of the chart
Volume Spread Analysis:
- Volume spike coincidi
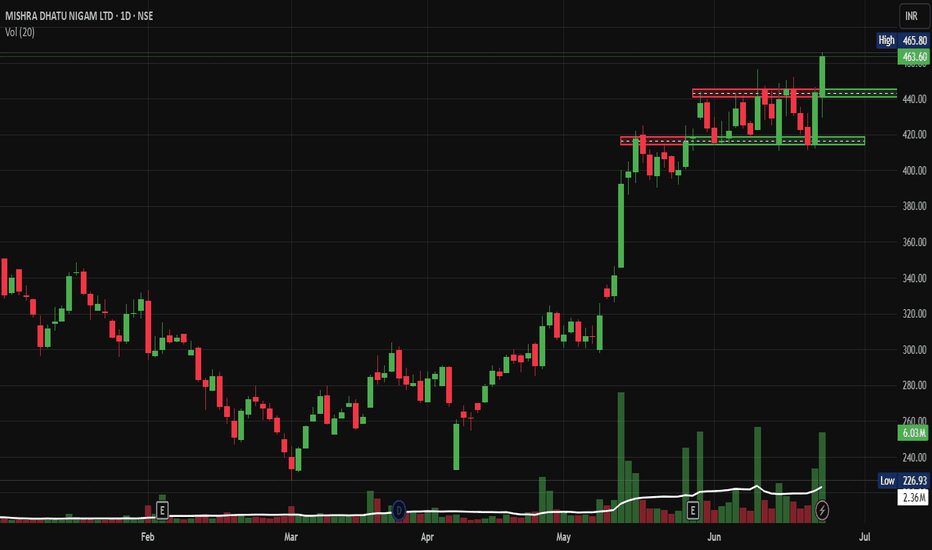
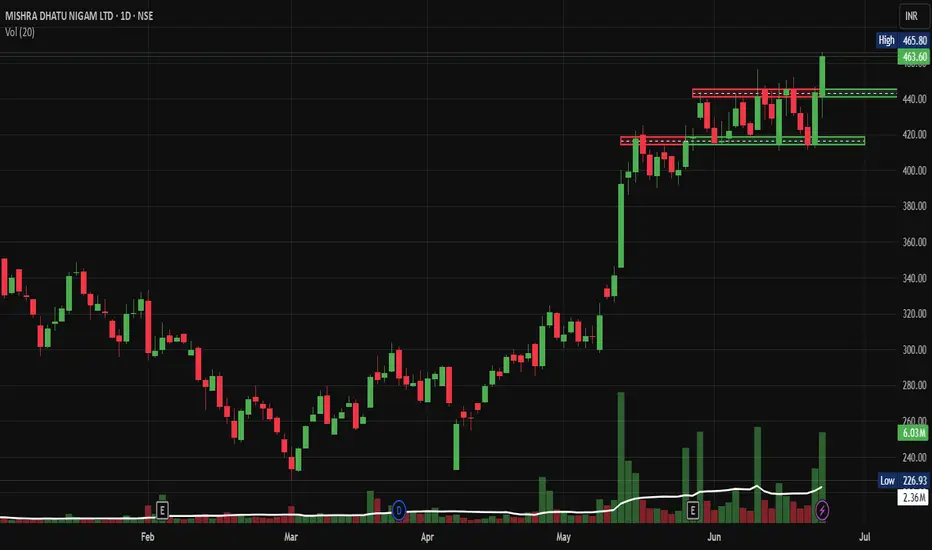
Midhani: Breaks Out of Consolidation: Ready for Lift-Off ?NSE:MIDHANI Breaks Out of Consolidation: A Technical Powerhouse Ready for Lift-Off ?
Price Action Analysis:
- Current Price: ₹463.60 (as of June 23, 2025)
- Price Movement: +20.30 points (+4.58%) on the day
- The stock has demonstrated a spectacular breakout from a lengthy consolidation phase
- Sharp vertical surge from ₹340 levels to current highs of ₹463.60
- Strong momentum evident with substantial volume expansion
Volume Spread Analysis:
- Current Volume: 6.03M shares (significantly e
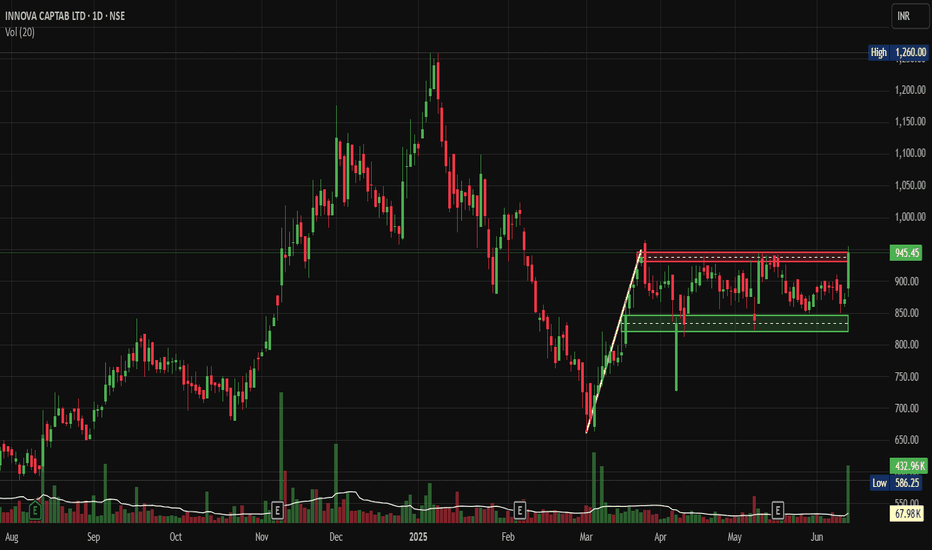
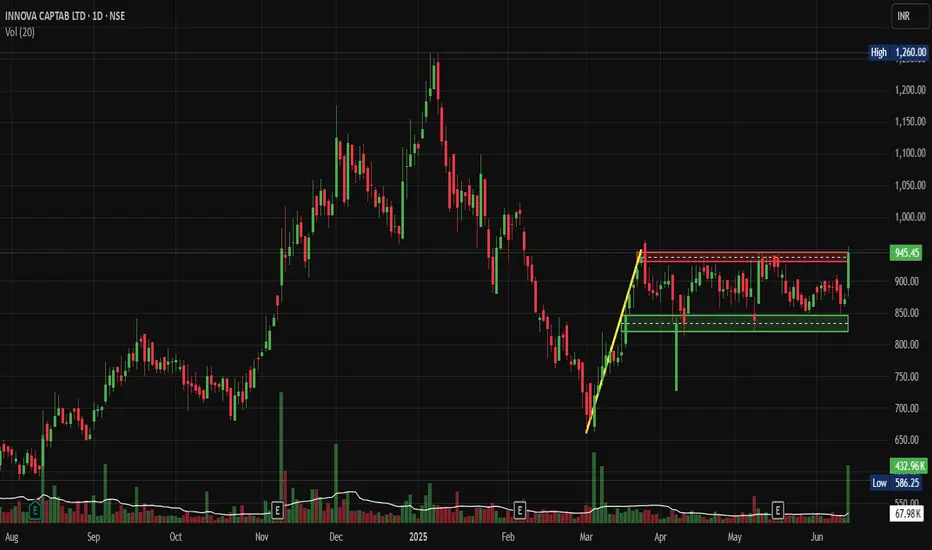
Innova Captab: Flag & Pole BO Pattern Could Signal Major Moves.NSE:INNOVACAP : This Pharma Stock's Flag & Pole Breakout Pattern Could Signal Major Moves Ahead
Price Action Analysis:
- Current Price: 945.45 INR (up 8.44% from previous close)
- 52-week Range: 586.25 (Low) to 1,260.00 (High)
- Stock has been consolidating in a rectangular pattern between 800-950 levels since March 2025
- Recent breakout above 945 resistance suggests renewed bullish momentum
- Price action shows a higher low formation, indicating underlying strength
Volume Analysis:
- Vo
Dhani BO: Ready for Its Next Rally After 80% Correction?NSE:DHANI Breakout: Is This Med/Fin Tech Stock Ready for Its Next Rally After 80% Correction?
Price Action Overview:
- Stock has undergone a significant correction from highs of ₹109.88 to lows of ₹47.05, representing nearly a 57% decline
- Currently trading at ₹71.09 with recent bullish momentum showing +14.42% gains
- Price action suggests a potential bottoming process after prolonged consolidation
Volume Spread Analysis:
- Significant volume spikes observed during major price movements
DLong
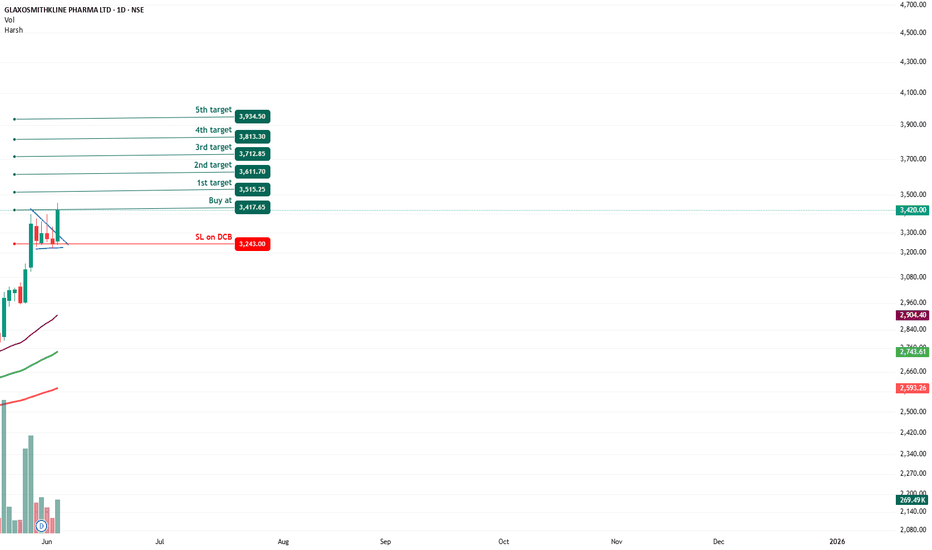
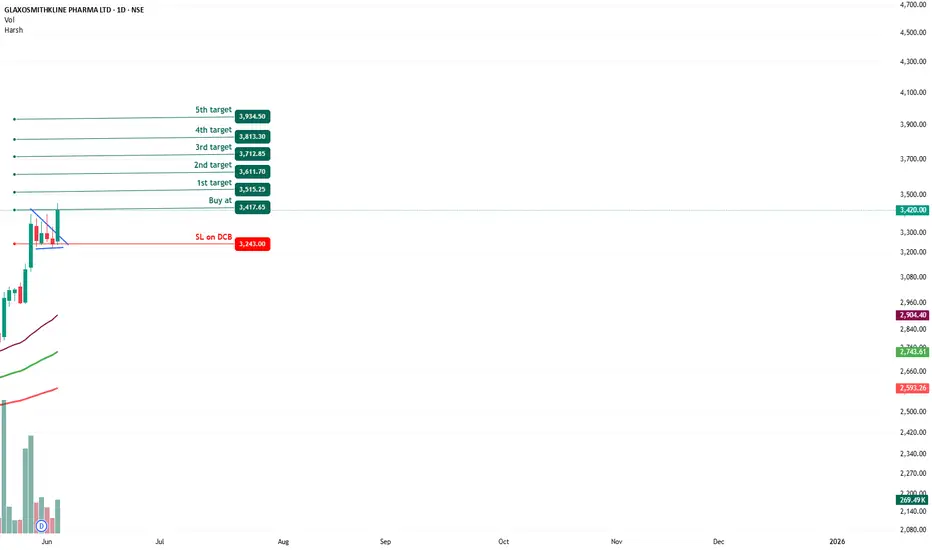
GLAXOSMITHKLINE - Bullish Flag & Pole Breakout (Daily T/F)Trade Setup
📌 Stock: GLAXOSMITHKLINE PHARMA ( NSE:GLAXO )
📌 Trend: Strong Bullish Momentum
📌 Risk-Reward Ratio: 1:3 (Favorable)
🎯 Entry Zone: ₹3417.65 (Breakout Confirmation)
🛑 Stop Loss: ₹3243.00 (Daily Closing Basis) (-5.25% Risk)
🎯 Target Levels:
₹3515.25
₹3611.70
₹3712.85
₹3813.30
₹3934.50 (Final Target)
Technical Rationale
✅ Bullish Flag & Pole Breakout - Classic bullish pattern confirming uptrend continuation
✅ Strong Momentum - Daily, Weekly & RSI >60 (Bullish zone)
✅ Volume Confirma
IXIGO : Breakout candidate (swing pick)#IXIGO #chartpatterntrading #flagpattern #breakoutstock #Chartpatternbreakout
IXIGO : Swing Trade
>> Long Range Consolidation Breakout Soon
>> Flag pattern breakout
>> Good Strength in stock
>> Recent Volume buildup is good
>> Good Upside Potential
Swing Traders can lock profit at 10% and keep trailing.
Disc : Stock charts shared are for Learning purpose, not a Trade recommendation.
Consult a SEBI Registered Advisor before taking position in it.
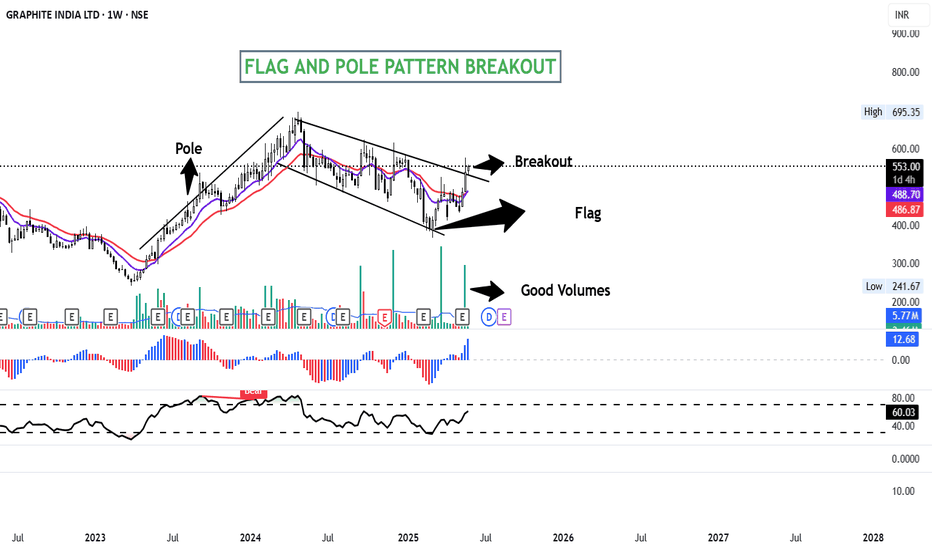
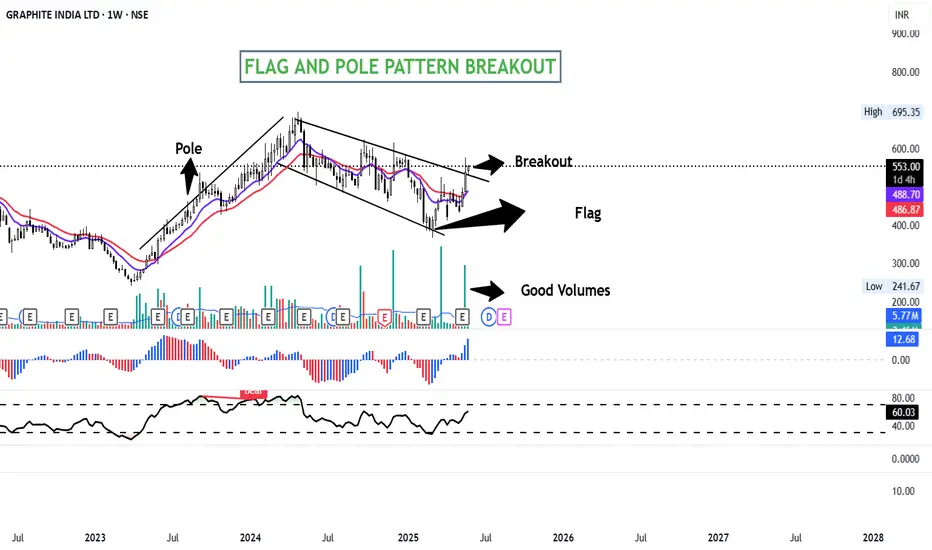
GRAPHITE INDIA- FLAG AND POLE PATTERN BREAKOUT ( BULLISH)GRAPHITE INDIA has formed a FLAG AND POLE pattern on the weekly charts and has given a breakout with good volume.
The "flag and pole pattern" in technical analysis is a chart pattern that signals a potential continuation of an existing trend. It's characterized by a sharp, initial price movement (the "pole") followed by a period of consolidation (the "flag") within a defined range. A breakout from this range, in the same direction as the initial pole, suggests a likely continuation of the origi
APL Apollo Tubes - Flag & Pole BONSE:APLAPOLLO gave a Flag & Pole Breakout today. Post Q4 Results.
Con-Call Highlights:
MARCH-QUARTER CONSOL TOTAL REVENUE FROM OPERATIONS 55.09 BILLION RUPEES
MARCH-QUARTER CONSOL PROFIT 2.93 BILLION RUPEES
SEES TOTAL CAPACITY OF 6.8 MILLION TONS BY FY28
SEES CAPEX OF 15 BILLION RUPEES IN NEXT 3 YEARS
Keep in the Watchlist.
NO RECO. For Buy/Sell.
Disclaimer: "I am not a SEBI REGISTERED RESEARCH ANALYST AND INVESTMENT ADVISER."
This analysis is intended solely for informational and educati
CarTrade Tech- CnH FnP. Keep on Radar📊 CarTrade Tech - Technical Analysis 🚗
Reason for Picking This Stock:
CarTrade Tech has been in an uptrend since March 2023, trading within a rising channel. The stock tends to take support near the 50 DMA and the channel bottom, showcasing strong demand in those areas.
✨ Key Highlights:
1️⃣ Breakout from 3.5-Year Resistance: The stock has broken above a significant 3.5-year-old resistance level of ₹1,622.85 and gave a weekly closing above it.
2️⃣ Chart Patterns:
Cup and Handle (CnH) form