Will SOLUSDT’s Breakout Trigger the Next Bullish Wave?Yello Paradisers! SOLUSDT has delivered an impressive move, breaking out of a descending channel—commonly referred to as a bull flag in higher timeframes. This formation typically signals continuation after a period of consolidation, where the channel resembles a flag following a strong bullish pole.
💎If SOLUSDT retests the broken resistance zone and forms a bullish I-CHoCH (Internal Change of Character) in lower timeframes, this would significantly increase the probability of a continuation to
Flag
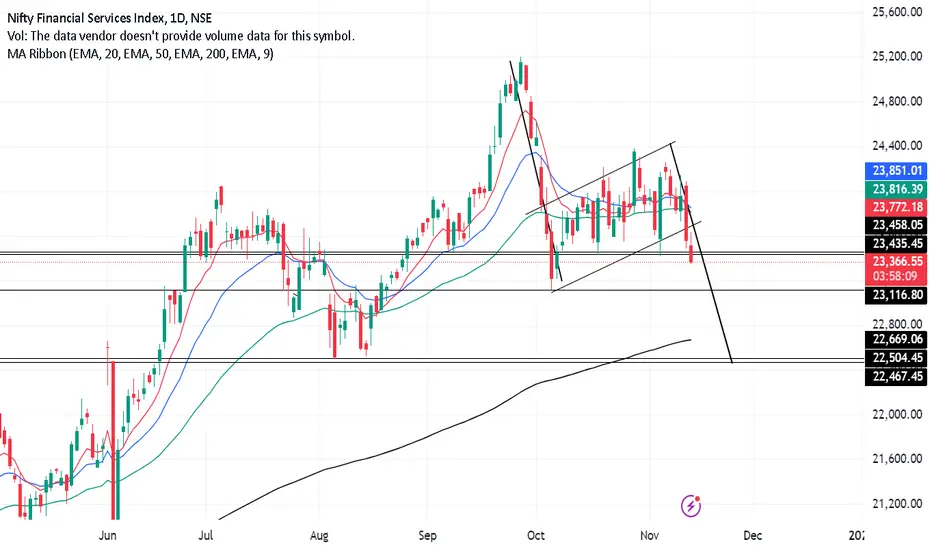
BEARISH FLAG IN BANK NIFTY - TIME FOR A SHORT TRADE ?Symbol - BANKNIFTY
CMP 51350
BankNifty has turned its trend from bullish to bearish & sideways making lows - lows on daily time frame & It was trading in a bearish channel. We can see a Bearish Flag pattern getting formed in BankNifty. Such patterns on larger time frame don't usually fail. BankNifty is currently trading near break down trendline of this pattern. Breakdown & sustaining below this trendline zone 51150 - 51000 will get this pattern activated & we can see big target towards downsi
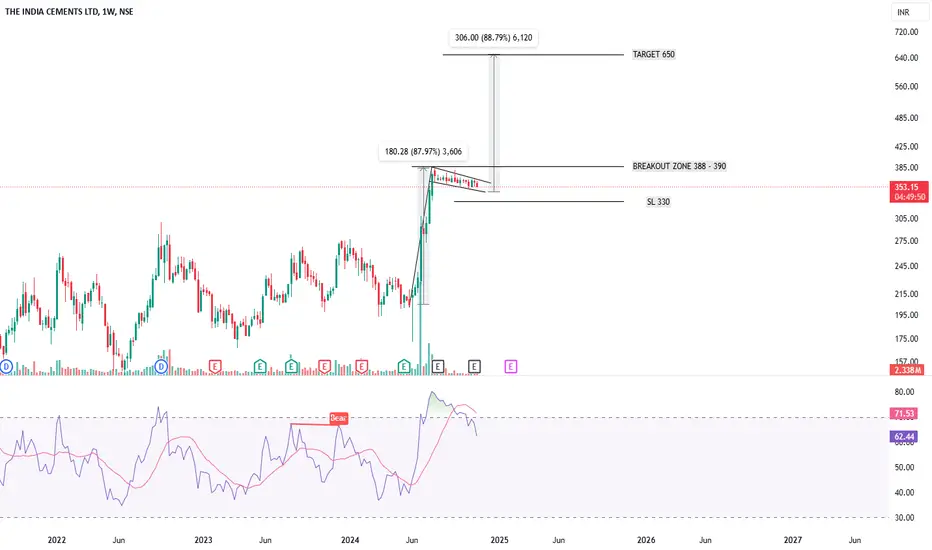
BULL FLAG PATTERN IN INDIA CEMENTS - POSITIONAL LONG TRADESymbol - INDIACEM
CMP - 353
India Cements is forming a Bullish Flag pattern after a good run. It is consolidating at higher levels & buyers are looking strong & not giving up. Breakout of this Flag pattern can lead the stock price towards 650 which is approx. 90% upside from current price. I have made a long position at CMP and will add more position around 390, which is breakout zone. Stoploss I am following is 330.
Disclaimer - Do not consider this as a buy/sell recommendation. I'm shar
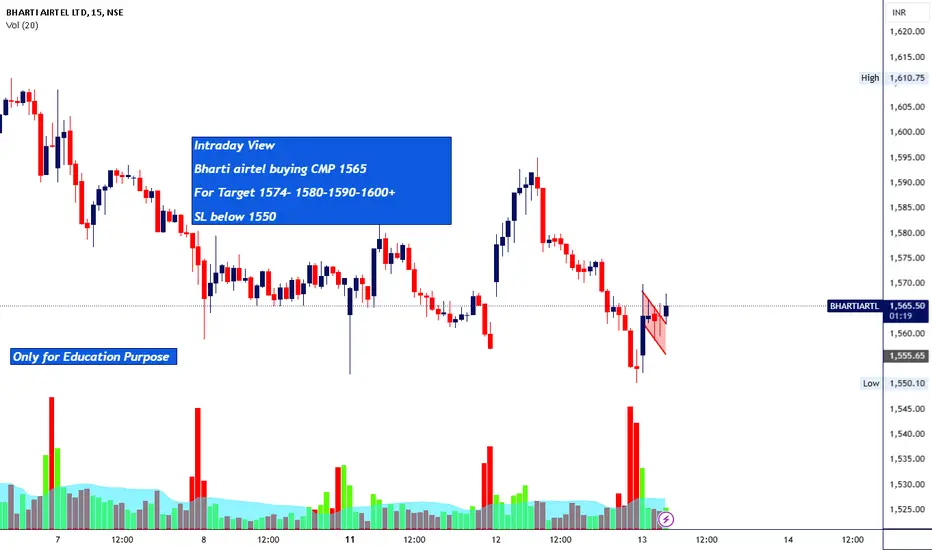
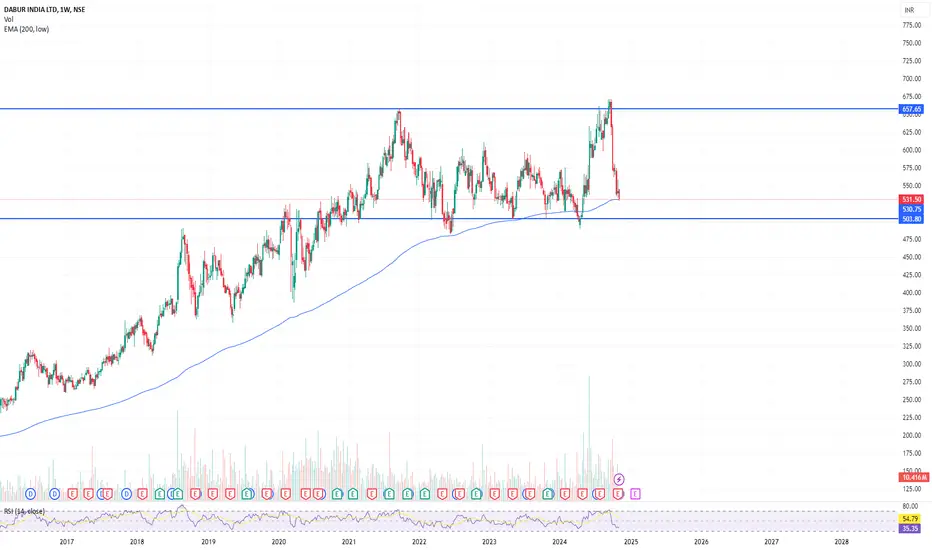
Morning Star + Flag pattern - Trend ReversalMorning Star - The Morning Star pattern is a classic bullish reversal pattern in technical analysis. The pattern consists of three candlesticks: two large ones with different directions and a smaller candlestick between them.
Flag Pattern - A sudden move in either direction followed by the price consolidates in a range following the sharp move, and the price then continues to move in the same direction after it breaks out of the range. Its visual resemblance to a flag and a pole
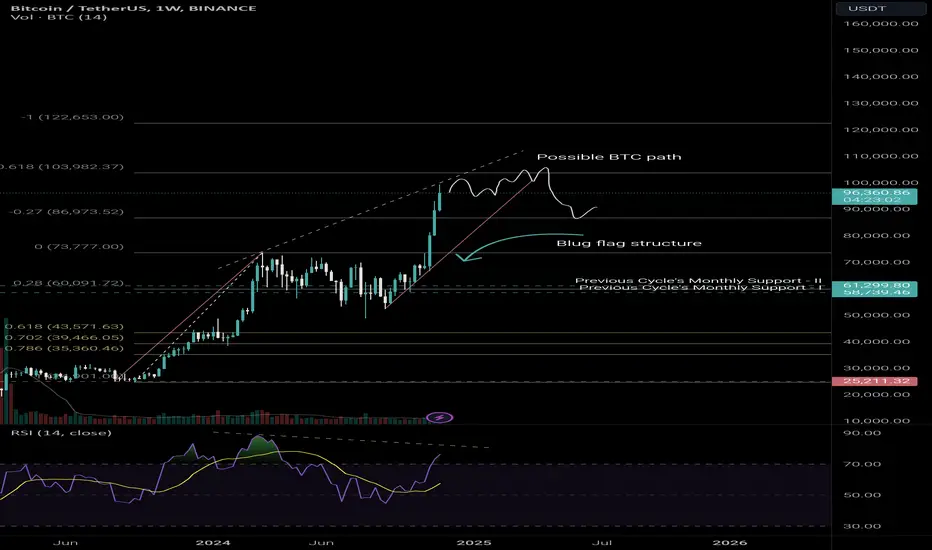
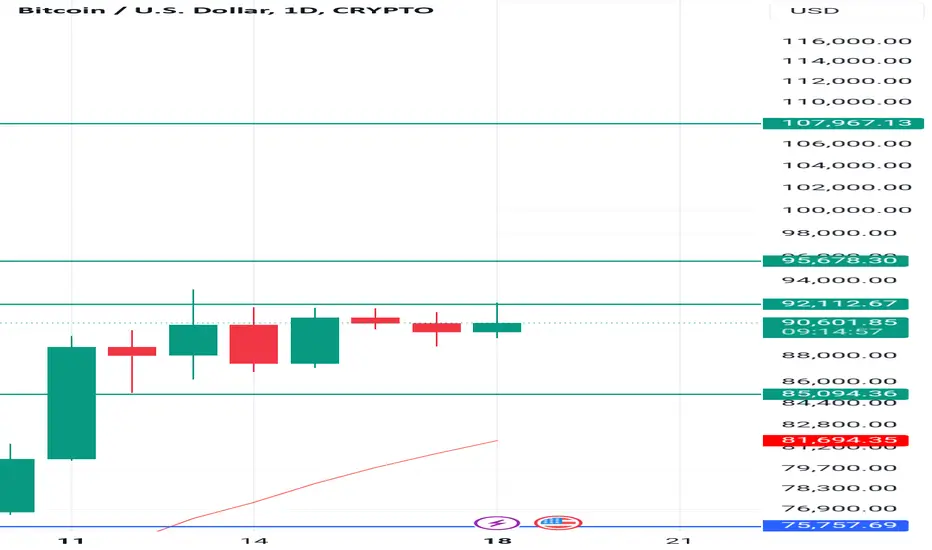
Bitcoin Strategy: Cup & Handle, Flag Pole, Parallel ChannelIf you're aiming to maximize gains using multiple setups across different timeframes, this strategy combines three powerful patterns: the Weekly Cup & Handle, Flag Pole, and Daily Parallel Channel. Here’s how to execute this structured approach for optimal entry, exit, and profit potential.
Weekly Cup & Handle
Timeframe: November 15, 2021 – October 14, 2024
Breakout: Achieved on October 14, 2024
Target: 82,000 (same as the Flag Pole)
The breakout from this long-term Cup & Handle patt
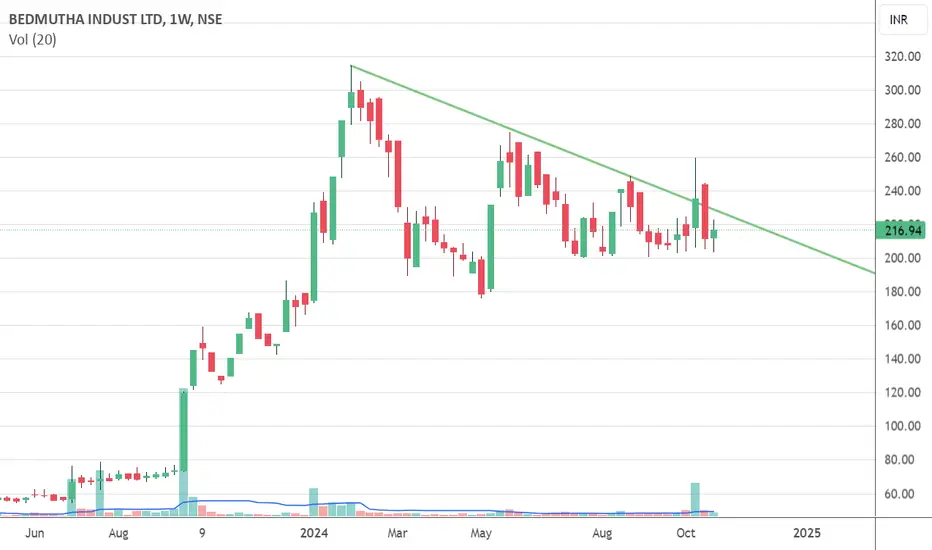
Bedmutha - Flag pattern is nearing completion!Bedmutha gave fantastic breakout around mid-70s to about 300 level during last year, and since then it is consolidating. It is now consolidating for 8-9 months. Stock has recently shown spike of movement in its sleeping volume bars as well.
Bedmutha is yet to give a breakout and unless that is done this stock can sleep for a few more months. Watch this stock for a strong breakout and then 20-50% return in a quick spell.
Disclaimer: I'm not a registered analyst. I'm only sharing my opinion
Accumulate India Cement range 350-370 before Flag pattern breaksIndia Cement Flag And Poll
Forming Flag and Pole pattern, stock has been sideways since last 5 Months.
Nifty correced more than 7 % from its all time high butno correction in stock price.
The pole as formed with huge volumn but in side ways move volume.
Buy accumulate between 350-370
Once breaks out stock could touch price of 560
SL would be 340 on weekly candle closing basis.
Buy Range 350-370
SL 340 weekly candle closing below 340
Target 560+
Medium term trading opportunity in Balu Forge for V. good upsideHi,
NSE:BALUFORGE has given a Bullish Flag Breakout on Weekly charts with very good volume.
MACD is also on the bullish side on Weekly time frames. RSI is also on the bullish side on daily, weekly and monthly time frames.
In the current market scenario, I am expecting that the bullish momentum will continue.
Complete price projection like entry, stop loss and targets mentioned on the charts for educational purpose.
Don't Forget to Follow me to get all the updates.
Please share your
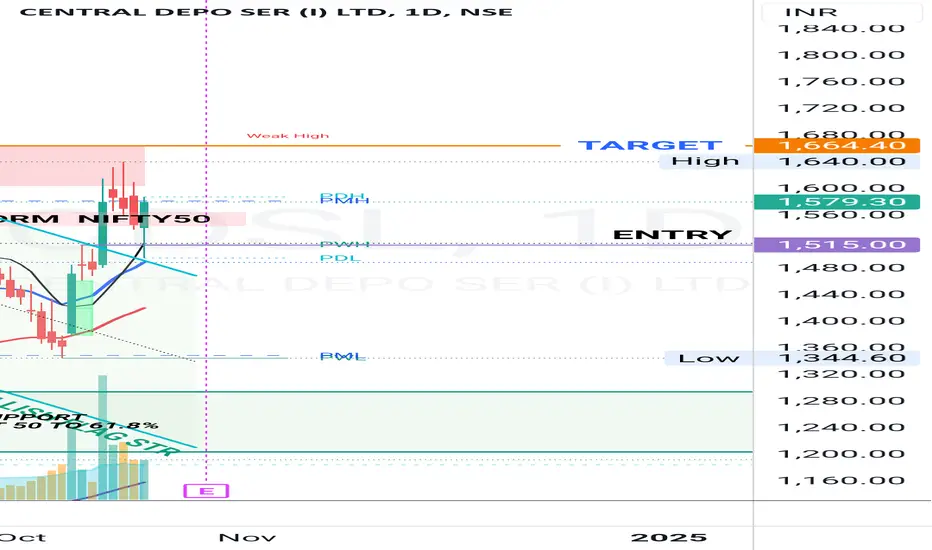
CDSL BULLISH FLAG&POLE BO DTF/WTF SWING/POSITIONAL Refer the chart for details
The stock after a bullish streak has retraced to just above the 50% FIBO/R level.
Its has broken out of the Flag a week ago and now retraced to form a bullish candle indicative of a bullish reversal.
ENTRY can be at current price. Keep SL below the previous week Low.
the standard disclaimer in my other analysis apply.
SURAJEST READY FOR TREND RESUMPTION MOVE NSE:SURAJEST
Pattern: The stock is forming a flag in an uptrend, indicating a potential continuation of the upward movement.
Resistance Level: There is a horizontal resistance above 810, which the stock needs to break to continue its upward trajectory, waiting for an hourly close will be good.
Sector Outlook: The realty sector is poised to zoom up, suggesting a favorable environment for SURAJEST LTD.
Target and stop Levels: Refer to the chart for specific target levels.
Keep learning and