RVNL might move UpsideWith market stabilizing , we might see sector rotation and a potential move in railways sector. These are the technical reason/logic to support it.
1) Higher High and higher low formation indicating UPSIDE momentum
2) Trading above 50 & 20 EMA
3) Gap Cover Pending
4) Volume increased in recent days
5) Higher TF in weekly Pole & flag pattern formation
6) Favorable Risk Reward
(Note: I am neither responsible for anyone's profit or loss nor I'm a sebi registered RA, this only for educational pu
Flag
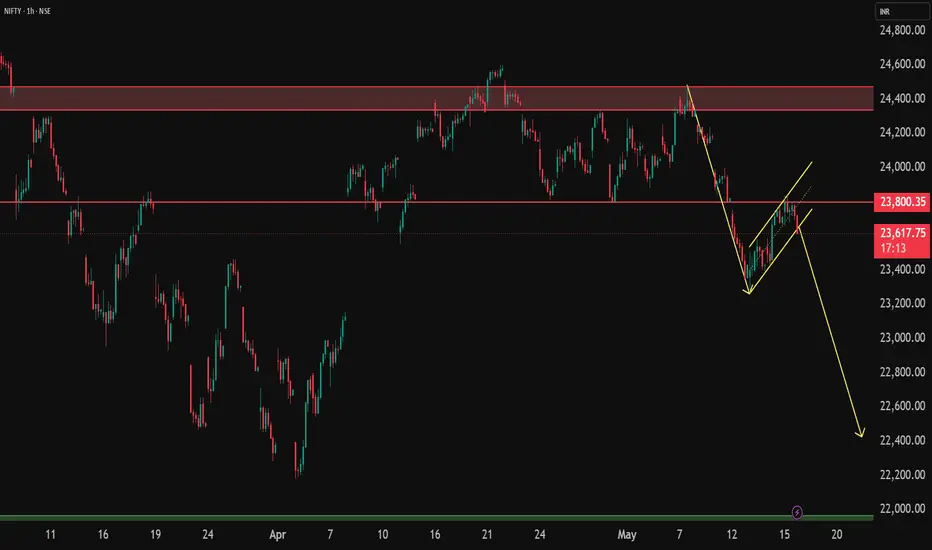
NIFTY INDEX – Technical Research ReportNifty Index is currently forming a Bearish Flag pattern , which is generally considered a bearish continuation setup after a sharp downside move.
Following a strong decline, the index entered a temporary upward consolidation channel, indicating a pause in momentum rather than a reversal. Price is now approaching the lower boundary of the flag structure.
A strong bearish candle closing below the flag support will act as confirmation of the pattern and may indicate continuation of the previous
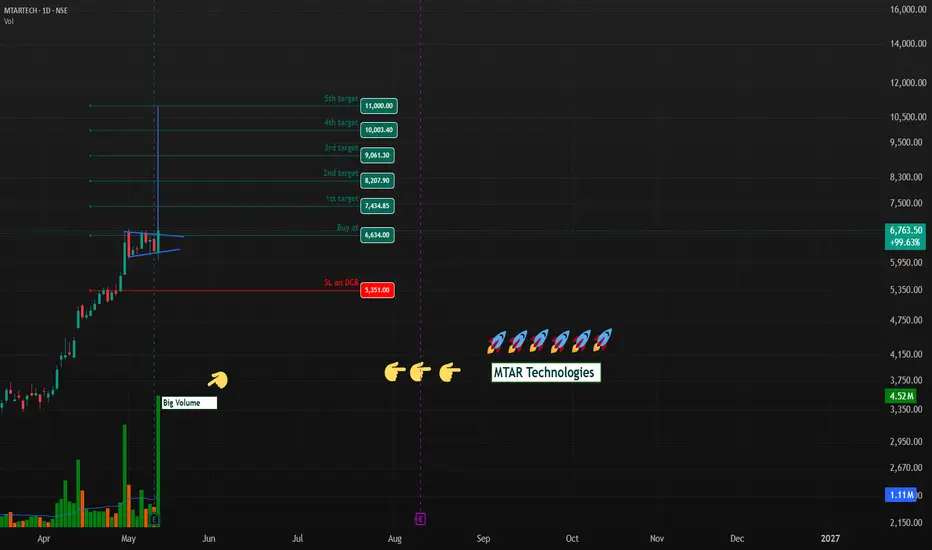
MTAR Technologies Ltd.MTAR Technologies is showing a powerful earnings breakout, with Q4 FY26 revenue up 67% YoY to about ₹306 crore and PAT up 222% YoY to about ₹44 crore, while FY26 revenue rose to about ₹876 crore and FY26 PAT to about ₹94 crore. Management has also turned more constructive on FY27, raising revenue growth guidance to more than 80%, which makes the fundamental setup look stronger than before.
Fundamental view
Last 4 quarters show a mixed-to-strong acceleration pattern: Q2 FY26 was softer, Q3 FY
FORTIS Healthcare | Weekly TF | Bull Flag Continuation SetupFORTIS Healthcare Ltd.
Sector: Health Services/Hospital | Timeframe: Weekly | Bias: Bullish
Setup Type: Bull Flag Continuation Setup
FORTIS is showing a strong long-term bullish structure on the weekly timeframe. After a sharp impulsive rally from the rounding bottom breakout zone near 740, the stock entered a healthy corrective phase and formed a classic Bull Flag pattern.
Now price is attempting a breakout from the falling channel, which could trigger the next leg of the uptrend if mom
Narayana Hrudayalaya - Bullish Flag SetupNarayana Hrudayalaya has recently shown a trend reversal signal after breaking a well-defined downtrend trendline. The breakout was supported by a strong bullish impulse move, indicating a shift from selling pressure to buying strength.
Post breakout, price has entered a Bullish Flag consolidation, where it is moving slightly downward with reduced volume. This type of consolidation typically represents healthy profit booking, not weakness.
Key Observations:
Clear downtrend breakout (Chang
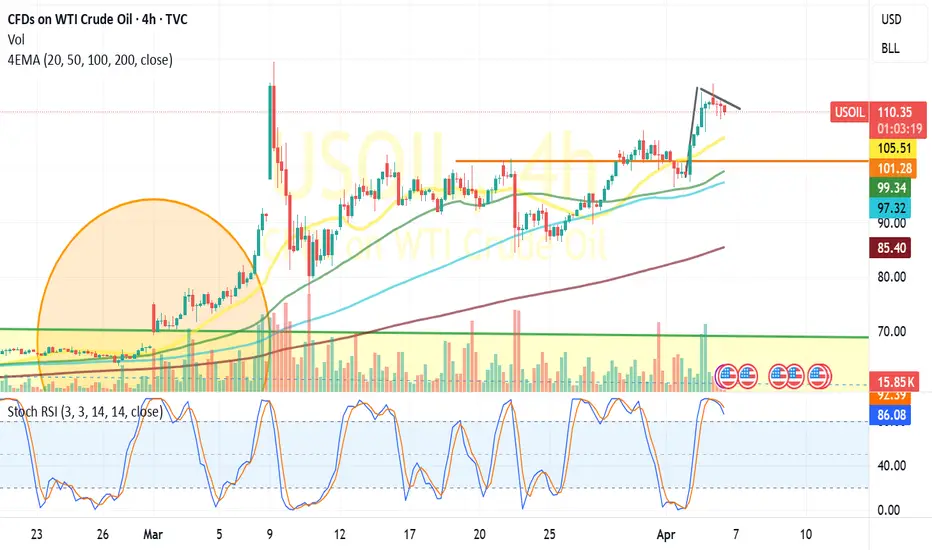
WTI CRUDE-Not Falling Its consolidating only?WTI CRUDE:Trading around 110 USD with 1.1% drop and is still trading above all its critical EMAs Viz 20/50/100/200DEMA.
Till it falls below 105 on a closing basis the threat for a break out exists.
It has formed a Flag pattern in 4-Hrly chart and the neckline resistance falls at 113-115
Decesieve close above 113-115 and neckline breakout may trigger a rally towards 125USD(For educational purpose only)
Silver for A-B-C corrective structureAfter a strong impulsive upmove, Silver appears to have entered a corrective phase.
On the daily chart, price seems to be forming an A-B-C corrective structure within a rising channel.
What the chart suggests:
The sharp fall from the top marks the beginning of the correction.
Price then formed a recovery leg toward (B), but it failed to sustain higher.
The current move looks like the (C) leg, where price is drifting back toward the lower channel support and the highlighted demand zone.
IndusInd Bank – Weekly Bearish Flag Breakdown SetupTitle:
IndusInd Bank – Weekly Bearish Flag Breakdown Setup 📉
Description:
On the weekly timeframe, IndusInd Bank appears to be forming a classic Bearish Flag continuation pattern after a strong impulsive decline.
🔎 Structure on the chart
• A sharp downward move forming the flagpole after the major top.
• Price then entered a rising consolidation channel, which often represents a counter-trend pause in a broader downtrend.
• The structure now approaches a critical confluence zone where the ri
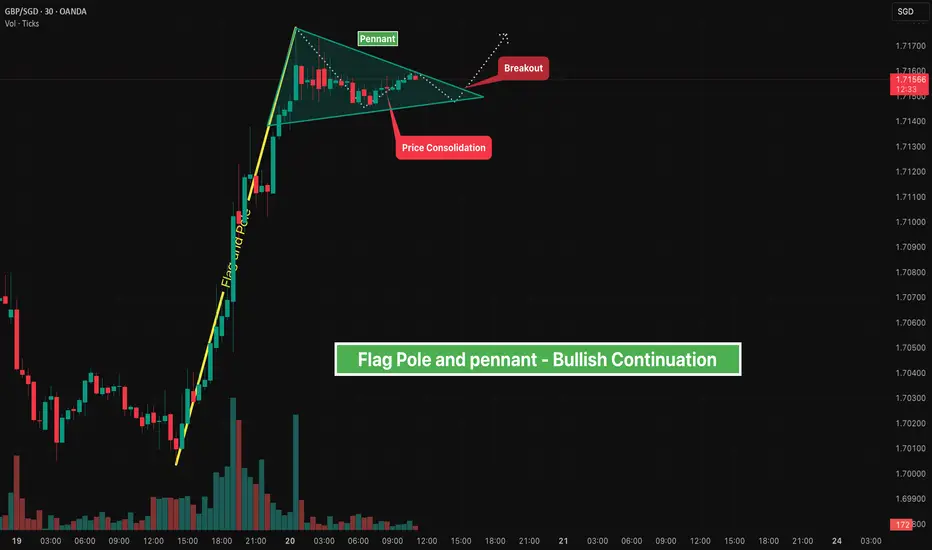
Flag Pole and Pennant - Bullish ContinuationOverview
This chart shows a classic Bullish Pennant pattern forming after a strong impulsive upward move.
• The sharp vertical rise represents the Flag Pole, showing strong buying momentum.
• After this move, price enters a small triangular consolidation, forming the Pennant.
• This consolidation reflects a temporary pause where the market absorbs the previous rally.
⸻⸻⸻⸻⸻⸻⸻⸻⸻⸻
📊 Chart Highlights
• Strong bullish flag pole before consolidation.
• Pennant structure showing tightening p
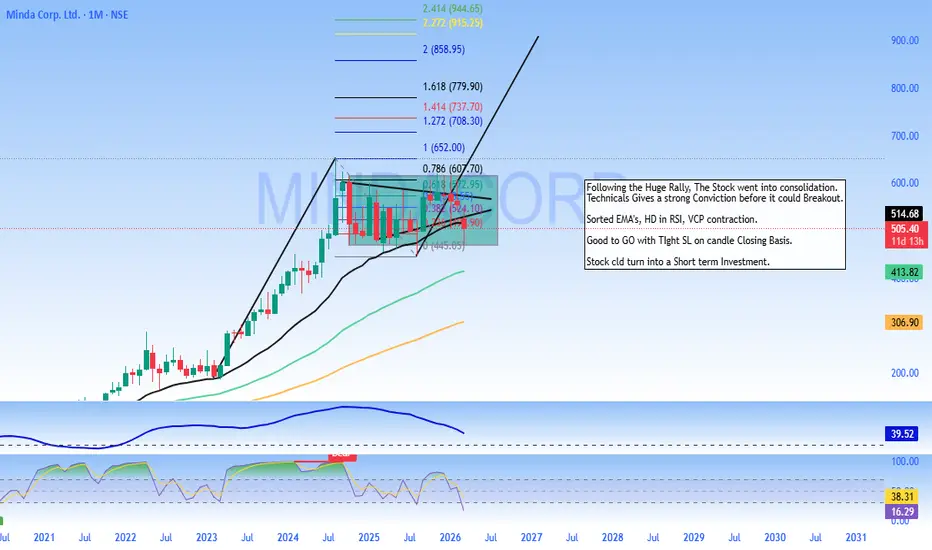
Shortterm Investment - Buy MindaCorpHere's a breakdown of the **positives for buying Minda Corporation (MINDACORP) as a Short-term investment**:
Apart from the Strong Technical, added the following Fundamentals of the Stock.
**Strong & Growing Financials**
Net profit has risen for four consecutive quarters, growing from ₹52 Cr to ₹85.7 Cr, with an average quarterly increase of around 14.8%. Revenue has also grown for five straight quarters, averaging 5.2% growth per quarter.
**Record Revenue Performance**
The company recently p
GOLD PLUNGING TO 4.850-4,890 NEXT WEEK - KEY REASONS!!Current price ~$5,020/oz, strong bearish momentum in play.
Macro factors (simple breakdown):
US rates high + Fed hawkish: Solid US economy, inflation still sticky, strong jobs data → Fed not rushing to cut rates (possibly hold until summer 2026), even more hawkish due to oil spike risks from Iran conflict. Opportunity cost of holding gold explodes (you miss out on yields from USD or bonds).
Money flowing to stocks: US equities (S&P, Nasdaq) hitting record highs → investors chase high-risk
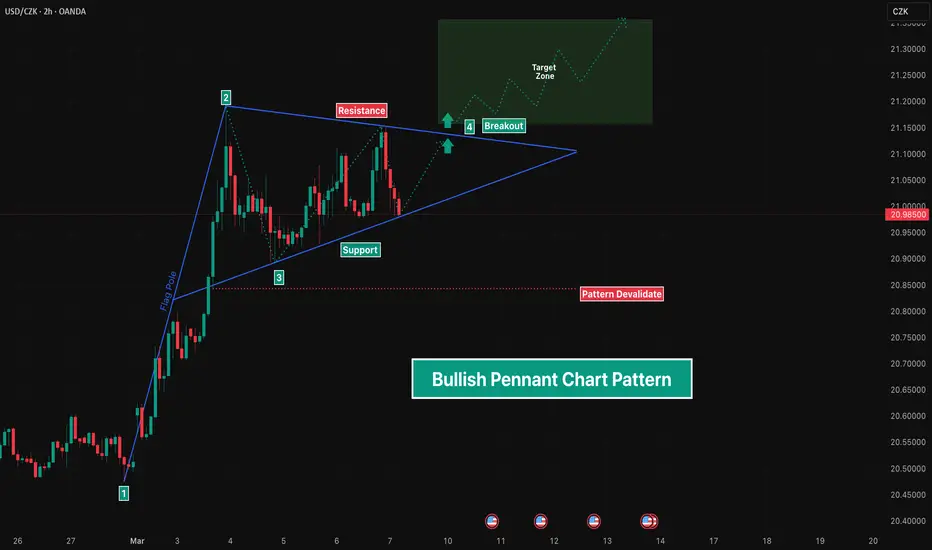
Bullish Pennant Chart PatternOverview
A Bullish Pennant is a continuation pattern that forms after a strong upward price movement. It represents a brief consolidation phase where the market pauses before potentially continuing in the direction of the prevailing trend.
The pattern consists of a sharp impulsive rally known as the flagpole, followed by a small symmetrical triangle consolidation called the pennant. When price breaks above the upper boundary of the pennant, it often signals continuation of the uptrend.
⸻⸻⸻⸻⸻
GRM Overseas (D): Possible Flag & PoleBased on the latest market data as of March 2, 2026, GRM Overseas Ltd (GRMOVER) is currently exhibiting a short-term bearish but long-term bullish structure on the daily timeframe. The stock has recently undergone a minor correction and is consolidating near key support levels.
The structure on the daily timeframe does resemble a Flag and Pole pattern, though it is currently in a critical "make-or-break" phase.
Price Action & Trend Analysis
As of the last close on March 2, 2026, the stock
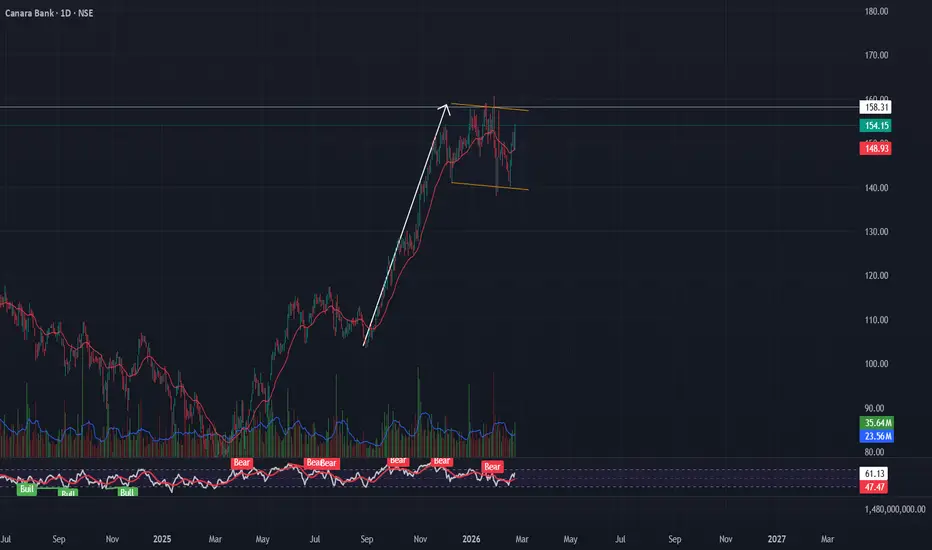
Canara Bank in a flag patternCanara Bank
Structure: Flag Pattern in Uptrend
-Breakout Level: 158.50
-Target: 214
-Stop Loss: 148.50
Why it matters:
Strong prior impulse move → consolidation → continuation setup.
Volume supportive on upswings.
Risk: If broader PSU momentum fades, flag may break downward.
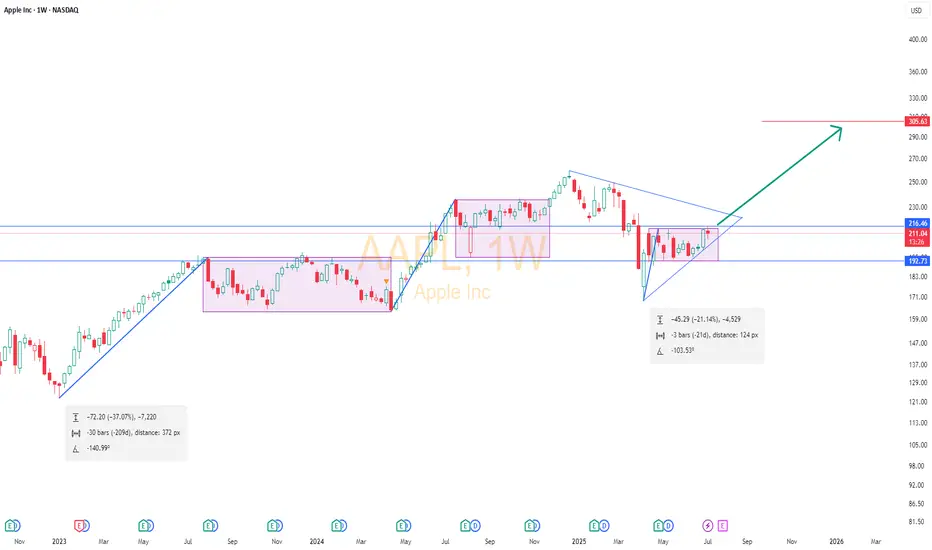
Aapl📈 NASDAQ:AAPL Weekly Chart Update
Apple is forming its third bullish flag since Jan 2023.
🔹 Flags:
1️⃣ Jan 2023 – Feb 2024
2️⃣ May 2024 – Mar 2025
3️⃣ Ongoing since Apr 2025
🔺 A triangle formation from Dec 2024 to Apr 2025 low is also converging.
💥 Breakout level: Weekly close above $216
📉 Stop Loss: $193 (weekly close)
🎯 Target: $305 in coming weeks
Technicals point to a strong bullish setup. Keep it on watch!
#AAPL #Apple #StockMarket #ChartAnalysis #TradingView
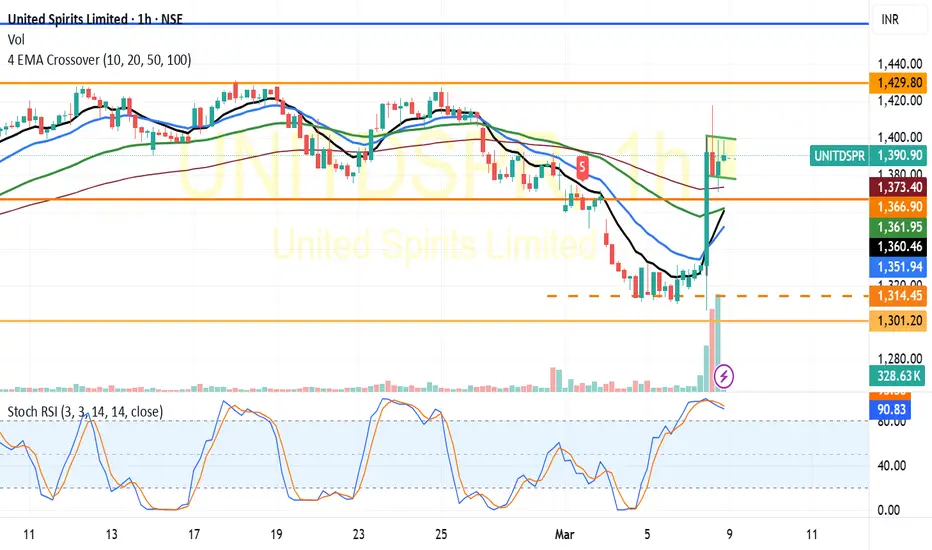
TATA POWER-LIKELY FLAG PATTERN BREAK OUTBased on the 1-hour chart of Tata Power:
It is attempting a short-term bullish flag, but confirmation is not complete yet.
Technical Structure Assessment: Flagpole:
Strong impulsive move from ~₹365 to ~₹377–378
Volume expansion visible on breakout candle.
Momentum indicators (Stoch RSI) near overbought — Which is typical after a flagpole.
Flag Formation:
Post spike, price is moving in a tight sideways/slightly downward channel.
Candles are small-bodied → consolidation behavior.
10 DEMA holding
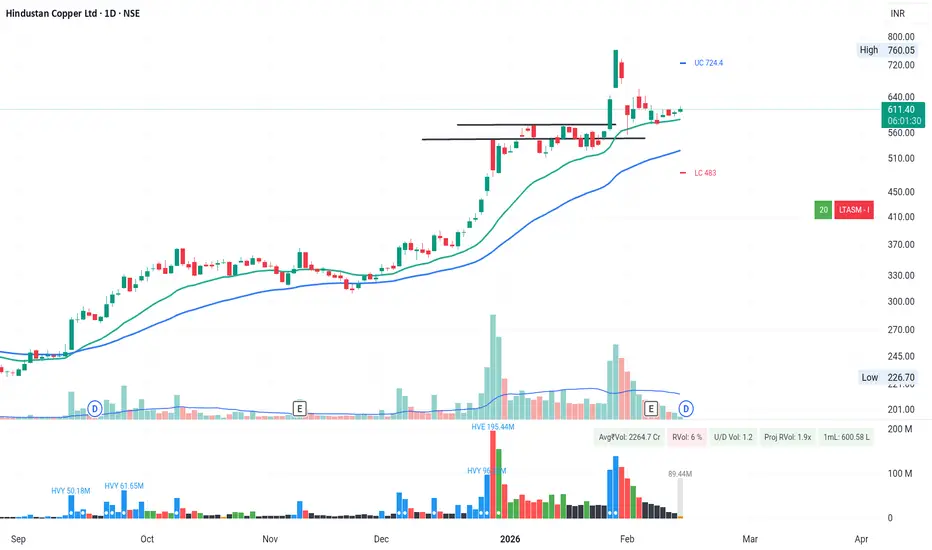
Hindustan Copper – Breakout, Retest & Bullish Continuation SetupNSE:HINDCOPPER
Hindustan Copper has delivered a powerful breakout followed by healthy consolidation near highs — indicating strength rather than exhaustion.
Technical Observations
Breakout zone: ₹570–₹590 area (now acting as support)
Current structure: Flag-type consolidation near highs
Volume: Expansion during breakout, contraction during pullback (healthy)
EMA alignment: 21 EMA > 50 EMA (bullish structure intact)
Momentum is cooling slightly but price is not breaking down — this indicates
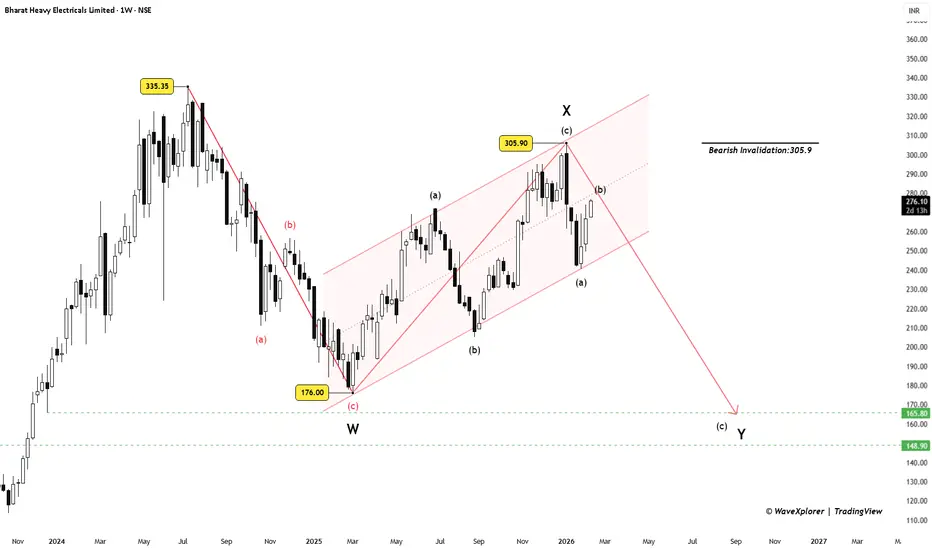
BHEL: Bear Flag on Weekly, Fundamentals Don’t Help EitherBig Picture (Weekly)
BHEL formed a bearish pole and flag on the weekly chart. After a sharp fall, price moved into a rising, overlapping channel — typical corrective behaviour.
Wave X looks completed near 305.9 . As long as price stays below this level, the structure favours another leg down.
Zoom In (1H)
From 305.9 — 240.5 , price unfolded in a clean ABC zigzag , marking (a) of Y .
The current rise is overlapping, slow, and wedge-shaped , suggesting a corrective (b) of Y , not a ne
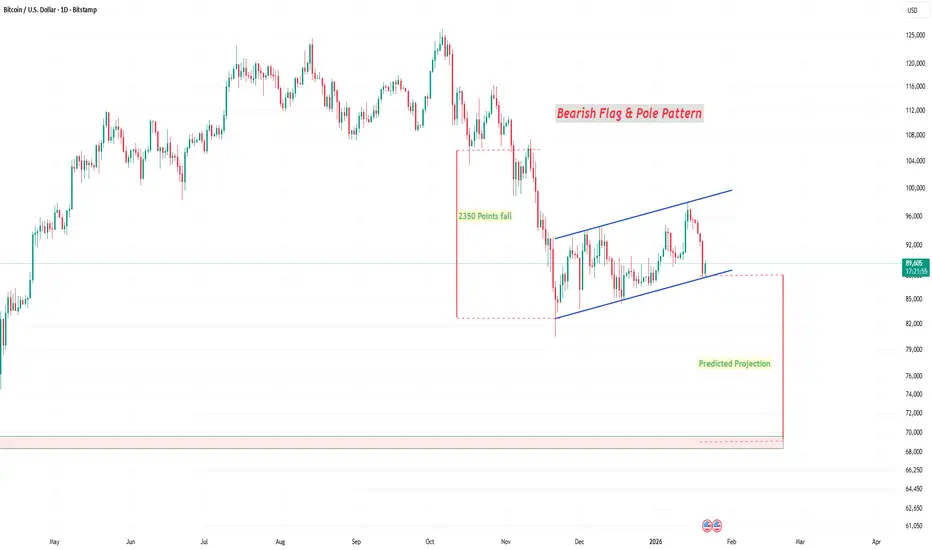
Perfect F&P on Bitcoins daily charts (21/01/26)Bitcoin forming good chart pattern on the daily charts.
The charts is a perfect example of a Flag and Pole pattern. If the pattern completes there are chance of seeing bitcoin dipping.
Identifying the last support around 85K. Be watchful if price dips below it.
Vodafone - IdeaVodafone idea is the most trending stocks when comes to trading, because of small prices and movement.
Here, I have done some analysis of it and where you can find its trend.
1. Trend Understanding
- Vodafone idea was consolidating and then give the breakdown from rising channel or bearish flag.
- Then it had made a low of 9.68 and pull back to re-testing trendline.
- So, it is on trendline retesting and not going up.
2. Bearish Strategy
- So, what's now?? We should check if it will go d