Fractal
XAUUSD : 06/10/25 - TP hit 1.Entry - NYSE session when FVG + P1 confirmed
2. MSS shift happend in 2 min during NY session
3. Entered during pullback
4. there are no High Resistance in either 4 hour or 1 hour but had one High resistance is there in 30 min TF , hence booked full at ATH
4. Closed full at 1:3
#ICT
Overall trend bullish hence looked for buy setups only
Smart Money Play: Watching HDFC Bank’s Bullish ZoneTrading Idea: HDFC Bank (NSE: HDFCBANK)
Price is currently trading around ₹976 after a recent pullback.
Key Observations:
Break of Structure (BOS) confirms bullish market structure.
Liquidity sweep around recent highs.
Daily Fair Value Gap (FVG) spotted between ₹910–₹930.
Bullish Order Block at ₹800–₹830 acting as strong higher timeframe support.
Plan:
Expecting a retracement into the Daily FVG zone (₹910–₹930).
If price reacts bullishly here, potential upside rally towards ₹1,040+.
9 SMS + Market Structure + HTF 🔥 A Simple Strategy That Works: 9 SMA + Market Structure:
Over the last 18 years in the markets, I’ve noticed one common pattern among struggling traders—they jump from strategy to strategy, get caught up in countless indicators, and lose sight of the basics. The truth is, simplicity wins. And the most powerful tool you can master?
👉 Market Structure.
✅ Market Structure 101:
Uptrend: Higher Highs (HH) + Higher Lows (HL)
Downtrend: Lower Highs (LH) + Lower Lows (LL)
Sideways: Ranging or cons
KOTAK BANK - targets 2200 plusKOTAK MAHINDRA BANK - price is 1865
Kotak mahindra bank ,the biggest and unique in its way of working now may act as a proxy to Bank Nifty for playing for upside gains.
1850 levels are very strong supports on monthly and weekly time frames.
these would act as pivots for buying for 2050 and 2200 levels since Bank Nifty is trading at all time highs, also HDFC, ICICI, AXIS all big pvt banks are trading at all time highs.
so buying should be initiated at 1850 for the targets of 2200.
also this stock
GOOG: Don't Miss This Potential Reversal!GOOG Long Idea
Chart Analysis:
The chart shows Alphabet Inc. (GOOG) on a 4-hour timeframe. After a period of decline from its highs, GOOG appears to be finding support around the "Weekly Liquidity" level. There's also a recent bullish impulse from this area, breaking above some minor resistance. The chart identifies three potential "TP" (Take Profit) levels.
Trading Idea:
Entry: Look for a sustained move above the TP01 level ($172.92) or a clear retest and bounce from the current pric
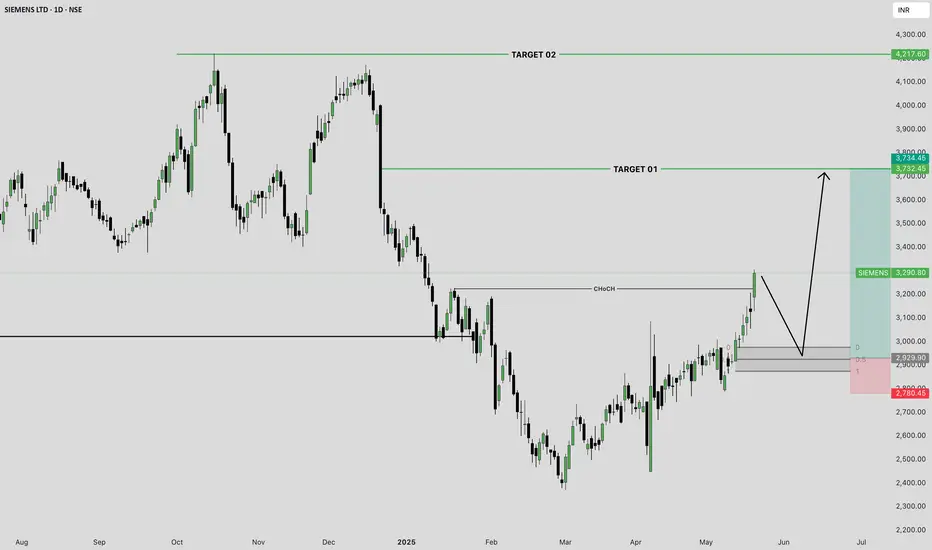
SIEMENS Trade Setup – Clean Entry & TargetsSIEMENS has just confirmed a bullish structure shift with a strong breakout above the CHoCH level, signaling a fresh impulse wave backed by institutional momentum.
📊 Technical Breakdown:
✅ Confirmed CHoCH on the daily timeframe
✅ Strong breakout candle with volume
✅ Clean mitigation and demand zone around ₹2929–₹2880 (aligned with FVG & 0.5 retracement)
✅ Risk-managed long setup with 2 major targets
🎯 Target 01: ₹3,734
🎯 Target 02: ₹4,217
💡 Trade Plan:
Entry Zone: ₹2929–₹2880
Stop Loss:
IRFC Ready to Launch: Buy the Dip Before the BreakoutType: Long (Buy the dip)
Entry Zone: ₹115–₹120
Stop Loss: ₹108.75
Targets:
TP1: ₹150
TP2: ₹167
Reason: After accumulation and manipulation, price broke structure (ChoCH). Expecting a retest before bullish move.
Risk-Reward: ~3.3 to 5.1
Strategy: Wyckoff + Smart Money Concepts (SMC)
BTC Break or Broke Zone. Watch out How Price Reacts on the ZoneBYBIT:BTCUSD.P BINANCE:BTCUSDT
LONG Entry: 96950-96700 >> Look For
STOP LOSS: 96450:
Retracement toward this area and observe how the candle reacts at this zone.
If price shows pullback and wait for the candle to close in 15M TF.
If price didnt Bounce from the Entry Price area,Then its a confirmed Fake OUT .
If Confirmed,
SHORT : 96600
TP1:95800
TP2:95300
TP3:94700
Disclaimer: DYOR; This Technical Analysis should be used only for educational Purpose only.
Donot Take this as an Invest
Trading Plan for AXIS BANK (NSE)
Timeframe: 4H
Current Price: ₹1,015.60
Bias: Bullish
Entry Strategy:
Ideal Buy Zone: Between ₹970 - ₹996 (buyside liquidity area)
Confirmation: Look for a bullish candle confirmation in this zone before entering.
Target Levels:
Primary Target: ₹1,120
Final Target: ₹1,192 (Sell-side liquidity)
Stop Loss:
Below ₹910 (Strong support and invalidation level)
Risk-Reward Ratio:
Approximately 3:1 (Good R:R setup)
Additional Notes:
Price has broken out from a recent structure and is headi
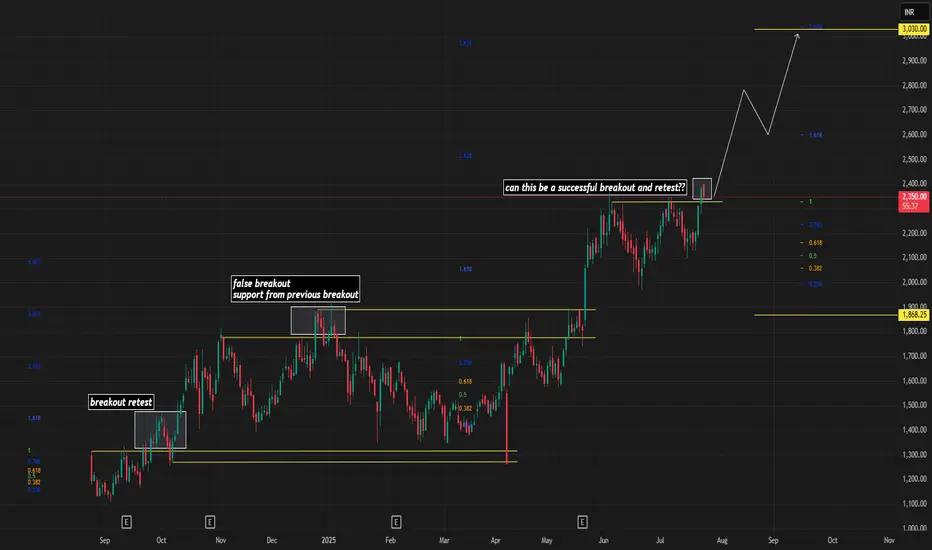
2 years breakout candidate SRFPrice is in 2 years consolidation and possible breakout candidate, above 2773 we can see further bullishness to continue.
SRF Ltd., incorporated in the year 1970, is a Large Cap company (having a market cap of Rs 69,687.99 Crore) operating in Diversified sector.
SRF Ltd. key Products/Revenue Segments include Chemicals (Industrial), Other Operating Revenue, Traded Goods, Export Incentives for the year ending 31-Mar-2023.
Phases of the market - The "AMD" Effect In trading, the terms accumulation, manipulation, and distribution represent distinct phases of market behavior, driven by the strategies of large institutional players such as banks, hedge funds, or market makers. These phases reflect how these entities operate to achieve their objectives while influencing market psychology and price movements.
At the core of these phases lies the concept of supply and demand. However, recognizing where these phases occur within the market is crucial for trade