XAU/USD 31 July 2026 Intraday AnalysisH4 Analysis:
-> Swing: Bullish.
-> Internal: Bearish.
Bias and analysis to remain the same as analysis dated 30 June 2026.
Price did not print bullish CHoCH to indicate bullish pullback phase initiation. Price instead printed a new low followed by a bullish CHoCH
Price is currently trading within and established internal range, however, I will continue to monitor price with respect to depth of pullback.
Intraday expectation:
Price to trade up to either premium of internal 50% EQ, or H4 demand zone before targeting weak internal low, currently priced at 3,942.100.
Note:
Gold remains volatile as tensions between the US, Israel, and Iran keep safe‑haven demand elevated.
Markets are reacting quickly to every headline, while uncertainty around the Fed’s easing path and shifting U.S. policy under President Trump, especially tariffs continues to fuel choppy price action.
For newer traders, the key is simple, stay flexible and manage risk carefully, as fast spikes and sudden reversals are a normal part of the current XAU/USD environment.
H4 Chart:
M15 Analysis:
-> Swing: Bearish.
-> Internal: Bearish.
Analysis and bias remains the same as analysis dated 20 July 2026.
Price has printed according to analysis dated 14 July 2026 where I mentioned price to trade up to either premium of internal 50% EQ, or M15 demand zone before targeting weak internal low, priced at 3,983.545. This is how price printed.
Price has subsequently printed a bullish CHoCH to indicate bullish pullback phase initiation. Price has since printed lower. Depth of pullback has been insignificant, therefore, I will not classify the bearish iBOS, however, I have marked this in red for illustration purposes.
Price has since printed a further bullish CHoCH and once again price is trading within an established internal range, however, I shall again monitor price action with regards to depth of pullback.
Intraday expectation:
Price to trade up to either premium of internal 50% EQ, or M15 demand zone before targeting weak internal low, priced at 3,959.800.
Note:
Gold remains highly reactive on M15 as geopolitical risk continues to drive quick, headline‑led moves.
The tension between the US, Israel, and Iran is keeping safe‑haven demand elevated, with markets still sensitive to any sign of escalation.
At the same time, shifting US tariff policy under President Trump is adding extra uncertainty, fuelling sharp intraday swings and increasing the likelihood of sudden sentiment flips. Liquidity pockets and whipsaws remain common, making disciplined risk management essential.
Gold’s geopolitical premium is still firmly in place, and until tensions ease, short‑term volatility is likely to stay front‑loaded.
M15 Chart: XAU/USD 30 July 2026 Intraday AnalysisH4 Analysis:
-> Swing: Bullish.
-> Internal: Bearish.
Bias and analysis to remain the same as analysis dated 30 June 2026.
Price did not print bullish CHoCH to indicate bullish pullback phase initiation. Price instead printed a new low followed by a bullish CHoCH
Price is currently trading within and established internal range, however, I will continue to monitor price with respect to depth of pullback.
Intraday expectation:
Price to trade up to either premium of internal 50% EQ, or H4 demand zone before targeting weak internal low, currently priced at 3,942.100.
Note:
Gold remains volatile as tensions between the US, Israel, and Iran keep safe‑haven demand elevated.
Markets are reacting quickly to every headline, while uncertainty around the Fed’s easing path and shifting U.S. policy under President Trump, especially tariffs continues to fuel choppy price action.
For newer traders, the key is simple, stay flexible and manage risk carefully, as fast spikes and sudden reversals are a normal part of the current XAU/USD environment.
H4 Chart:
M15 Analysis:
-> Swing: Bearish.
-> Internal: Bearish.
Analysis and bias remains the same as analysis dated 20 July 2026.
Price has printed according to analysis dated 14 July 2026 where I mentioned price to trade up to either premium of internal 50% EQ, or M15 demand zone before targeting weak internal low, priced at 3,983.545. This is how price printed.
Price has subsequently printed a bullish CHoCH to indicate bullish pullback phase initiation. Price has since printed lower. Depth of pullback has been insignificant, therefore, I will not classify the bearish iBOS, however, I have marked this in red for illustration purposes.
Price has since printed a further bullish CHoCH and once again price is trading within an established internal range, however, I shall again monitor price action with regards to depth of pullback.
Intraday expectation:
Price to trade up to either premium of internal 50% EQ, or M15 demand zone before targeting weak internal low, priced at 3,959.800.
Note:
Gold remains highly reactive on M15 as geopolitical risk continues to drive quick, headline‑led moves.
The tension between the US, Israel, and Iran is keeping safe‑haven demand elevated, with markets still sensitive to any sign of escalation.
At the same time, shifting US tariff policy under President Trump is adding extra uncertainty, fuelling sharp intraday swings and increasing the likelihood of sudden sentiment flips. Liquidity pockets and whipsaws remain common, making disciplined risk management essential.
Gold’s geopolitical premium is still firmly in place, and until tensions ease, short‑term volatility is likely to stay front‑loaded.
M15 Chart: XAU/USD 29 July 2026 Intraday AnalysisH4 Analysis:
-> Swing: Bullish.
-> Internal: Bearish.
Bias and analysis to remain the same as analysis dated 30 June 2026.
Price did not print bullish CHoCH to indicate bullish pullback phase initiation. Price instead printed a new low followed by a bullish CHoCH
Price is currently trading within and established internal range, however, I will continue to monitor price with respect to depth of pullback.
Intraday expectation:
Price to trade up to either premium of internal 50% EQ, or H4 demand zone before targeting weak internal low, currently priced at 3,942.100.
Note:
Gold remains volatile as tensions between the US, Israel, and Iran keep safe‑haven demand elevated.
Markets are reacting quickly to every headline, while uncertainty around the Fed’s easing path and shifting U.S. policy under President Trump, especially tariffs continues to fuel choppy price action.
For newer traders, the key is simple, stay flexible and manage risk carefully, as fast spikes and sudden reversals are a normal part of the current XAU/USD environment.
H4 Chart:
M15 Analysis:
-> Swing: Bearish.
-> Internal: Bearish.
Analysis and bias remains the same as analysis dated 20 July 2026.
Price has printed according to analysis dated 14 July 2026 where I mentioned price to trade up to either premium of internal 50% EQ, or M15 demand zone before targeting weak internal low, priced at 3,983.545. This is how price printed.
Price has subsequently printed a bullish CHoCH to indicate bullish pullback phase initiation. Price has since printed lower. Depth of pullback has been insignificant, therefore, I will not classify the bearish iBOS, however, I have marked this in red for illustration purposes.
Price has since printed a further bullish CHoCH and once again price is trading within an established internal range, however, I shall again monitor price action with regards to depth of pullback.
Intraday expectation:
Price to trade up to either premium of internal 50% EQ, or M15 demand zone before targeting weak internal low, priced at 3,959.800.
Note:
Gold remains highly reactive on M15 as geopolitical risk continues to drive quick, headline‑led moves.
The tension between the US, Israel, and Iran is keeping safe‑haven demand elevated, with markets still sensitive to any sign of escalation.
At the same time, shifting US tariff policy under President Trump is adding extra uncertainty, fuelling sharp intraday swings and increasing the likelihood of sudden sentiment flips. Liquidity pockets and whipsaws remain common, making disciplined risk management essential.
Gold’s geopolitical premium is still firmly in place, and until tensions ease, short‑term volatility is likely to stay front‑loaded.
M15 Chart: XAU/USD 28 July 2026 Intraday AnalysisH4 Chart:
-> Swing: Bullish.
-> Internal: Bearish.
Bias and analysis to remain the same as analysis dated 30 June 2026.
Price did not print bullish CHoCH to indicate bullish pullback phase initiation. Price instead printed a new low followed by a bullish CHoCH
Price is currently trading within and established internal range, however, I will continue to monitor price with respect to depth of pullback.
Intraday expectation:
Price to trade up to either premium of internal 50% EQ, or H4 demand zone before targeting weak internal low, currently priced at 3,942.100.
Note:
Gold remains volatile as tensions between the US, Israel, and Iran keep safe‑haven demand elevated.
Markets are reacting quickly to every headline, while uncertainty around the Fed’s easing path and shifting U.S. policy under President Trump, especially tariffs continues to fuel choppy price action.
For newer traders, the key is simple, stay flexible and manage risk carefully, as fast spikes and sudden reversals are a normal part of the current XAU/USD environment.
H4 Chart:
M15 Analysis:
-> Swing: Bearish.
-> Internal: Bearish.
Analysis and bias remains the same as analysis dated 20 July 2026.
Price has printed according to analysis dated 14 July 2026 where I mentioned price to trade up to either premium of internal 50% EQ, or M15 demand zone before targeting weak internal low, priced at 3,983.545. This is how price printed.
Price has subsequently printed a bullish CHoCH to indicate bullish pullback phase initiation. Price has since printed lower. Depth of pullback has been insignificant, therefore, I will not classify the bearish iBOS, however, I have marked this in red for illustration purposes.
Price has since printed a further bullish CHoCH and once again price is trading within an established internal range, however, I shall again monitor price action with regards to depth of pullback.
Intraday expectation:
Price to trade up to either premium of internal 50% EQ, or M15 demand zone before targeting weak internal low, priced at 3,959.800.
Note:
Gold remains highly reactive on M15 as geopolitical risk continues to drive quick, headline‑led moves.
The tension between the US, Israel, and Iran is keeping safe‑haven demand elevated, with markets still sensitive to any sign of escalation.
At the same time, shifting US tariff policy under President Trump is adding extra uncertainty, fuelling sharp intraday swings and increasing the likelihood of sudden sentiment flips. Liquidity pockets and whipsaws remain common, making disciplined risk management essential.
Gold’s geopolitical premium is still firmly in place, and until tensions ease, short‑term volatility is likely to stay front‑loaded.
M15 Chart:  Long
Long
Long 
 Short
Short
10 YEARS BULL MARKET PERIOD- GOLDIt is a structural map of how gold has behaved across three separate monetary eras.
The chart shows that major gold bull markets have not developed as one continuous vertical move. Each decade long expansion has been divided into two distinct phases.
Part 1 creates the primary trend. Then the market enters a long interruption. Momentum disappears, price moves sideways or corrects, and the previous breakout area is tested repeatedly.
Part 2 begins only after that consolidation has absorbed supply. This second phase is usually faster, steeper and far more visible than the first.
1970 to 1980
The first major sequence began near the start of the 1970s.
Gold advanced aggressively into 1974, forming Part 1 of the bull market. That move was followed by a deep correction and several years of consolidation beneath the previous high.
The important moment came when gold returned to the old ceiling near 1978. The former resistance zone was reclaimed and held as support.
Part 2 then began.
The final expansion was much faster than the initial advance and carried gold into the 1980 cycle peak. The structure was clear: Initial expansion. Major correction. Old high retest. Breakout. Vertical repricing.
2001 to 2011
The second decade bull market began after a long secular decline.
Gold advanced steadily from 2001 into 2006. That was Part 1.
The market then slowed. Price became volatile, tested the developing trend and experienced the severe 2008 correction. But the larger structure remained intact. Once gold recovered the previous consolidation area, Part 2 began. The final phase accelerated from 2009 into the 2011 peak.
Again, the second half of the bull market produced the most aggressive repricing.
The frst move established the trend.
The interruption tested conviction.
The second move attracted attention.
2016 to 2026
The current sequence began near the 2015 and 2016 cycle bottom.
Gold advanced into the 2020 high, completing Part 1. What followed was not the end of the bull market. It was a long structural reset.
Between 2020 and 2023, gold repeatedly tested the same broad resistance area. Several breakout attempts were rejected. Momentum weakened and the market spent years absorbing the supply created near the 2020 peak. This phase closely resembles the interruptions seen during the previous two decade bull markets.
The decisive change arrived when gold finally escaped the range and converted the old resistance region into support.
That marked the transition into Part 2. acceleration since 2024 is therefore not an isolated rally. It is the late expansion phase of a bull market that began almost a decade earlier.
Gold is no longer in the early accumulation phase of this cycle.
It is already inside Part 2.
That matters because Part 2 has historically delivered the fastest rise, but it has also represented the mature stage of the broader decade structure.
The recent vertical advance suggests that the market is moving through the strongest phase of its current repricing cycle. However, vertical movement alone does not identify the exact top.
The previous cycles show that gold can continue rising substantially after the second phase becomes obvious. They also show that risk increases as price moves further away from the long term structure.
The current correction may therefore be a pause inside Part 2 rather than proof that the entire gold cycle has ended. The Larger Capital Rotation Each gold decade also developed alongside a different dominant market era. After the 1970s gold cycle, global attention moved toward Japan and the Nikkei 225. After the 2001 to 2011 gold cycle, capital concentrated increasingly in the United States and the Nasdaq.
The current cycle has developed during the Bitcoin era. This does not mean that money rotates mechanically from gold into another asset on a fixed date. It means that major monetary cycles often end with capital searching for a new source of asymmetric expansion.
Gold reflects monetary distrust.
Technology reflects productivity expectations.
Bitcoin combines monetary scarcity with a global digital network.
The important question is therefore not whether gold can rise further. It can.
The more important question is what becomes the dominant destination after gold completes the mature stage of its current decade bull market. Gold has followed the same broad rhythm three times: decade long bull market. An initial expansion. long interruption. structural retest faster second expansion The 2016 to 2026 cycle has now entered the same Part 2 phase seen before the final advances of 1980 and 2011. This does not provide an exact top date.
It does show that gold is operating in the mature and most powerful phase of its current cycle.
Gold is completing its repricing. next major capital rotation may already be forming outside the asset most investors are currently watching.
XAU/USD 27 July 2026 Intraday AnalysisH4 Analysis:
-> Swing: Bullish.
-> Internal: Bearish.
Bias and analysis to remain the same as analysis dated 30 June 2026.
Price did not print bullish CHoCH to indicate bullish pullback phase initiation. Price instead printed a new low followed by a bullish CHoCH
Price is currently trading within and established internal range, however, I will continue to monitor price with respect to depth of pullback.
Intraday expectation:
Price to trade up to either premium of internal 50% EQ, or H4 demand zone before targeting weak internal low, currently priced at 3,942.100.
Note:
Gold remains volatile as tensions between the US, Israel, and Iran keep safe‑haven demand elevated.
Markets are reacting quickly to every headline, while uncertainty around the Fed’s easing path and shifting U.S. policy under President Trump, especially tariffs continues to fuel choppy price action.
For newer traders, the key is simple, stay flexible and manage risk carefully, as fast spikes and sudden reversals are a normal part of the current XAU/USD environment.
H4 Chart:
M15 Analysis:
-> Swing: Bearish.
-> Internal: Bearish.
Analysis and bias remains the same as analysis dated 20 July 2026.
Price has printed according to analysis dated 14 July 2026 where I mentioned price to trade up to either premium of internal 50% EQ, or M15 demand zone before targeting weak internal low, priced at 3,983.545. This is how price printed.
Price has subsequently printed a bullish CHoCH to indicate bullish pullback phase initiation. Price has since printed lower. Depth of pullback has been insignificant, therefore, I will not classify the bearish iBOS, however, I have marked this in red for illustration purposes.
Price has since printed a further bullish CHoCH and once again price is trading within an established internal range, however, I shall again monitor price action with regards to depth of pullback.
Intraday expectation:
Price to trade up to either premium of internal 50% EQ, or M15 demand zone before targeting weak internal low, priced at 3,959.800.
Note:
Gold remains highly reactive on M15 as geopolitical risk continues to drive quick, headline‑led moves.
The tension between the US, Israel, and Iran is keeping safe‑haven demand elevated, with markets still sensitive to any sign of escalation.
At the same time, shifting US tariff policy under President Trump is adding extra uncertainty, fuelling sharp intraday swings and increasing the likelihood of sudden sentiment flips. Liquidity pockets and whipsaws remain common, making disciplined risk management essential.
Gold’s geopolitical premium is still firmly in place, and until tensions ease, short‑term volatility is likely to stay front‑loaded.
M15 Chart: Short 
Did Bitcoin Finally Bottom?The year 2026 has proven to be one of the most frustrating periods for cryptocurrency holders and investors. Bitcoin has experienced one of its weakest historical performances, leading many to question whether this bull market has broken from its traditional cycle.
Historically, Bitcoin bull markets have tended to last approximately three years from start to finish, giving rise to what is commonly known as the four year cycle. In previous cycles, Bitcoin's price has accelerated throughout this period before reaching a peak that closely aligned with the expected four-year timeline.
With that in mind, it's possible that the current bear market which has forced many investors into capitulation, is approaching its conclusion. Traditionally, the four year cycle consists of roughly three bullish years followed by one bearish year. However, when examining the yearly chart, we can see that Bitcoin advanced for only two years before closing the third annual candle in the red.
This observation leads me to consider whether Bitcoin's bull and bear markets are beginning to compress as the asset class matures. If this trend continues, we may see shorter bull markets accompanied by shorter bear markets, rather than the extended cycles we've become accustomed to.
Moving into my analysis, which is based primarily on fractals and should be used as supplemental context within a broader investment framework, I'd like to compare the previous bear market with today's price action.
The similarities are striking, not only in the overall wave structure, but more importantly in the relationship between price and time. In both cases, Bitcoin appears to trade back into the Anchored VWAP (AVWAP) from the cycle high while forming a well-defined ABC corrective structure.
What stands out most is how closely both bear markets resemble one another. The relief rallies occur at nearly identical points in time and develop into remarkably similar price structures. While no fractal guarantees future outcomes, the resemblance is difficult to ignore.
If this ultimately proves to be Bitcoin's cycle low, one key catalyst to watch could be ISM and PMI data, which may indicate that inflationary pressures are beginning to ease. A shift in the macroeconomic environment could provide a supportive backdrop for risk assets, including Bitcoin.
That said, this analysis does not suggest that price cannot move lower. Rather, I believe it's important to pay close attention to the structure that develops around the lows. While many market participants are anticipating a decline toward the $30,000 range, that is not currently supported by the fractal I am tracking. Instead, the fractal suggests that the cycle bottom is more likely to develop somewhere in the $50,000 region.
 Long
Long
BTC/USDT: Market Profile & Orderflow Analysis ahead of Fed NewsBitcoin is demonstrating powerful bullish momentum on higher timeframes. Both Monthly and Weekly Market Profiles (MP M/W) align toward continuation, setting the stage for a push into the $68,000 – $70,000 major target zone.
📊 Volume & Market Profile Context (MP / VP / Orderflow)
HTF Structure: Strong positioning across VAH/POC LM (Monthly) and VAL LIQ 3W / VAH LW (Weekly).
Local Support: Solid protection at VAL LD ($65,050) and the VWAP 7D band.
Orderflow Drivers:
-Vah G+ Lock & Spot Absorption: Active spot accumulation locking in short positions.
-Limit Defense: Heavy bid support stacked below price.
-Derivatives: OI + Net Short dynamics suggest shorts are getting trapped, fueling upside energy.
🎯 Trade Execution Plan
We are waiting for a local retest of our long POI zones. If confirmation factors appear on LTFs, we look for continuation longs.
Invalidation Zone (Stop Loss): $64,600 (Clean body acceptance below invalidates this setup).
Take-Profit Targets:
TP 1: $66,900
TP 2: $67,250
TP 3 (Main): $68,000 (with macro extension toward 70k)
⚠️ Risk Warning: Important macro/Fed data is on the horizon. Expect heightened volatility — manage risk carefully and stick to your execution rules!
What's your bias ahead of the macro news? Let me know below and hit the rocket 🚀 if you're aligned with the long bias! Long 
Long 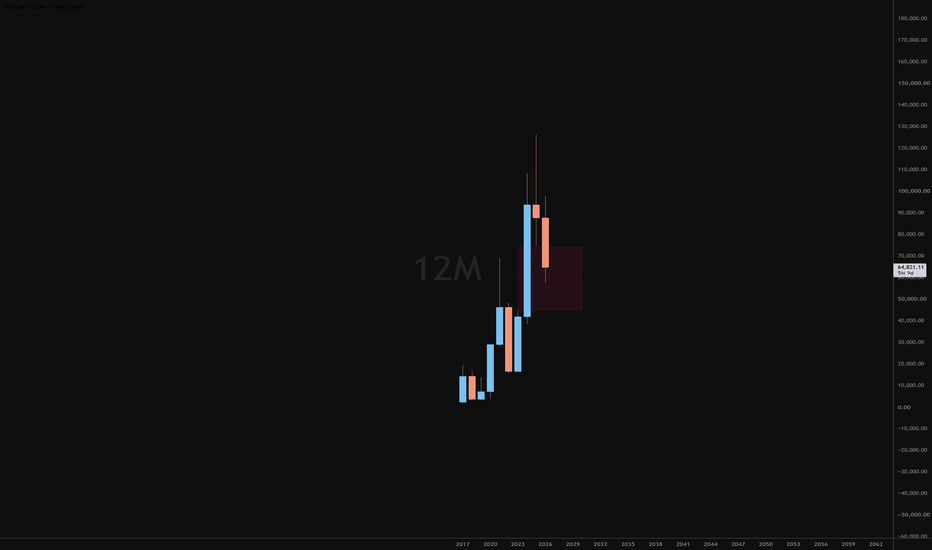
XAU/USD 23 July 2026 Intraday AnalysisH4 Analysis:
-> Swing: Bullish.
-> Internal: Bearish.
Bias and analysis to remain the same as analysis dated 30 June 2026.
Price did not print bullish CHoCH to indicate bullish pullback phase initiation. Price instead printed a new low followed by a bullish CHoCH
Price is currently trading within and established internal range, however, I will continue to monitor price with respect to depth of pullback.
Intraday expectation:
Price to trade up to either premium of internal 50% EQ, or H4 demand zone before targeting weak internal low, currently priced at 3,942.100.
Note:
Gold remains volatile as tensions between the US, Israel, and Iran keep safe‑haven demand elevated.
Markets are reacting quickly to every headline, while uncertainty around the Fed’s easing path and shifting U.S. policy under President Trump, especially tariffs continues to fuel choppy price action.
For newer traders, the key is simple, stay flexible and manage risk carefully, as fast spikes and sudden reversals are a normal part of the current XAU/USD environment.
H4 Chart:
M15 Analysis:
-> Swing: Bearish.
-> Internal: Bearish.
Analysis and bias remains the same as analysis dated 20 July 2026.
Price has printed according to analysis dated 14 July 2026 where I mentioned price to trade up to either premium of internal 50% EQ, or M15 demand zone before targeting weak internal low, priced at 3,983.545. This is how price printed.
Price has subsequently printed a bullish CHoCH to indicate bullish pullback phase initiation. Price has since printed lower. Depth of pullback has been insignificant, therefore, I will not classify the bearish iBOS, however, I have marked this in red for illustration purposes.
Price has since printed a further bullish CHoCH and once again price is trading within an established internal range, however, I shall again monitor price action with regards to depth of pullback.
Intraday expectation:
Price to trade up to either premium of internal 50% EQ, or M15 demand zone before targeting weak internal low, priced at 3,959.800.
Note:
Gold remains highly reactive on M15 as geopolitical risk continues to drive quick, headline‑led moves.
The tension between the US, Israel, and Iran is keeping safe‑haven demand elevated, with markets still sensitive to any sign of escalation.
At the same time, shifting US tariff policy under President Trump is adding extra uncertainty, fuelling sharp intraday swings and increasing the likelihood of sudden sentiment flips. Liquidity pockets and whipsaws remain common, making disciplined risk management essential.
Gold’s geopolitical premium is still firmly in place, and until tensions ease, short‑term volatility is likely to stay front‑loaded.
M15 Chart: Short 
XAU/USD 22 July 2026 Intraday AnalysisH4 Analysis:
-> Swing: Bullish.
-> Internal: Bearish.
Bias and analysis to remain the same as analysis dated 30 June 2026.
Price did not print bullish CHoCH to indicate bullish pullback phase initiation. Price instead printed a new low followed by a bullish CHoCH
Price is currently trading within and established internal range, however, I will continue to monitor price with respect to depth of pullback.
Intraday expectation:
Price to trade up to either premium of internal 50% EQ, or H4 demand zone before targeting weak internal low, currently priced at 3,942.100.
Note:
Gold remains volatile as tensions between the US, Israel, and Iran keep safe‑haven demand elevated.
Markets are reacting quickly to every headline, while uncertainty around the Fed’s easing path and shifting U.S. policy under President Trump, especially tariffs continues to fuel choppy price action.
For newer traders, the key is simple, stay flexible and manage risk carefully, as fast spikes and sudden reversals are a normal part of the current XAU/USD environment.
H4 Chart:
M15 Analysis:
-> Swing: Bearish.
-> Internal: Bearish.
Analysis and bias remains the same as analysis dated 20 July 2026.
Price has printed according to analysis dated 14 July 2026 where I mentioned price to trade up to either premium of internal 50% EQ, or M15 demand zone before targeting weak internal low, priced at 3,983.545. This is how price printed.
Price has subsequently printed a bullish CHoCH to indicate bullish pullback phase initiation. Price has since printed lower. Depth of pullback has been insignificant, therefore, I will not classify the bearish iBOS, however, I have marked this in red for illustration purposes.
Price has since printed a further bullish CHoCH and once again price is trading within an established internal range, however, I shall again monitor price action with regards to depth of pullback.
Intraday expectation:
Price to trade up to either premium of internal 50% EQ, or M15 demand zone before targeting weak internal low, priced at 3,959.800.
Note:
Gold remains highly reactive on M15 as geopolitical risk continues to drive quick, headline‑led moves.
The tension between the US, Israel, and Iran is keeping safe‑haven demand elevated, with markets still sensitive to any sign of escalation.
At the same time, shifting US tariff policy under President Trump is adding extra uncertainty, fuelling sharp intraday swings and increasing the likelihood of sudden sentiment flips. Liquidity pockets and whipsaws remain common, making disciplined risk management essential.
Gold’s geopolitical premium is still firmly in place, and until tensions ease, short‑term volatility is likely to stay front‑loaded.
M15 Chart: Short 
 Short
Short
 Long
Long
Long 
Long