EURUSD Daily Chart - Bullish A-B-C Correction,Trend Reversal1. Pattern:
This is a classic Elliott Wave A-B-C correction. You correctly marked A at the swing low (1.15500), B at the lower high (1.16900), and C at the final bottom (1.14365 - 1.14663). The price is now completing the C wave.2. Key Level:
The pink shaded zone around 1.14300 to 1.14700 is the strong demand zone. Price touched it and showed a long wick rejection. This is the same zone where price accumulated in July. Holding above this zone for 3 days means sellers are exhausted.3. Price Action Today:
Open: ∼1.14700, Low: 1.13900, Close: 1.14863 (+0.09%). The candle has a long lower wick and a strong bullish body. This is called a Bullish Rejection Candle. It means buyers stepped in aggressively at the C point.4. Channel Break:
The dashed descending channel from May to July is broken. Price was falling inside it, now it has broken out at C point and is moving up.5. Your Target:
You marked two targets on the right:1.17635 (immediate resistance)1.18297 (major dotted blue line resistance)
Your black arrow projecting up to 1.17635 is technically correct. That is 280+ pips from current C zone.6. Final Conclusion:
Trend change is confirmed on Daily timeframe. The downtrend is over, uptrend is starting from C point. This matches your NZDUSD and GBPUSD charts - all three USD pairs are bottoming together, indicating US Dollar weakness.
Setup:
Buy at C zone (1.14400-1.14800),
Stop Loss below 1.13900,
Target 1.17635 / 1.18297. XAUUSD — 4510 Is Where It Gets Dirty XAUUSD — 4510 Is Where It Gets Dirty
Gold bounced.
But this is not clean bullish control yet.
Price reacted from the lower area around 4,235 - 4,280, then pushed back above 4,350. Nice recovery, yeah. But look at where price is now.
Right in the middle.
Around 4,378, gold is still trading inside the bearish correction channel. That means I don’t want to chase buys here. This is exactly where late traders usually get trapped thinking the reversal is confirmed.
The real test is higher.
4,422 is the first liquidity line. If gold breaks that, buyers may get excited again. But the zone I care about is 4,480 - 4,520.
That area is the Bearish PD Array, FVG and OB zone. Basically, the place where sellers may reload if price gives them a clean rejection.
Main view stays bearish while gold holds below 4,520.
Main zone: 4,480 - 4,520
Reaction target: 4,300
Deeper target: 4,180 - 4,150
Invalidation: strong hold above 4,520 - 4,550
Trade idea is simple.
If gold pumps into 4,480 - 4,520 and starts rejecting, I’ll look for a sell reaction back toward 4,300 first.
If gold breaks and holds above 4,520, then the bearish idea gets weak and price can start reaching toward 4,590 - 4,620 external liquidity.
For now, this looks like recovery into resistance, not a clean reversal.
You think gold traps buyers at 4,510, or breaks straight into 4,600 liquidity?
 Long
Long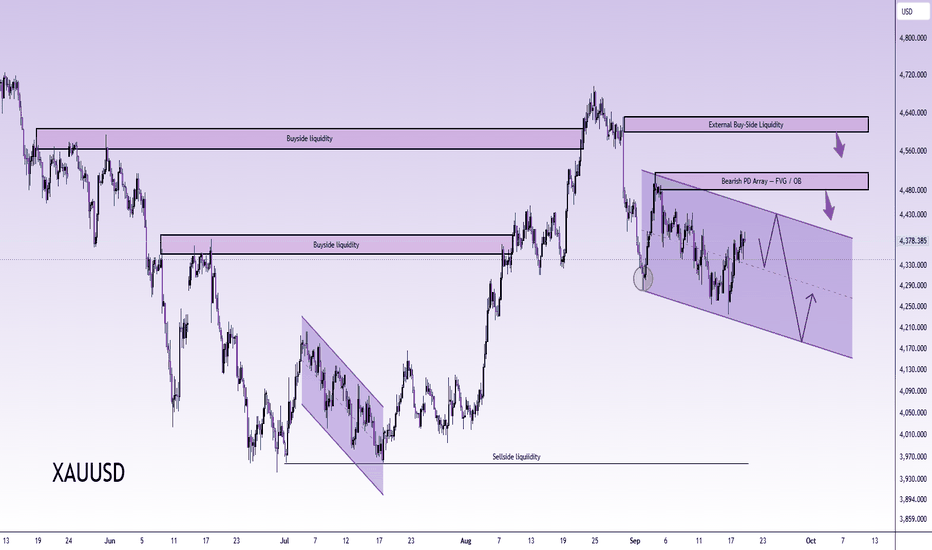
XAUUSD – Bearish Structure Broken, But 4,447 Is Key XAUUSD – Bearish Structure Broken, But 4,447 Is Key
Gold is starting to show a more constructive recovery after breaking the short-term bearish market structure.
Price is trading around 4,378 after reacting strongly from the lower support area near 4,240 – 4,260. The chart shows that the previous bearish trendline has been violated, and price is now holding above the buy order zone around 4,349. This is an important change because sellers no longer have the same clean control they had during the earlier decline.
However, gold is not fully bullish yet. The market is now entering a confirmation phase. Buyers need to defend the current support and push price above the next resistance zone before the recovery becomes stronger.
Technical view:
Gold broke the short-term bearish structure.
Price is holding above the buy order zone around 4,349.
The current reaction area is near 4,378 – 4,402.
The first important resistance is around 4,447.
This area also aligns with Fibonacci resistance and FVG structure.
If gold breaks above 4,447, buyers may continue toward 4,593.
The 4,593 area is a major liquidity and Fibonacci resistance zone.
If gold fails to hold 4,349, the recovery structure may weaken and price may retest 4,240 – 4,260.
Key levels to watch:
Current price: 4,378
Buy order support: 4,349
Short-term confirmation: above 4,402
Key resistance: 4,447
Major liquidity target: 4,593
Lower support: 4,240 – 4,260
Bullish invalidation: below 4,349
Main scenario:
If gold holds above 4,349 and breaks back above 4,402, buyers may try to push price toward 4,447.
A clean breakout above 4,447 would confirm stronger bullish recovery momentum and open the way toward 4,593.
This would turn the recent move from a simple correction into a more meaningful recovery structure.
Alternative scenario:
If gold fails to hold above 4,349, the breakout may become a false recovery.
In that case, sellers may try to pull price back toward the previous support zone near 4,240 – 4,260 before buyers appear again.
Hannah’s view:
Gold is showing the first sign of recovery, but confirmation is still needed.
The bearish structure has been broken, which is a positive signal for buyers. But the market is now sitting between support and resistance, so I do not want to chase the move too early.
Main view: gold can continue higher if 4,349 holds and price breaks above 4,447. The next larger target would be 4,593. If 4,349 fails, gold may return to the lower support area before building a stronger setup. No confirmation means no trade.
Do you think gold can break 4,447, or will sellers defend the Fibonacci resistance again?
Long 
Long 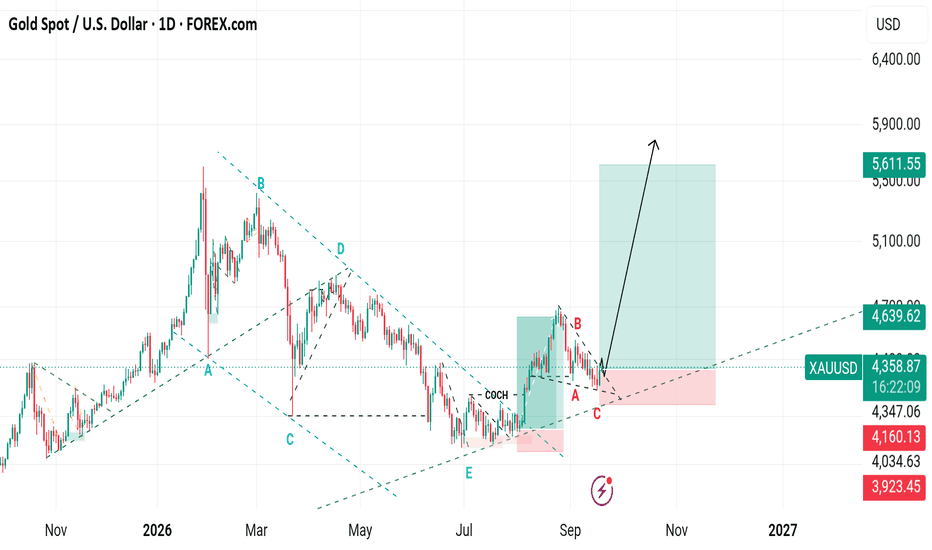
BRIAN XAUUSD – GOLD HOLDS POC, BUT 4,438 IS THE TEST BRIAN XAUUSD – GOLD HOLDS POC, BUT 4,438 IS THE TEST
Gold is trying to rebuild bullish momentum after defending the lower value area, but the market is still not fully clean for aggressive buying.
On the H4 chart, the bigger structure still shows buyers holding above the rising trendline from the previous accumulation phase. This is important because gold has not broken the larger bullish base yet. However, price is now trading around 4,378 after recovering from the Buy VAL 4,290 and Buy zone POC 4,351 areas.
The current reaction is positive, but gold is now approaching the first important resistance: Sell scalping VAH around 4,438.
Technical structure
Gold recently swept lower into the 4,290 value area, then recovered strongly back above the POC support around 4,351. This tells me buyers are still active below the market.
The key short-term base is now 4,351. As long as price holds above this zone, the recovery structure remains valid.
The first upside test is 4,438. This is the VAH resistance and also a possible seller reaction zone. If gold reaches this level and rejects, price may rotate back toward 4,351 again.
If buyers break and accept above 4,438, the next major upside target becomes the Sell zone POC around 4,595. That is the larger resistance from the previous high-volume area, and I would expect stronger selling pressure there.
Important zones
Current price area: 4,370 - 4,390
Gold is recovering but still below the main VAH resistance.
Buy zone POC: 4,351
Main buyer defense zone for the current structure.
Buy VAL: 4,290
Deeper value support if gold pulls back harder.
Sell scalping VAH: 4,438
First resistance and short-term seller reaction zone.
Sell zone POC: 4,595
Major upper resistance and larger seller interest area.
Trendline support: rising structure below current price
As long as price holds above this trendline, the broader recovery view remains alive.
Trading scenario
Priority view: buy reaction above 4,351
Entry:
Look for buy positions only if gold holds above 4,351 and shows clear bullish rejection from the POC support.
Stop Loss:
Below the local sweep low or below the 4,351 support zone.
Take Profit:
TP1: 4,438
TP2: 4,500
TP3: 4,595 if buyers break and accept above the VAH resistance
This setup follows the current bullish recovery structure, but confirmation is still needed. Buying directly into 4,438 is risky because that is the first seller reaction area.
Alternative sell scenario
If gold reaches 4,438 and shows strong rejection, a short-term sell reaction may appear.
Entry:
Look for sell positions only if price rejects clearly from 4,438 and fails to hold above it.
Stop Loss:
Above the rejection high.
Take Profit:
TP1: 4,351
TP2: 4,290 if downside pressure expands
This would be a reaction sell, not a full bearish reversal, unless gold also breaks below 4,351 and loses the rising trendline.
Final view
Gold is still holding the bullish value structure, but the next confirmation must come from 4,438.
For now, my map is simple:
Hold 4,351 = buyers remain active.
Break 4,438 = recovery momentum improves.
Reach 4,595 = major resistance test.
Reject 4,438 = price may rotate back to 4,351.
Lose 4,351 = deeper pullback toward 4,290 becomes possible.
Gold is not weak while it stays above the POC and rising trendline, but it is also not clean enough to chase directly under VAH resistance.
The best setup is to wait for confirmation: either buyers defend 4,351 for continuation, or sellers reject 4,438 for a short-term rotation.
Will gold break above 4,438 and open the path toward 4,595, or will sellers defend the VAH first?
Long 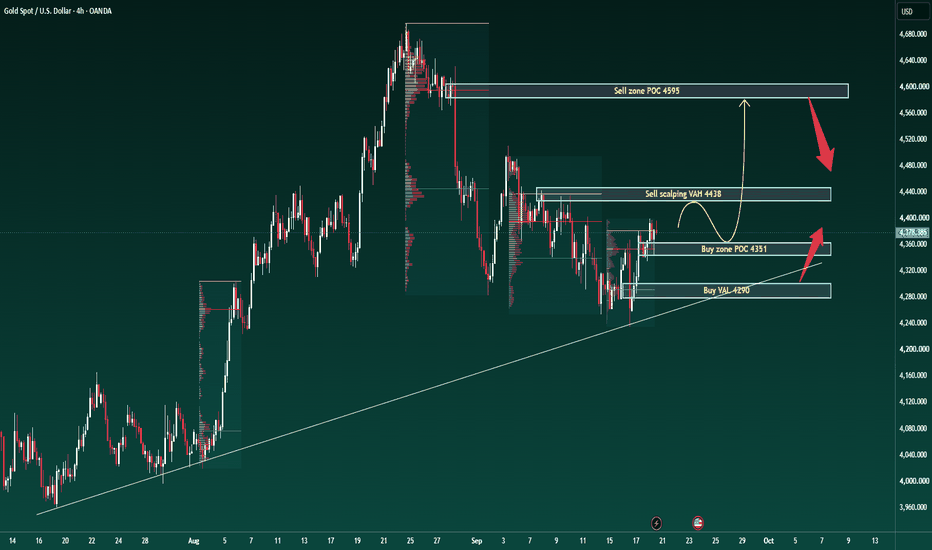
XAUUSD: 4,238 Holds the Bigger Recovery Map XAUUSD: 4,238 Holds the Bigger Recovery Map
Market Context
Gold is trying to build a larger recovery after reacting from the strong liquidity base near 3,941.
The daily chart is no longer showing only one-way bearish pressure. Price has formed a clear recovery leg, reclaimed important structure, and is now holding above the previous accumulation zone. However, the market is still not fully bullish until buyers clear the next liquidity barrier above.
The current price around 4,378 is sitting between recovery support and the next premium resistance area. This means gold may need one more pullback before the next strong upside attempt.
Technical Structure
The main story is simple: gold has shifted from deep discount recovery into a potential bullish continuation structure.
The first important support is 4,238. This is the nearest liquidity and reaction level. If price pulls back and holds this area, buyers may use it as the base for the next push higher.
Below that, 4,163 is another key support and FVG liquidity zone. Losing 4,163 would weaken the recovery structure and may bring price back toward the OB Buy Zone around 4,050 - 4,100.
Above current price, 4,511 is the first major buy-side liquidity target. A clean break above this level would confirm that buyers are regaining control.
The next upside levels are 4,698, then 4,889. If gold continues to expand strongly, the higher OB zone around 5,100 - 5,200 becomes the larger premium target.
Key Levels
Current Price: 4,378
Nearest Support: 4,238
FVG / Strong Liquidity Support: 4,163
OB Buy Zone: 4,050 - 4,100
Buy-Side Liquidity: 4,511
Month High: 4,698
Strong Liquidity Target: 4,889
Higher Premium OB: 5,100 - 5,200
Major Liquidity Reference: 5,600
Trading Plan
Primary Buy Scenario
Entry: 4,238 - 4,163 after bullish confirmation
SL: Below 4,100
TP: 4,511 / 4,698 / 4,889
Condition: Gold pulls back into the support zone, holds structure, and forms a clear bullish reaction. This would suggest buyers are defending the recovery base.
Breakout Buy Scenario
Entry: Above 4,511 after breakout and retest
SL: Below 4,380
TP: 4,698 / 4,889 / 5,100
Condition: Price breaks above the buy-side liquidity zone and holds above it. This would confirm stronger bullish continuation.
Alternative Sell Scenario
Entry: Below 4,163 after breakdown and retest
SL: Above 4,238
TP: 4,100 / 4,050 / 3,941
Condition: Gold loses the FVG support and fails to reclaim it. This would show that buyers are losing the recovery structure.
Overall Bias
Gold is recovering, but the next move depends on how price reacts around 4,238 - 4,163.
As long as this zone holds, the bigger recovery map remains valid, with upside targets at 4,511, 4,698, and 4,889.
If price breaks below 4,163, the recovery weakens and gold may return to the deeper OB Buy Zone.
Best approach: wait for confirmation around support. Do not chase the middle. The cleanest setup comes from either a pullback into 4,238 - 4,163 or a breakout above 4,511.
Will gold defend the recovery base and continue higher, or will sellers drag price back into deeper demand?
Long 
XAUUSD – Gold Holds Deep Support, 4,488 Is the Weekly Key XAUUSD – Gold Holds Deep Support, 4,488 Is the Weekly Key
Gold is starting the new week in a very important reaction zone.
Price is trading around 4,354 after recovering from the deep Fibonacci support area near 4,270 – 4,300. The chart shows that sellers pushed gold down aggressively earlier, but the downside move has started to lose strength around the lower support base. This reaction suggests that buyers are still defending the deeper structure, but the recovery has not fully confirmed yet.
The main market focus this week is geopolitical risk. New tension between Ukraine and Russia may keep traders cautious and support safe-haven demand. However, when geopolitical risk also strengthens the U.S. Dollar, gold can become more volatile because both assets may attract defensive flows at the same time. That is why the technical confirmation zones matter more this week.
Technical view:
Gold reacted from the deep Fibonacci support zone around 4,270 – 4,300.
Price is now holding above the short-term structure near 4,309.
The current trading area is around 4,354.
The nearest recovery resistance is around 4,400.
If buyers break above 4,400, the next target is 4,488.
The 4,488 zone is the main expansion target and the key resistance for this week.
A stronger bullish continuation would need price to break and hold above 4,488.
If gold fails to hold 4,309, the recovery may weaken and price can retest 4,270 – 4,300.
Key levels to watch:
Current price: 4,354
Short-term support: 4,309
Deep Fibonacci support: 4,270 – 4,300
First recovery resistance: 4,400
Main weekly target: 4,488
Major Fib extension zone: 4,600 – 4,640
Invalidation for recovery: below 4,270
Main scenario for this week:
If gold holds above 4,309 and builds a higher-low structure, buyers may try to push price toward 4,400 first.
A clean breakout above 4,400 would support continuation toward 4,488.
If 4,488 breaks with strong momentum, gold may extend toward the larger Fibonacci expansion zone around 4,600 – 4,640.
Alternative scenario:
If gold fails to hold 4,309 and breaks below 4,270 – 4,300, the bullish recovery setup becomes weaker.
In that case, the market may return to a deeper correction phase before buyers attempt another recovery.
Hannah’s view:
Gold is not fully bullish yet, but the reaction from deep Fibonacci support is important.
For me, the key this week is simple: buyers must defend 4,309 and reclaim 4,400. If they can do that, gold has room to continue toward 4,488. If the market fails below 4,309, the recovery may lose strength and price can return to the lower support base.
Main view: gold has recovery potential this week while 4,309 holds. The first target is 4,400, then 4,488. A breakout above 4,488 would open the larger upside path toward 4,600 – 4,640. No confirmation means no trade.
Do you think gold can break 4,488 this week, or will sellers defend the expansion zone again?
Long 
XAUUSD: 4,400 Is the Line Buyers Must Break XAUUSD: 4,400 Is the Line Buyers Must Break
Market Context
Gold starts the new week in a tight decision zone, and this is not a clean market to chase.
Geopolitical risk is back in focus after fresh Russia-Ukraine tension, which can support safe-haven demand. But at the same time, the US Dollar is also benefiting from defensive flows. That creates a mixed setup for gold.
So the question this week is simple: can buyers protect 4,340 - 4,355 and break through 4,400, or will sellers use this zone to stop the recovery?
Technical Structure
Gold is trading around 4,355, right inside the 4,340 - 4,400 battle zone.
The lower side of the range, 4,340 - 4,355, is the first support area. As long as price holds here, buyers still have a chance to keep the recovery alive.
The upper side, 4,375 - 4,400, is the bearish breaker zone. This is where the market may decide whether the current move is a real recovery or just another weak bounce before selling pressure returns.
A clean breakout above 4,400 would shift momentum toward 4,420 - 4,440. That is the next liquidity and repricing area. If buyers can hold above 4,440, the upside structure becomes stronger.
But if gold breaks below 4,340, the recovery weakens. That would expose 4,300 - 4,280 again.
Key Levels
Current price: 4,355
Main support: 4,340 - 4,355
Decision range: 4,340 - 4,400
Bearish breaker: 4,375 - 4,400
Next upside zone: 4,420 - 4,440
Higher bullish trigger: Above 4,440
Downside area if support fails: 4,300 - 4,280
Trading Plan
Buy Scenario
Entry: 4,340 - 4,355 after bullish confirmation
SL: Below 4,320
TP: 4,375 / 4,400 / 4,420
Buyers need to defend this support zone with a clear reaction. If price holds, gold may continue recovering toward the 4,400 resistance.
Breakout Buy Scenario
Entry: Above 4,400 after breakout and retest
SL: Below 4,365
TP: 4,420 / 4,440 / 4,480
A clean break above 4,400 would show stronger buyer control and may open the weekly upside path.
Sell Scenario
Entry: 4,375 - 4,400 after bearish rejection
SL: Above 4,420
TP: 4,355 / 4,340 / 4,300
If gold reaches the breaker zone and fails to break higher, sellers may use that rejection to push price back into the lower range.
Breakdown Sell Scenario
Entry: Below 4,340 after breakdown and retest
SL: Above 4,365
TP: 4,300 / 4,280 / 4,250
A break below 4,340 would damage the recovery structure and shift focus back to lower liquidity.
Overall View
Gold is sitting in the most important zone of the week.
Above 4,400, buyers start to gain control.
Below 4,340, sellers regain the advantage.
Between 4,340 and 4,400, patience matters more than prediction.
For now, the plan is simple: watch the reaction, wait for confirmation, and do not chase the middle of the range.
Will gold break 4,400 and open the recovery path, or will sellers defend the zone and send price back toward 4,300?
Long 
XAUUSD 4360 trapped — 4250 or 4500 first? XAUUSD 4360 trapped — 4250 or 4500 first?
Gold ended the recent recovery right at the 4,400 area.
That rejection matters.
The bounce from the six-week low was strong enough to show buyers are not dead, but not strong enough to confirm full bullish control. Price is now stuck around 4,360, sitting under the LTF Bearish OB and still below the larger Premium PD Array.
This is the kind of zone where gold can trap both sides.
Buyers see recovery.
Sellers see rejection.
The chart says: wait for confirmation.
The key level for this week is 4,334.
As long as gold holds above 4,334, price can still attempt another push toward the LTF Bearish OB around 4,375 - 4,400. If that zone breaks cleanly, the next upside target becomes 4,450, then the Premium PD Array / Sell POI around 4,485 - 4,510.
But if gold fails at 4,375 - 4,400 again, I would expect sellers to press back toward the Discount PD Array around 4,250 - 4,235. That zone is important because it lines up with the SSL / bullish reaction area. If gold sweeps that area and rejects, buyers may try to rebuild from there.
Main view for this week:
Gold is mixed, but still not clean bullish below 4,400 - 4,510.
The daily picture is also not fully clear. RSI is neutral, USD is trying to stabilize, and geopolitical risk ahead of the Trump-Xi meeting can keep flows unstable. That means gold may spike both ways before choosing direction.
Trading map:
Current price: 4,360
Key short-term support: 4,334
Buy reaction zone: 4,250 - 4,235
LTF Bearish OB: 4,375 - 4,400
Premium sell zone: 4,485 - 4,510
Upside liquidity: 4,450 - 4,510
Downside liquidity: 4,250 - 4,235
Trade idea:
Buy only if gold holds above 4,334 and breaks 4,400 with clean candles.
Target: 4,450, then 4,485 - 4,510.
Sell only if gold rejects 4,375 - 4,400 or reaches 4,485 - 4,510 and fails.
Target: 4,334 first, then 4,250 - 4,235.
Invalidation for bearish view: strong hold above 4,510.
Invalidation for bullish recovery: clean break below 4,235.
For now, I’m reading this as a recovery into resistance, not a clean reversal yet.
This week is simple: 4,400 decides the trap. 4,250 decides the real buyer reaction.
You think gold breaks 4,400 first, or sweeps 4,250 before the next move?
Short 
XAUUSD — 4,300 Is the Weekly Magnet XAUUSD — 4,300 Is the Weekly Magnet
Gold is starting the new week in a tricky position. Price ended last week with a small recovery after three straight weeks of pressure, but the chart still does not look fully clean for buyers yet.
The main reason is structure. Gold has been moving inside a wider corrective environment, with repeated CHoCH and BOS signals showing both sides fighting for control. The latest recovery pushed price back toward the 4,360 area, but it is now slowing around short-term structure resistance. That tells me buyers are trying, but they have not fully taken control yet.
From the macro side, gold received some support from weaker crude oil prices, while the Fed rate hike to 3.75% - 4.00% came in line with expectations. That means the market may not react only to the rate hike itself, but more to the forward guidance: whether the Fed keeps a hawkish tone or starts showing signs of slowing down. For gold, that makes this week more about reaction zones than chasing one direction too early.
My main view for this week is a bearish pullback first, then watch for buyer reaction around discount. If gold stays below 4,380 - 4,400, I think price can rotate lower toward the FVG area around 4,320 - 4,300. That zone is important because it sits below the current structure and may act as the next liquidity magnet before buyers decide whether to defend the market again.
For newer traders, this is the simple story: gold may still recover later, but before a stronger upside move, the market often comes back to refill imbalance, sweep weak buyers, and test real demand. That is why I do not want to chase gold around 4,360. I would rather see how price reacts if it returns to 4,320 - 4,300.
If gold taps that FVG and shows strong rejection, then a recovery back toward 4,360 - 4,380 is possible. A clean break above 4,400 would make the bullish recovery more serious and could open the path toward 4,440 - 4,460.
But if 4,300 fails, the next downside pressure may extend toward 4,260 - 4,240. That would mean sellers are still controlling the bigger weekly structure.
Key Price Zones to Watch
Current price area: 4,350 - 4,365
Short-term resistance: 4,380 - 4,400
Bullish recovery confirmation: clean break above 4,400
Upside target if buyers regain control: 4,440 - 4,460
Main FVG / reaction zone: 4,320 - 4,300
Deeper support if FVG fails: 4,260 - 4,240
Weekly bearish pressure remains valid while price stays below 4,400
Main view: wait for gold to test the 4,320 - 4,300 FVG. A strong reaction there may support recovery, but failure to hold that zone can open another bearish leg toward 4,260.
Do you think gold will defend 4,300 this week, or will sellers use this recovery to push price lower again?
Short 
 Long
Long
XAUUSD 15M SETUP | GOLD VS USDBIAS: Bullish — conditional
🟢 BUY ZONE: 4,340–4,345
Wait for a liquidity sweep + bullish MSS/confirmation before entering.
ENTRY: 4,345–4,350
SL: 4,325
TP1: 4,380
TP2: 4,400
TP3: 4,420,
TP4: 4,460
🔴 Invalidation: Clean 15M close below 4,340 → bullish setup invalid.
Reason: Price is holding the marked support zone around 4,340. A confirmed bullish reaction from this area could target the 4,400 resistance first, followed by 4,420+.
Rule: No confirmation = No trade.
Risk management > prediction.
EDUCATIONAL PURPOSES ONLY* Long 
GOLD IS APPROACHING THE BIG TEST.Gold has been trapped between 4,340 and 4,400, building pressure and compressing inside this range.
But now, all eyes are on 4,400–4,420.
This is where the story could change.
If Gold breaks and holds above 4,420, the previous bearish momentum may finally be losing control — opening the door toward 4,480, 4,500, 4,580 and even 4,600.
But if sellers defend this zone again...
Then the bearish move may not be over yet.
For now, I’m watching how Gold behaves around the lower support zones:
4,340 → 4,300 → 4,250.
Personally, I’m still looking for buy-the-dip opportunities.
Because sometimes...
the biggest move starts after the market gets squeezed for long enough.
4,420 — watch this level. Long 
XAUUSD — 4,500 Is the Real Test XAUUSD — 4,500 Is the Real Test
Gold is trying to recover, but this is not the type of chart where I want to get emotional too early.
After the strong selloff from the late-August high, price broke the clean bullish structure and started building a wider bearish correction. That bigger damage is still there. But now gold is holding around the 4,350 area, and more importantly, price closed back above the 100-day SMA zone near 4,320. That tells me buyers are not fully gone yet.
The macro side also supports this pause. USD is trading more quietly as oil prices and US Treasury yields ease, while RSI on the daily chart is sitting in a more neutral zone. In simple words, sellers still have the bigger structure, but they are not pushing with the same strength right now.
From an SMC view, the current recovery looks like a move from the bullish OB / demand area around 4,250 - 4,290. As long as price holds above 4,320 - 4,330, I think gold can continue climbing toward the internal supply and bearish mitigation block around 4,460 - 4,500.
But here is the trap: a push into 4,480 - 4,500 does not automatically mean gold is bullish again. That area is exactly where sellers may try to reload. It is also close to the previous broken structure, so late buyers can easily get caught if price rejects there.
My main view is short-term bullish recovery while gold holds above 4,320, but I will treat 4,460 - 4,500 as the real decision zone. If buyers reclaim that area cleanly, gold can open a wider recovery toward 4,600 - 4,635. But if price rejects from there, the market may rotate back down toward 4,300 and possibly 4,250 again.
Key Price Zones to Watch
Current reaction area: 4,350 - 4,365
Main support / 100-day SMA area: 4,320 - 4,330
Bullish OB / demand zone: 4,250 - 4,290
Internal supply / bearish mitigation block: 4,460 - 4,500
HTF bearish OB: 4,630 - 4,690
Major downside support: 4,030 - 4,060
Bullish confirmation: clean reclaim above 4,500
Bearish rejection signal: failure around 4,460 - 4,500
Invalidation for recovery: clean break and hold below 4,320
Do you think gold can reclaim 4,500, or is this recovery only setting up another sell reaction from supply?
Long 
XAUUSD: Recovery Is Here, But 4,445 Is the Trap Zone XAUUSD: Recovery Is Here, But 4,445 Is the Trap Zone
Market Context
Gold is holding its recent recovery from the six-week low around 4,235, but the market is still cautious near the end of the week.
The US Dollar is trading quietly as oil prices and Treasury yields cool down, helping gold recover in the short term. Gold also closed above the 100-day SMA around 4,320, while the daily RSI remains neutral.
This tells us one thing: buyers are reacting, but they have not fully taken control yet.
Technical Structure
Gold is recovering into a sensitive resistance area after the strong rebound from the weak low.
Price is currently trading around 4,390 - 4,395, approaching the Main Sell Reaction Zone and LTF Supply area. This is where short-term buyers may start facing pressure again.
The key resistance zone is 4,420 - 4,445. This area overlaps with HTF Supply and the Major Premium POI, which makes it an important sell reaction zone. If gold pushes into this area and gets rejected, bearish pressure may return quickly.
Above that, 4,488 is the key liquidity reference. A clean break above 4,488 would weaken the bearish setup and open the door for a stronger recovery.
Below current price, 4,350 - 4,360 is the first reaction support. If gold loses this area, the next downside risk may return toward 4,280 and potentially the 4,235 weak low.
Key Levels
Current Price: 4,393
Main Sell Reaction Zone: 4,420 - 4,445
LTF Supply / Internal Bearish POI: 4,350 - 4,390
Key Liquidity Level: 4,488
First Support: 4,350 - 4,360
Weak Low: 4,235
Bullish Recovery Confirmation: Above 4,488
Bearish Pressure Zone: Below 4,420 - 4,445
Trading Plan
Primary Sell Scenario
Entry: 4,420 - 4,445 after bearish confirmation
SL: Above 4,488
TP: 4,360 / 4,320 / 4,280
Condition: Price recovers into the HTF Supply zone but fails to break higher. A rejection from this area would suggest sellers are still defending the premium zone.
Short-Term Buy Continuation Scenario
Entry: Above 4,445 after breakout and retest
SL: Below 4,390
TP: 4,470 / 4,488 / 4,520
Condition: Buyers must break through the Main Sell Reaction Zone and hold above it. Without acceptance above 4,445, the recovery remains vulnerable.
Support Reaction Scenario
Entry: 4,350 - 4,360 after bullish confirmation
SL: Below 4,320
TP: 4,390 / 4,420 / 4,445
Condition: Gold must show a clean reaction from the first support area. This is only a recovery setup unless price breaks above 4,445 with strength.
Breakdown Sell Scenario
Entry: Below 4,350 after breakdown and retest
SL: Above 4,390
TP: 4,320 / 4,280 / 4,235
Condition: Gold loses the recovery base and fails to reclaim it. This would expose lower liquidity again and keep the bearish structure active.
Overall Bias
Gold is recovering, but the recovery is moving directly into a dangerous supply zone.
The market may look bullish in the short term, but 4,420 - 4,445 is the real test. If buyers cannot break this area, sellers may use the recovery as another opportunity to push price lower.
Above 4,488, the bearish view starts to weaken. Below 4,350, the recovery loses strength and downside risk returns.
Best approach: do not chase the rebound late. Wait for either a confirmed rejection from 4,420 - 4,445 or a clean breakout above 4,488.
Will gold break through the premium supply zone, or will sellers turn this recovery into another trap?
Long 
ACE : Strong Bullish Breakout Above Resistance.Directional Bias: Long
Technical Analysis & Reasoning:
The daily chart for Action Construction Equipment Limited presents a compelling long setup based on a clear technical breakout.
Horizontal Resistance Breakout: Price action has decisively broken above the key overhead resistance line at 1,191.1 INR. This level previously acted as a ceiling for the price, and breaking it indicates a strong shift in market momentum.
Bullish Price Action: The stock is maintaining a steady uptrend characterized by consistent higher highs and higher lows since June. The current daily candle is strongly bullish, trading around 1,229.2 INR (+1.96%), showing strong conviction from buyers following the breakout.
Volume Support: The recent upward price action and breakout are accompanied by visible volume clusters at the bottom of the chart, validating the move and suggesting broad market participation.
Trade Idea & Levels:
Entry: Scaling in near the current price of 1,229 INR, or waiting for a potential minor pullback to retest the 1,191.1 INR level (previous resistance turning into new support).
Stop-Loss: A daily close below the recent consolidation zone (around the 1,140–1,150 INR level) to protect capital against a false breakout scenario.
Target: As the stock is clearing major resistance, traders can utilize trailing stops to ride the upward momentum or target psychological round numbers (like 1,300 INR) depending on individual risk-reward preferences. BRIAN XAUUSD – GOLD HOLDS VALUE BEFORE NEXT MOVE BRIAN XAUUSD – GOLD HOLDS VALUE BEFORE NEXT MOVE
Gold is still trading inside a sensitive value area after the recent recovery attempt from the lower structure.
The macro background remains mixed. Gold recently received support from weaker oil prices and softer US Treasury yields, which reduced some upside pressure on the US dollar. However, the Fed’s September policy stance remains restrictive, and that keeps the market careful. When gold is supported by weaker yields but still capped by Fed uncertainty, price often moves inside value before choosing the next clean direction.
That is exactly what the chart is showing now.
Gold is not breaking strongly higher yet, but sellers have also not managed to push price back into a deeper bearish continuation. The current structure is a decision zone.
Technical structure
On the H3 chart, gold is trading around 4,390 - 4,400 after recovering from the recent downside channel.
The first important zone is the POC / Value Support – Key Acceptance Zone around 4,350 - 4,370. This area has acted as the main base where price started to stabilize again. As long as gold remains above this zone, buyers still have a chance to build another recovery leg.
Above the current price, the nearest reaction area is around 4,433 - 4,450. This is the upper value / HVN area and also the first important level where price may face short-term selling pressure. If gold breaks and accepts above this area, the next upside path can open toward the larger sell zone at 4,594 - 4,628.
That 4,594 - 4,628 zone is the major resistance on this chart. It sits below the highest price area of the week and represents a potential seller interest zone if gold rallies too aggressively without strong acceptance.
On the downside, if gold loses the 4,350 - 4,370 value support, the structure becomes weaker again. In that case, the market may rotate lower before buyers can create another meaningful reaction.
Important zones
Current price area: 4,390 - 4,400
Gold is recovering but still below the first upper value resistance.
POC / Value Support: 4,350 - 4,370
Main buyer defense zone and key acceptance area.
Upper Value / HVN: 4,433 - 4,450
First resistance and short-term reaction area.
Buyside liquidity: 4,350 - 4,380
Liquidity zone where price may retest before any stronger move.
Sell zone: 4,594 - 4,628
Major upper resistance and potential seller interest area.
Weekly high area: 4,650+
The highest price area of the week and the larger liquidity reference.
Trading scenario
Priority view: buy reaction if 4,350 - 4,370 holds
Entry:
Look for buy positions only if gold holds above the POC / Value Support around 4,350 - 4,370 and shows clear bullish rejection.
Stop Loss:
Below the local sweep low or below the value support zone.
Take Profit:
TP1: 4,433 - 4,450
TP2: 4,594 - 4,628
TP3: Trail higher only if gold breaks and accepts above the sell zone
This setup follows the current value-support reaction. Buyers are not fully dominant yet, but the structure still allows a recovery if the POC base holds.
Alternative sell scenario
If gold reaches 4,594 - 4,628 and shows strong rejection, sellers may try to rotate price lower again.
Entry:
Look for sell positions only if gold rejects clearly from the 4,594 - 4,628 zone.
Stop Loss:
Above the rejection high or above the weekly liquidity area.
Take Profit:
TP1: 4,450
TP2: 4,370
TP3: 4,350 if downside pressure expands
A sell setup from the upper zone is only cleaner if price reaches resistance first. Selling directly in the middle of value is not ideal.
Final view
Gold is currently holding value after a difficult corrective phase.
The short-term structure is trying to recover, but the market still needs confirmation above 4,433 - 4,450 before buyers can regain stronger control. If that zone breaks, the next larger target becomes 4,594 - 4,628.
For now, my map is simple:
Hold 4,350 - 4,370 = buyers still defend value.
Break 4,450 = recovery momentum improves.
Reach 4,594 - 4,628 = major resistance test.
Reject 4,594 - 4,628 = sellers may return.
Lose 4,350 = gold may rotate lower again.
Gold is not a clean chase market right now. It is still a value-confirmation market.
The key is whether buyers can keep price above the POC support and force acceptance above the upper value area. If they can, gold may continue toward the major sell zone. If not, the market may stay trapped inside value before the next bigger move.
Will gold reclaim the upper value zone, or will sellers defend 4,594 - 4,628 again?
Long 
XAUUSD – Gold Attempts Recovery Below Downtrend Line XAUUSD – Gold Attempts Recovery Below Downtrend Line
Gold is trying to recover from the recent low area, but the market is still trading inside a broader bearish structure.
Price is now around 4,350 after reacting from the 4,279 support zone. This bounce shows that buyers are defending the lower range, but the recovery still needs confirmation because gold remains below the descending trendline and below the next resistance levels.
From the market side, gold is still facing pressure from stronger Fed rate-hike expectations, elevated U.S. yields, and a firmer USD. Geopolitical risks can create short-term safe-haven demand, but so far they have not been strong enough to fully shift the technical picture back to bullish.
Technical view:
Gold reacted from the 4,279 support area.
Price is now testing the 4,338 – 4,356 resistance region.
The short-term recovery is improving, but still not confirmed.
The downtrend line remains the main barrier above current price.
A clean break above 4,356 may open the way toward 4,378.
If 4,378 breaks, the next upside target is 4,416.
If gold fails around 4,338 – 4,356, sellers may try to push price back toward 4,315 and 4,279.
Key levels to watch:
Current price: 4,350
Main support: 4,279
Short-term support: 4,315
Current resistance: 4,338 – 4,356
Next resistance: 4,378
Upper target: 4,416
Bearish invalidation zone: above 4,416
Main scenario:
If gold holds above 4,315 and breaks cleanly above 4,356, buyers may continue the recovery toward 4,378.
A stronger bullish confirmation would come only if price breaks the downtrend line and holds above 4,378.
If that happens, gold may extend toward 4,416, where sellers may appear again.
Alternative scenario:
If gold rejects from 4,338 – 4,356 and fails to hold 4,315, the recovery structure becomes weaker.
In that case, price may move back toward 4,279. A clear break below 4,279 would return more pressure to sellers and may continue the bearish channel movement.
Hannah’s view:
Gold is showing a recovery attempt, but not a clean bullish reversal yet.
The chart is still controlled by the descending trendline, so I do not want to chase the move while price is sitting near resistance. Buyers need to prove strength above 4,356 first.
Main view: gold can recover toward 4,378 and 4,416 if 4,315 holds and 4,356 breaks. If price rejects from this resistance area, sellers may take control again toward 4,279. No confirmation means no trade.
Do you think gold can break the downtrend line this week, or will sellers defend 4,356 again?
Long 
Gold After FOMC: The Battle at 4,400–4,420After FOMC, Gold has absorbed almost the entire selling pressure and bounced strongly from 4,234. Buyers have now regained most of their previous position, while M15 & H1 have formed bullish structures.
🔴 Key Decision Zone: 4,400–4,420
This is the final line of defense for sellers.
Rejection: Watch the reaction closely and look for a potential Sell scalp.
Break & Hold: Shift focus to Buy on pullbacks, with potential targets at 4,460 → 4,480 → 4,500 → 4,580 → 4,600.
🟢 Support Levels:
4,340 → 4,305 → 4,260
📌 Today’s Bias:
Prioritize Buy the dip. Sell scalps can still be considered around resistance, but stop looking for Sell setups if price breaks and holds above 4,420.
Market Psychology:
Sellers made a strong effort to keep the bearish move alive after FOMC, but they have not been able to maintain the downside momentum. The key question now is no longer “Can Gold continue lower?” but:
“Can sellers defend 4,400–4,420?”
4,420 is the line that matters. A clean break could mark the beginning of a new bullish wave. Long 

 Long
Long