XAUUSD: Geopolitical Hesitation vs. High-Timeframe Range1. Technical Price Structure
The Current State: Price actions stands exactly where it started prior to the London session. XAUUSD remains heavily compressed and stuck within our defined Higher Timeframe (HTF) Supply Zone.
The Resistance Barrier: As tracked in our morning analysis, a break and a secure candle close above this critical supply zone was required to validate an immediate bullish continuation toward 4425.
The Reality on the Tape: The market has officially failed to break out. The bears defended the zone, and price has failed to close a single significant candle body above 4364.
⚡ 2. Forward-Looking Execution Scenarios
Because the 4hr supply structure held firm, our focus now shifts entirely to defensive premium management and waiting for discount pricing.
The Retracement Path: If the current lack of buying momentum forces a deep, programmatic pullback, do not chase short positions into late session traffic.
The Institutional Demand Zone: Keep a sharp lookout on 4234. This level marks a high-probability, unmitigated institutional demand pocket. If price retraces here, we will look for lower-timeframe shift indicators to validate a high-probability buying re-entry.
My View with Geo Politics & NY Session Today :
"Why the quiet NY Open? Because institutional investors don't chase headlines—they wait for confirmation. The framework of the peace deal caused the initial weekend gap, but the actual execution is 3 days away. Until the contract is officially signed, big money is staying watchful and protective. Expect choppy, range-bound behavior until the ink dries."
Disclaimer: This tracking is purely educational. Keep your risk tightly managed as the market processes the mid-week headlines. TRADE LIKE VIRAT KOHLI BATSTrade Like Virat Kohli Bats.
Not every ball deserves a shot. Not every candle deserves a trade.
Let me ask you something.
When Kohli walks into bat, does he swing at the very first ball? No. He watches it. He reads the pitch. He understands the bowler. He waits for the right delivery — and then he plays his shot with full conviction.
That is exactly how great traders approach the market.
The Cricket-Trading Parallels That Will Stick With You Forever:
1. You do not have to play every ball.
In cricket, leaving a ball outside off-stump is smart, not cowardly. In trading, skipping a mediocre setup is discipline, not weakness. Not trading is a position. A valid one.
2. One bad over will not end your innings.
Every batsman faces tough spells. Bumrah bowls three dots. You do not retire — you reset. In trading, a losing streak does not mean you quit. It means you reassess and come back stronger.
3. Consistency beats sixes every time.
Kohli's Test average is built on 40s and 50s, not only centuries. In trading, making steady 2-3% every month beats gambling for a 50% return and losing 60%.
4. Know when the pitch is against you.
On a sticky wicket, even Kohli plays cautiously. When the market is uncertain and choppy — reduce position size, tighten your game. Do not play your big shots in a thunderstorm.
5. The crowd noise does not change the game.
Kohli blocks out the noise and focuses on the ball. Twitter, YouTube gurus, WhatsApp tips — none of that is the ball. Your chart is the ball. Your plan is the bat. Everything else is crowd noise.
The next time you are about to jump into a random trade, ask yourself: "Is this the right ball to hit?"
If the answer is not a clear YES — leave it.
This post is intended for educational and informational purposes only and reflects a personal perspective on trading psychology and decision-making.  Education
 Short
Short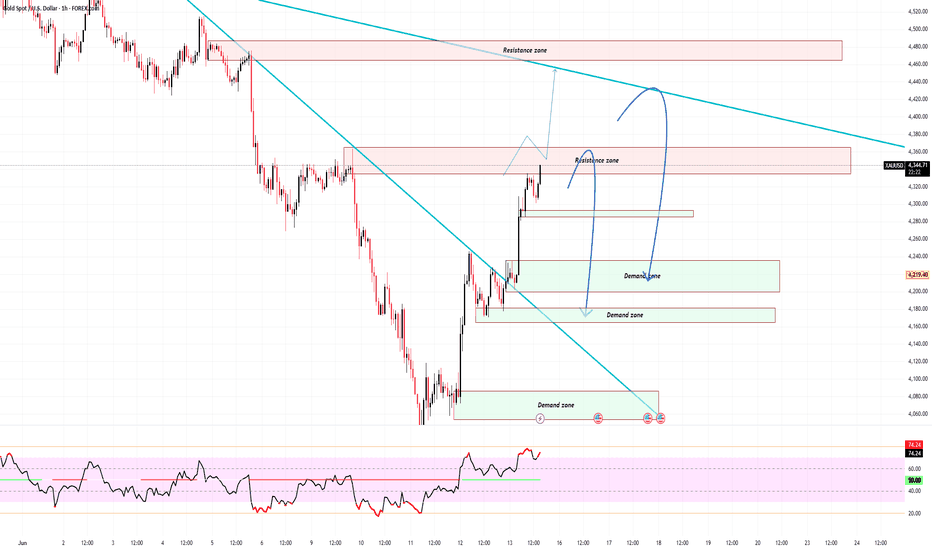
 Short
Short
XAUUSD GOLDXAUUSD GOLD — Weekly Outlook | 1H Structure 🗓️
Gold is compressed within a tight range on the 1H timeframe after a sharp intraday selloff. Price is now consolidating near a critical support zone, with the structure pointing toward a defined two-step move — a brief relief bounce followed by a deeper continuation lower.
📌 Key Levels:
🔺 Bounce Target — 4,389.482
🔻 Downside Targets — 4,397.918 collapse → 4,248.752
📐 Structure: After rejecting from the 4,517 area, Gold compressed sharply and is now sitting near the 4,389 support zone. The marked path shows a brief bounce toward the 4,397 resistance level, where sellers are expected to aggressively step in. From there, a clear path opens toward 4,248.752 — a major horizontal demand zone where institutional buyers typically defend. The structure remains bearish until price stabilizes above the 4,397 level on multiple closes.
⚠️ Macro This Week: Gold prices are expected to be highly volatile this week amid the Fed’s interest rate decision and the release of the Philadelphia Fed Manufacturing index . The FOMC Meeting on June 16-17 is the dominant event — markets overwhelmingly expect rates to remain unchanged, but Fed Chair Kevin Warsh’s economic projections and guidance regarding potential rate cuts later in 2026 will be the real focus. Additionally, a US-Iran peace deal announcement could shift safe-haven demand dynamics sharply either direction.
📖 Educational analysis only. Not financial advice. XAUUSD — Early Week Bullish Plan, Buy Setups Remain Priority
Gold is trading around $4,327 after a strong recovery from the low area near $4,024. Price has already created CHoCH, reclaimed short-term structure, and is now moving toward the buy-side liquidity around $4,363.
From an SMC perspective, the market swept sell-side liquidity first, then reacted strongly from the lower demand area. The current structure supports a bullish continuation scenario for the start of the week, especially while gold holds above the key buy zones below.
The main upside target is the FVG zone around $4,425–$4,455. I prefer to wait for price to pull back into clean liquidity areas instead of chasing the current move.
Buy setup 1
Condition:
Gold pulls back into the nearest liquidity zone and shows bullish rejection with lower-timeframe MSS / CHOCH.
Entry: $4,295–$4,310
SL: below $4,275
TP1: $4,363
TP2: $4,425
TP3: $4,455
Buy setup 2
Condition:
Gold fills the gap into the OB / FVG area and buyers defend the zone clearly.
Entry: $4,205–$4,220
SL: below $4,180
TP1: $4,295
TP2: $4,363
TP3: $4,425
Buy setup 3
Condition:
If gold makes a deeper pullback into the FVG + CHoCH zone, I will wait for strong bullish rejection before considering a buy.
Entry: $4,105–$4,125
SL: below $4,075
TP1: $4,205
TP2: $4,295
TP3: $4,363
Sell setup
Condition:
Selling is not the priority. A sell setup is only considered if gold rejects strongly from the $4,425–$4,455 FVG target zone and prints bearish MSS / CHOCH.
Entry: $4,425–$4,455 after rejection
SL: above $4,475
TP1: $4,363
TP2: $4,310
TP3: $4,220
Key levels
Current price area: $4,327
Buy 1 liquidity zone: $4,295–$4,310
Buy 2 OB / gap fill zone: $4,205–$4,220
Buy 3 FVG + CHoCH zone: $4,105–$4,125
Buy-side liquidity: $4,363
Main FVG target: $4,425–$4,455
Bullish invalidation: clean 1H close below $4,075
My early week view is bullish while gold holds above the major buy zones. The best Prime Gold plan is to wait for price to return into liquidity, confirm rejection, and then follow the next upside move.
No confirmation, no trade.
Long 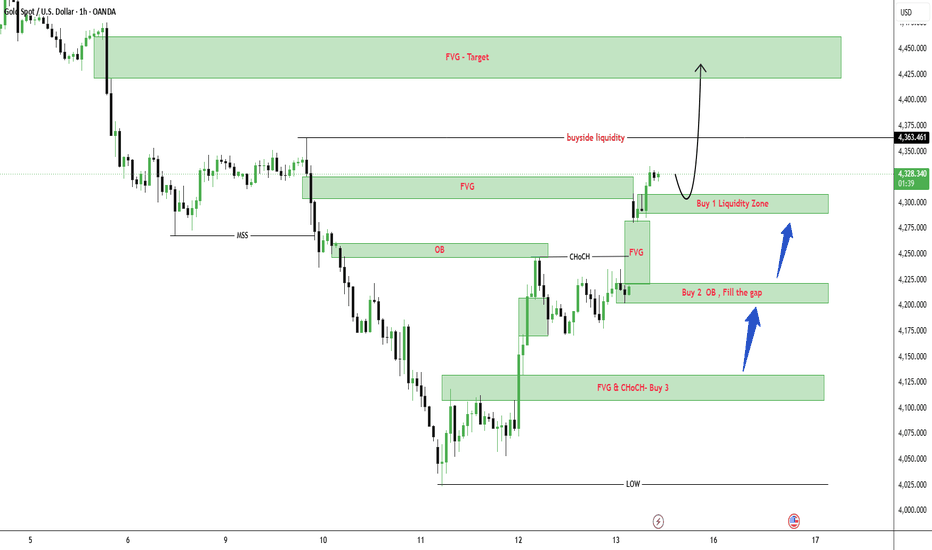
S&P 500: Is the correction already over?After an impressive rally from the April lows, the S&P 500 has entered a period of consolidation rather than a full-scale reversal. Despite the recent pullback, the broader market structure remains constructive, and buyers continue to defend key support levels. The index remains the benchmark for global risk appetite, making its next move particularly important for investors across all asset classes.
From a fundamental perspective, market participants continue to focus on the trajectory of inflation, expectations regarding future Federal Reserve policy, and the resilience of corporate earnings. Stronger-than-expected economic data could support the bullish case, while renewed concerns over growth or monetary tightening may trigger another wave of volatility. The market is currently balancing optimism with caution.
From a technical standpoint, this analysis is based on the daily timeframe. Following the sharp advance from the spring lows, the index encountered resistance near the upper boundary of the rising structure and entered a corrective phase. However, instead of accelerating lower, price found demand within the 7,250–7,300 support zone and quickly recovered. The ability of buyers to defend this area suggests that the recent decline may represent a correction within a broader uptrend rather than the beginning of a deeper bearish move.
As long as the S&P 500 remains above the 7,250 support area, the primary scenario favors a continuation higher. The first upside target is located near 7,740, corresponding to the 0.382 Fibonacci level and the next significant resistance zone. A successful breakout above that area could pave the way toward 8,040, where the 0.618 Fibonacci extension may become the next major objective for the bulls.
The alternative scenario becomes relevant if the index loses the 7,250 support and establishes acceptance below it. Such a development would increase the probability of a deeper correction and force market participants to reassess the current bullish structure. Until that happens, buyers retain the strategic advantage.
In my opinion, the S&P 500 is approaching another critical decision point. The recent pullback has tested confidence, but it has not yet damaged the larger trend. If buyers continue to absorb selling pressure around support, the market may be preparing for the next leg higher. The reaction around the highlighted levels should provide valuable insight into the direction of the coming weeks.
This publication reflects my personal opinion and should not be considered investment advice.  Long
Long
 Long
Long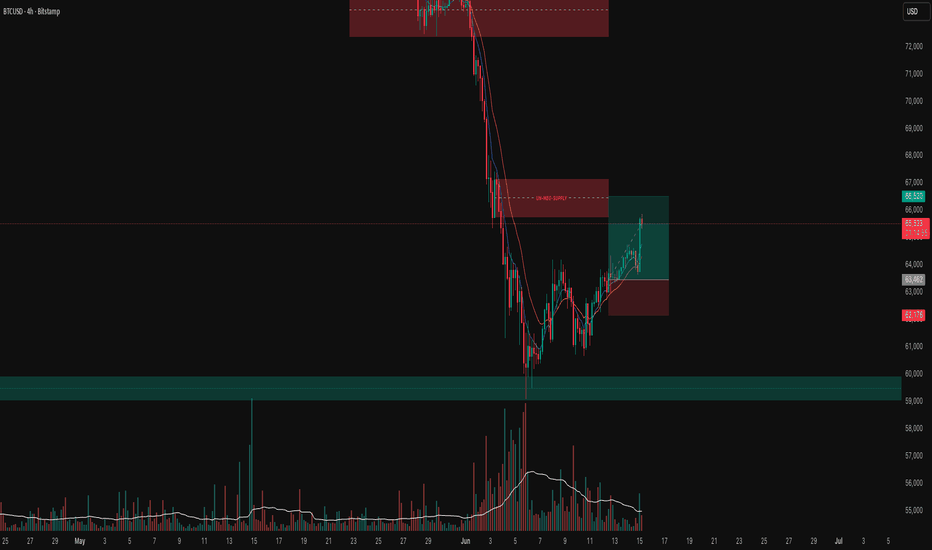
Jay Bharat Maruti Ltd - Weekly ChartTechnical View
Jay Bharat Maruti has delivered a strong breakout above key resistance zone, supported by significant increase in trading volume the stock is currently trading at fresh multi-year highs, indicating improving momentum and renewed market participation. Sustaining above the breakout area will be crucial, as it can potentially transform the previous resistance into a strong support zone. The overall price structure remains bullish, characterized by higher highs and higher lows, while the volume expansion adds credibility to the move. Market participants should closely monitor price action around the breakout region for confirmation of continued strength.
Fundamental View
Remains well-positioned within India's growing automotive components sector. The company's future performance will largely depend on factors such as revenue growth, profitability, margin expansion, order book strength, and its ability to capitalize on increasing demand from the automobile industry. Investors should also track management commentary, capacity expansion plans, operational efficiency improvements, and developments within the passenger vehicle ecosystem a combination of improving business fundamentals and sustained technical strength could support the company's long-term growth trajectory.  Long
Long
 Short
Short
Long 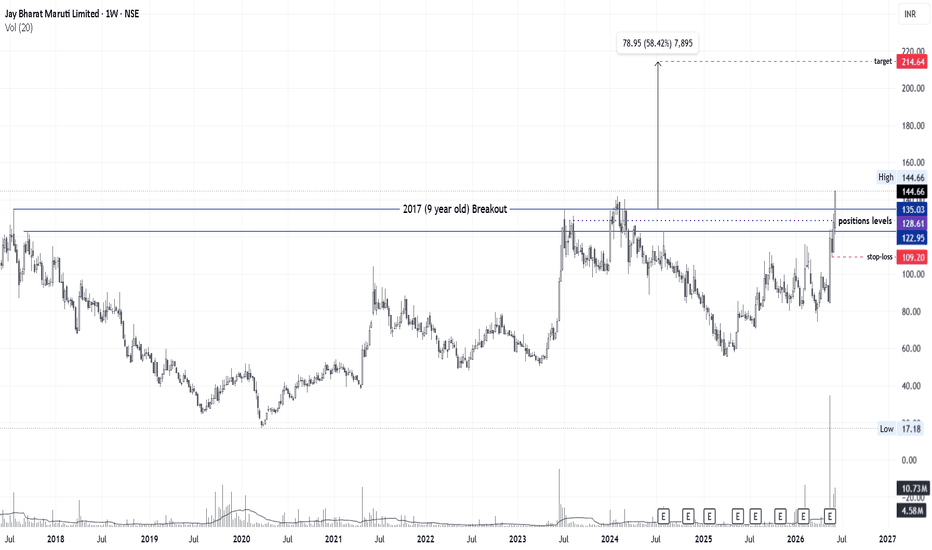
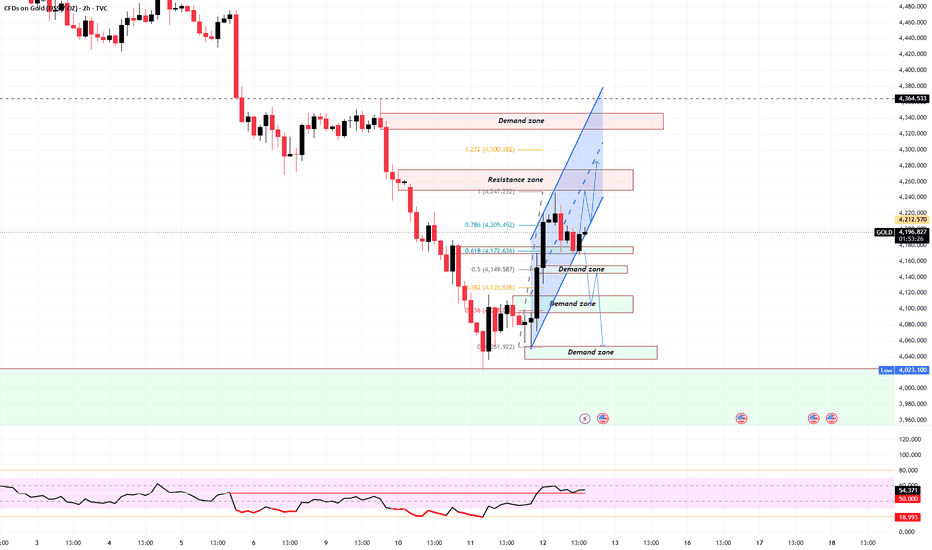
XAUUSD – H1 Bearish Structure Remains Active Below Sell Zone
Gold is still trading under short-term bearish pressure on the H1 chart. After the sharp decline from the upper liquidity area, price is now moving inside a corrective structure, but the recovery remains limited below the key sell zone around 4,247 – 4,254.
FUNDAMENTAL ANALYSIS
Gold is still reacting to the U.S. dollar, Treasury yields and upcoming U.S. data. For now, the technical structure remains more important because price has not confirmed a strong bullish reversal yet.
As long as gold stays below the main resistance and sell zone, the short-term view remains cautious and sellers may continue to defend higher prices.
TECHNICAL ANALYSIS – SMC + FIBONACCI
From an SMC perspective, gold has already created a strong bearish displacement on H1. The market broke below previous support, then formed a recovery from the lowest support this week around 4,022.
However, the current rebound is still trading below the major liquidity zone and below the SMA 200. This means the upside move may only be a corrective pullback before sellers react again.
The sell entry zone around 4,247 – 4,254 is the key area to watch. This zone sits near the previous breakdown area and may act as a resistance test. If price reaches this area and shows rejection, the bearish continuation setup becomes more attractive.
The lower liquidity area around 4,175 – 4,185 is also important. If gold breaks below this zone, sellers may push price toward the buy-test resistance around 4,119, then possibly back to the weekly low at 4,022.
KEY PRICE ZONES TO WATCH
Current price area: 4,218
Liquidity support zone: 4,175 – 4,185
Buy-test resistance: 4,119
Sell entry zone: 4,247 – 4,254
Major resistance: 4,269
Upper liquidity zone: 4,375 – 4,400
Lowest support this week: 4,022
Main bearish target: 4,119 – 4,022
Invalidation area for sell view: Above 4,269
TRADING SCENARIOS
Sell Scenario – Priority H1 View
If gold recovers into the 4,247 – 4,254 sell zone and shows rejection, I will watch for a bearish continuation setup.
Sell Zone: 4,247 – 4,254
Entry Condition: Bearish rejection, failed breakout, lower-timeframe CHoCH, or strong bearish displacement from the sell zone.
Stop Loss: Above 4,269 or above the nearest swing high.
Take Profit:
TP1: 4,175 – 4,185
TP2: 4,119
TP3: 4,022
Alternative Sell Scenario
If gold breaks below the 4,175 – 4,185 liquidity zone with strong momentum, sellers may return earlier without waiting for a higher pullback.
Sell Condition: Wait for a clean break below the liquidity zone, then watch for a retest and rejection.
Target: 4,119 – 4,022
Buy Scenario – Only Short-Term Reaction
A buy setup is not the main view on H1. However, if gold sweeps the 4,175 – 4,185 liquidity zone and quickly recovers, a short-term corrective bounce may appear.
Buy Zone: 4,175 – 4,185
Entry Condition: Liquidity sweep, bullish rejection, or lower-timeframe bullish CHoCH.
Take Profit:
TP1: 4,218
TP2: 4,247 – 4,254
Invalidation: If price breaks and holds below 4,175, the buy idea is invalid.
MY VIEW ON GOLD
My H1 view for gold remains bearish while price stays below the 4,247 – 4,254 sell zone and below the stronger resistance around 4,269.
The cleaner plan is to wait for price to retest the sell zone, then observe rejection on the smaller timeframe. If sellers defend this area, gold may continue lower toward 4,175, 4,119 and possibly 4,022.
Overall, gold can still recover slightly in the short term, but the main H1 structure remains weak unless buyers reclaim 4,269 with strong momentum.
Do you think gold will reject from the 4,247 – 4,254 sell zone, or break lower from the liquidity area first?
Short 
Gold: Buyers regain control after the reboundAfter a sharp decline earlier this month, gold is showing signs of stabilization and attempting to rebuild bullish momentum. The recent recovery from local lows has allowed buyers to reclaim several important levels, suggesting that the corrective phase may be losing strength. With ongoing geopolitical uncertainty and expectations surrounding central bank policy, XAUUSD remains one of the most closely watched assets in global markets.
From a fundamental perspective, gold continues to benefit from its status as a defensive asset during periods of uncertainty. Market participants remain focused on inflation trends, upcoming economic data, and expectations regarding future interest rate decisions. Any shift in monetary policy expectations or deterioration in risk sentiment could quickly influence the next move in precious metals.
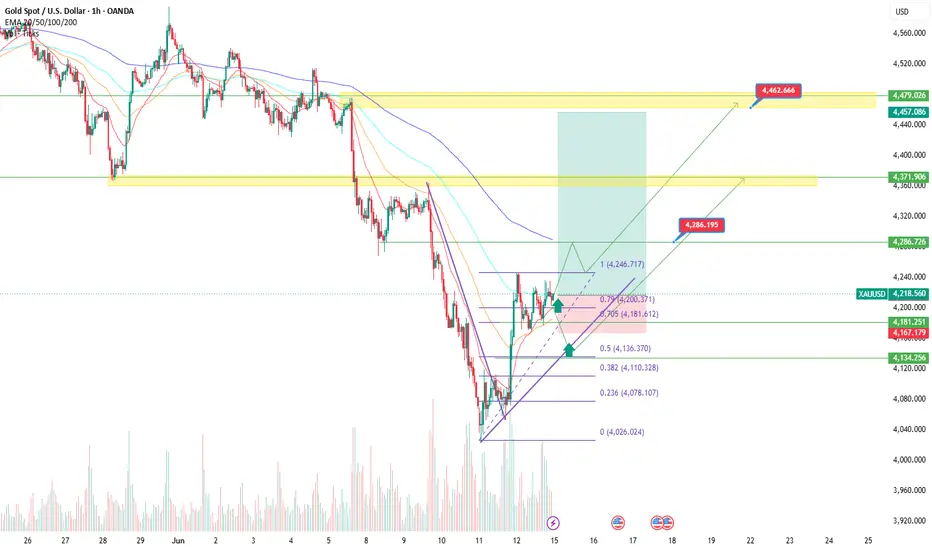
From a technical standpoint, this analysis is based on the 1-hour timeframe. Following the selloff toward the 4,026 area, gold formed a local bottom and began developing a sequence of higher lows within a rising structure. Price has reclaimed the 0.705–0.79 Fibonacci retracement zone and is currently consolidating around 4,218, indicating that buyers continue to defend the recovery.
As long as the market remains above the 4,180–4,200 support region, the bullish scenario remains valid. The first upside objective is located near 4,286, which represents the recent swing resistance. A successful breakout above that level could pave the way toward the 4,371 area. Should momentum continue to strengthen, the next major target sits near 4,462, where a higher timeframe supply zone may attract renewed selling pressure.
The alternative scenario becomes relevant if gold loses the 4,180 support region and closes below it. Such a move would increase the probability of another test of lower levels and postpone the bullish continuation scenario. Therefore, this area remains the key level for risk management.
In my view, gold is approaching an important decision point. Buyers have managed to recover from the recent decline and regain short-term control, but they still need to prove their strength by breaking through overhead resistance. The reaction around the highlighted levels should determine whether this rebound evolves into a larger trend continuation.
This publication reflects my personal opinion and should not be considered investment advice. Long 
Nifty Bias & Price Action Analysis Nifty is currently down 10.54% from its last all-time high.
Nifty entered a bearish and choppy price action phase after 6th March, when it experienced a market structure shift below 24,298 and continued to move lower.
This price action led to Nifty trading in a choppy range for nearly three months, with only minor relief rallies.
I expect two possible price paths from here. The first is the Red Path, where I expect Nifty to sweep 24,000 and then make a liquidity sweep down to 21,686 before moving back toward 26,000.
Green Path: I expect Nifty to sweep the last swing high, make a move lower to grab liquidity, and then continue higher.
Main Playbook: Nifty needs to reclaim and flip the last weekly swing high around 24,600 into support to turn bullish from a price action perspective. Otherwise, I expect the market to remain choppy and range-bound.
XAUUSD H1: Gold Recovery From Weekly Low, Can Buyers Continue XAUUSD H1: Gold Recovery From Weekly Low, Can Buyers Continue Next Week?
Fundamental Analysis
Gold ended the week with a strong recovery attempt after the sharp sell-off into the weekly low area. The market is still reacting to USD strength, inflation expectations, and cautious risk sentiment, so this recovery has not yet confirmed a full bullish reversal.
For next week, the main question is simple: can buyers protect the current recovery structure? If price continues to hold above the short-term buy zone, gold may extend higher towards the next liquidity and resistance areas. But if the lower support fails again, sellers may quickly return.
Weekly Trend Summary
During the past week, gold first continued its bearish move after the previous BOS structure. Price dropped aggressively from the upper range and reached the weekly low near 4,022.
After sweeping the low, buyers stepped in and created a strong recovery move. This shows that demand came in from the lower liquidity area, but the overall H1 structure still needs more confirmation before turning fully bullish.
The current rebound is important because price is now holding around the 4,210 area, which is acting as the short-term key level for the next move.
Technical Analysis
On the H1 timeframe, gold is recovering from the weekly low after a strong bearish leg. The current buy zone around 4,200 - 4,210 is holding the short-term structure.
If buyers continue to defend this zone, the next upside target is the FVG area around 4,340 - 4,350. A clean break above this area could open the way towards the golden low zone near 4,426, followed by the sell-side liquidity area around 4,479.
The lower support area to watch is the Buy Zone FVG and liquidity around 4,070 - 4,120. If price pulls back into this zone and buyers defend it, the bullish recovery scenario remains valid.
However, if price loses the weekly low near 4,022, the recovery structure becomes invalid and gold may return to the bearish trend.
Key Price Zones
Current price: 4,218
Short-term buy zone: 4,200 - 4,210
Buy Zone FVG and liquidity: 4,070 - 4,120
Weekly low: 4,022
FVG resistance zone: 4,340 - 4,350
Golden low zone this week: 4,426
Sell-side liquidity: 4,479
Strong high supply zone: 4,560 - 4,590
Bullish invalidation: Below 4,022
Trading Plan
Primary Scenario: Buy From Current Structure
Entry: 4,200 - 4,210 after bullish confirmation
Stop Loss: Below 4,170
Take Profit 1: 4,340 - 4,350
Take Profit 2: 4,426
Take Profit 3: 4,479
Entry Conditions
Price holds above the 4,200 - 4,210 buy zone.
Buyers show clear rejection from this area.
H1 structure continues forming higher lows.
Price should break above the nearest resistance with strength.
Avoid buying if price breaks and holds below 4,170.
Alternative Scenario: Buy From Deeper Liquidity Zone
Entry: 4,070 - 4,120 after bullish confirmation
Stop Loss: Below 4,022
Take Profit 1: 4,210
Take Profit 2: 4,340 - 4,350
Take Profit 3: 4,426
Buy Conditions
Price needs to pull back into the 4,070 - 4,120 liquidity zone and show a strong bullish reaction. A bullish CHOCH on H1 or lower timeframe would make the setup cleaner. If price breaks below 4,022, this buy scenario is no longer valid.
Sell Scenario
Entry: Below 4,022 after confirmed breakdown and retest
Stop Loss: Above 4,070
Take Profit 1: 3,980
Take Profit 2: 3,940
Take Profit 3: 3,900
Sell Conditions
A sell setup becomes valid only if price loses the weekly low at 4,022 and fails to reclaim it. This would confirm that the recovery structure has failed and sellers are regaining control.
Overall View
Gold is showing a strong short-term recovery from the weekly low, but next week still needs confirmation. The 4,200 - 4,210 area is the first key buy zone. If buyers defend it, gold may continue towards 4,340 - 4,350, then 4,426 and 4,479.
The deeper buy zone remains 4,070 - 4,120. As long as price stays above 4,022, the recovery scenario is still valid. If 4,022 breaks, the bullish view becomes invalid and downside pressure may return.
Do you think gold will continue the recovery towards 4,479 next week, or will sellers push price back below the weekly low?
Long 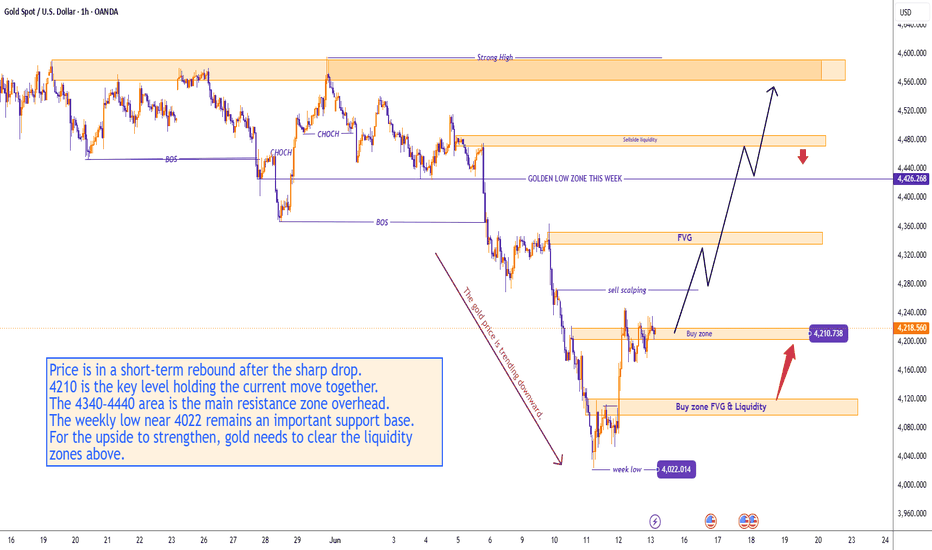
Brian XAUUSD – Gold testing deep support level.Gold closed the week under pressure after a sharp sell-off from the upper value structure. The weekly movement shows that sellers dominated most of the session, pushing XAUUSD down from the higher Volume Profile area towards the lower liquidity zone around 4,100 - 4,200.
Last week, gold failed to hold above the Sell zone VAL and continued to rotate lower. Price is now reacting near the deep liquidity support, but the long-term downtrend has not been fully confirmed yet. This means the market may still build a technical rebound before the next major direction is decided.
From a macro view, gold may face additional pressure if the possibility of reopening the Hormuz Strait reduces energy-driven inflation risk. Improved consumer sentiment can also weaken safe-haven demand for gold. Next week, the Fed decision and SEP will be important because they can strongly affect USD momentum and rate expectations.
Technical structure
On the daily chart, gold is trading below the main descending trendline and below the previous high-volume resistance zones.
The current reaction is happening near the lower liquidity area around 4,100 - 4,200. This is an important zone because price previously found strong demand here. If buyers defend this area, gold can build a corrective rebound towards the upper value zones.
However, the broader structure remains fragile. As long as price stays below the Sell zone VAL and Sell swing POC, any recovery should still be treated as a retest, not a confirmed bullish reversal.
Important zones
Current liquidity support: 4,100 - 4,200
Main reaction area after the sharp weekly decline.
VAL support: 4,000 - 4,030
Deep value support and major downside reference.
Sell zone VAL: 4,500 - 4,540
First major resistance if gold rebounds next week.
Sell swing POC: 4,680 - 4,710
Main Volume Profile resistance and stronger sell-reaction area.
Liquidity target: 4,363
Intermediate upside liquidity area if buyers defend support.
Trading scenario
Sell reaction from Sell zone VAL / POC area
Entry:
Look for sell positions only if price rebounds into the upper value area and shows clear rejection around the Sell zone VAL or Sell swing POC.
Stop Loss:
Above the rejection structure or above the Sell swing POC zone.
Take Profit:
TP1: 4,363 liquidity area
TP2: 4,100 - 4,200 support
TP3: 4,000 - 4,030 VAL support
This setup is based on the Volume Profile structure. The market may rebound from deep support first, but the stronger trading opportunity is to watch how price reacts when it returns to high-volume resistance.
Final view
Gold had a bearish week, but price is now sitting near an important deep value support. A short-term rebound is possible from 4,100 - 4,200, especially if buyers defend this liquidity area.
For next week, the key is not to chase price at the low. I will watch for a rebound into the upper value zones, then look for sell confirmation if price rejects the Sell zone VAL or Sell swing POC.
The main bias remains cautious to bearish while gold trades below the upper Volume Profile resistance.
Trade the retest. Respect the volume zone. Long 
BRIAN XAUUSD – GOLD BULLISH RECOVERYGold is showing a stronger recovery structure on the H1 chart after defending the lower Volume Profile area and breaking back above the previous compression range. Price is no longer moving in a clean sell-off. Buyers are starting to build acceptance above the lower liquidity base.
The current structure suggests that gold may continue higher if price holds above the main buy zone and respects the high-volume support areas below.
Technical structure
On the H1 chart, gold reacted strongly from the lower POC area and pushed back above the previous value zone.
The market is now pulling back towards the Buy zone liquidity around 4,154. This is the main area I am watching for a possible buy reaction. If buyers defend this zone, gold can continue the recovery towards the upper liquidity area around 4,363.
The rising trendline below also supports the idea that buyers are trying to build a short-term bullish structure. As long as price stays above the lower value zones, pullbacks can be treated as buy opportunities rather than bearish continuation.
Important zones
Buy zone liquidity: 4,154
Main buy area and short-term decision zone.
Buy scalping VAL: 4,105 - 4,115
Secondary support if price pulls back deeper.
High liquidity POC area: 4,075 - 4,085
Deeper buy-reaction zone and lower value support.
Liquidity target: 4,363
Main upside liquidity target if bullish momentum continues.
Trendline support:
Short-term bullish structure support.
Trading scenario
Buy reaction at 4,154
Entry:
Look for buy positions only if price pulls back into the 4,154 liquidity zone and shows clear bullish rejection.
Stop Loss:
Below the buy zone or below the local swing low.
Take Profit:
TP1: 4,200
TP2: 4,240
TP3: 4,363 liquidity zone
This setup is based on the main liquidity support above the Volume Profile base, where buyers may defend the next pullback.
Final view
Gold is shifting from a bearish sell-off into a short-term recovery structure on H1.
The main plan is to wait for price to retest the 4,154 liquidity zone and watch for buy confirmation. If this area holds, gold can continue the bullish correction towards 4,240 and potentially 4,363.
Trade the retest. Respect the volume zone. Long 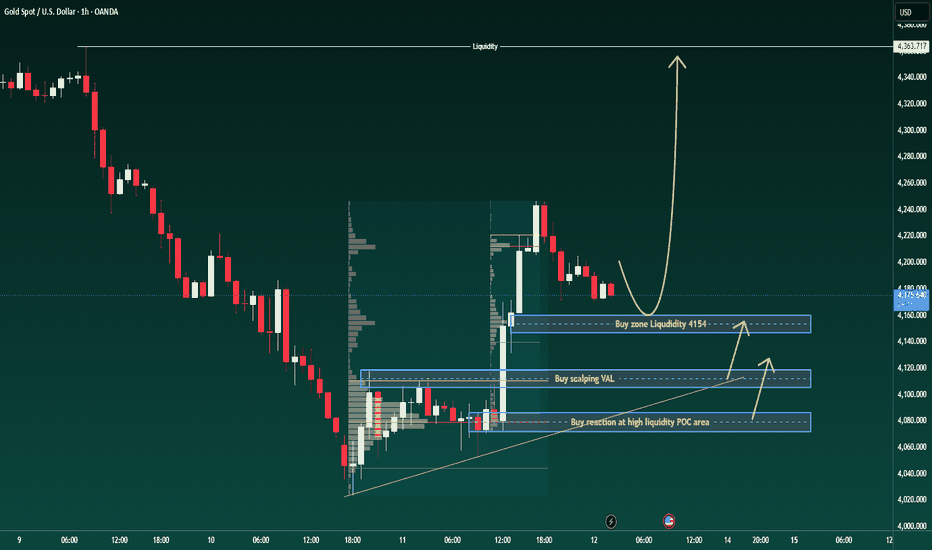
Just going back to old highs can give a massive returnAndhra Paper: Positive Momentum Building
Strong Session Performance:
Andhra Paper's stock witnessed a significant rise during today’s trading session, reflecting renewed investor interest.
Sector Outlook:
The overall sentiment within the paper industry appears positive, with improving fundamentals and technical indicators across key players.
Parent Company Strength:
A promising sign is that the parent company, West Coast Paper, is also displaying strength on the charts — lending confidence to Andhra Paper’s long-term prospects.
Negatives Already Priced In:
Most of the recent negatives — including the temporary plant closure, the illegal strike, and strained labour-management relations — now seem to be priced into the stock.
Fundamental and Technical Improvements:
With the introduction of new equipment and a more favourable business environment, supported by a stable political climate in the state, Andhra Paper is showing signs of fundamental improvement.
Technically as well, the prolonged downtrend — marked by several months of consecutive declines — appears to have ended, suggesting a potential reversal.  Long
Long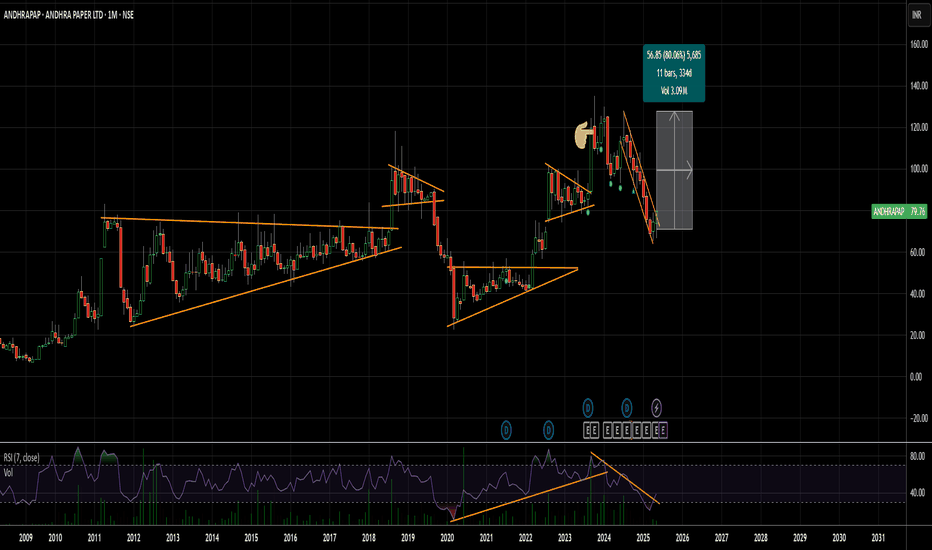
 Long
Long
 Long
Long
XAUUSD: Wave 2 at Key Decision ZoneGold is currently moving inside a wave 2 structure after the strong recovery from the lower liquidity area. From Kelly’s view, the market is now sitting in a sensitive accumulation zone, where the next confirmation will decide whether buyers continue the recovery or sellers regain control.
The key point is clear: bullish confirmation comes above 4,245, while bearish confirmation comes below 4,170.
⟡ Market structure
Price reacted strongly from the previous lower base and pushed into the upper area before starting to correct. The current pullback is now holding around the 4,170–4,180 accumulation zone, which makes this area important for the next directional move.
As long as gold holds above 4,170, the wave 2 correction can still remain valid. If buyers defend this zone and price later breaks above 4,245, the recovery structure may continue into the next bullish wave.
However, if price loses 4,170 with a clear confirmation candle, the wave 2 structure weakens and the market may rotate lower towards the buy liquidity area below.
➤ Key levels
◌ 4,170–4,180: accumulation and current decision zone
◌ 4,245: bullish confirmation level
◌ 4,204: key resistance before confirmation
◌ 4,135–4,145: buy-side liquidity reaction area
◌ 4,118: lower confirmation zone for uptrend recovery
◌ 4,053: deeper sell confirmation level if weakness expands
⌁ Elliott Wave view
From an Elliott Wave perspective, gold appears to be developing wave 2 after the initial recovery move.
Wave 1 created the first bullish impulse from the lower range. The current move can be read as wave 2 correction, where price is testing whether buyers can hold the structure before wave 3 develops.
If gold confirms above 4,245, the bullish wave count gains quality, and wave 3 may begin with stronger upside momentum.
If gold breaks below 4,170, the wave 2 structure loses strength, and the market may need to search for lower liquidity before rebuilding another recovery base.
▸ Trading scenario
Preferred scenario: wait for price to confirm above 4,245 before expecting bullish continuation.
Entry zone: after a confirmation candle above 4,245
Stop loss: below the confirmed higher low or below 4,170
Take profit 1: 4,280
Take profit 2: 4,298
Take profit 3: 4,350 if wave 3 expands strongly
Alternative scenario: if gold closes below 4,170 with clear momentum, the bullish wave 2 setup weakens. In that case, price may rotate lower towards 4,135–4,145 first, then 4,118 or 4,053 if selling pressure expands.
⌁ Kelly’s view
For Kelly, this is a confirmation-based wave 2 setup. The reaction around 4,170–4,180 is important, but the market still needs to prove strength above 4,245 before the bullish continuation becomes cleaner.
Gold is holding the decision zone now.
Above 4,245, the recovery can continue. Below 4,170, the structure turns fragile again.
Share your view below. Short 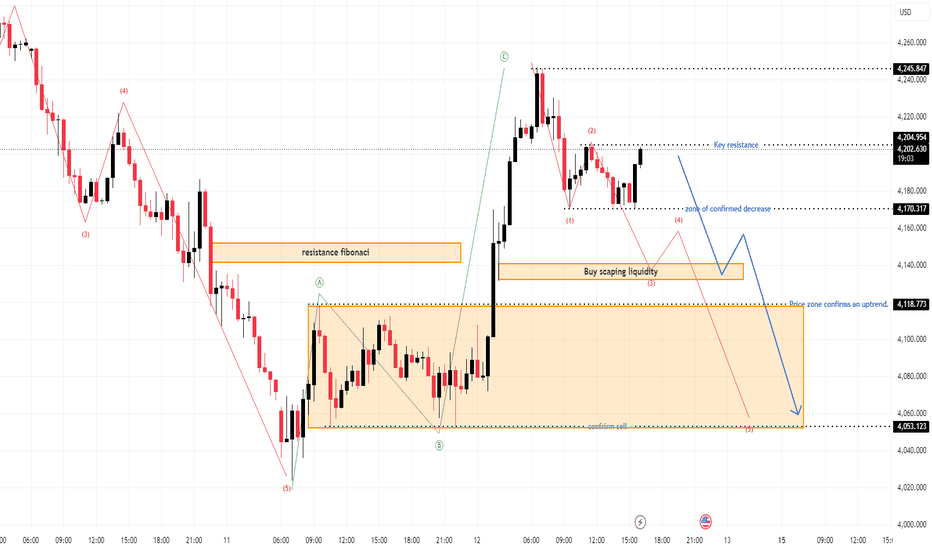
Long