MASON XAUUSD – Medium-Term Recovery Setup
Gold is trading around 4,017 after reacting near the lower part of the descending channel. The main medium-term idea for next week is a bullish correction, but confirmation is still needed because price remains inside the larger bearish channel.
Technical View
On the H4 chart, gold is still moving inside a wide descending channel, but price is now reacting from the lower channel area and liquidity zone. This suggests sellers may start losing momentum in the short term.
The recent structure
Fundamental Analysis
Apple New all-time high over? Now looking for a Short!The recent move has been aggressive, with price breaking above the previous high and continuing to expand higher. Fundamentally, the rally has been supported by renewed optimism around Apple's AI strategy, its ability to monetize its massive device ecosystem, and the broader shift in sentiment toward Apple's relatively capital-light approach to AI.
But from a daily timeframe perspective, I am not interested in blindly shorting Apple simply because price has gone up a lot.
The trend is bullish.
RShort
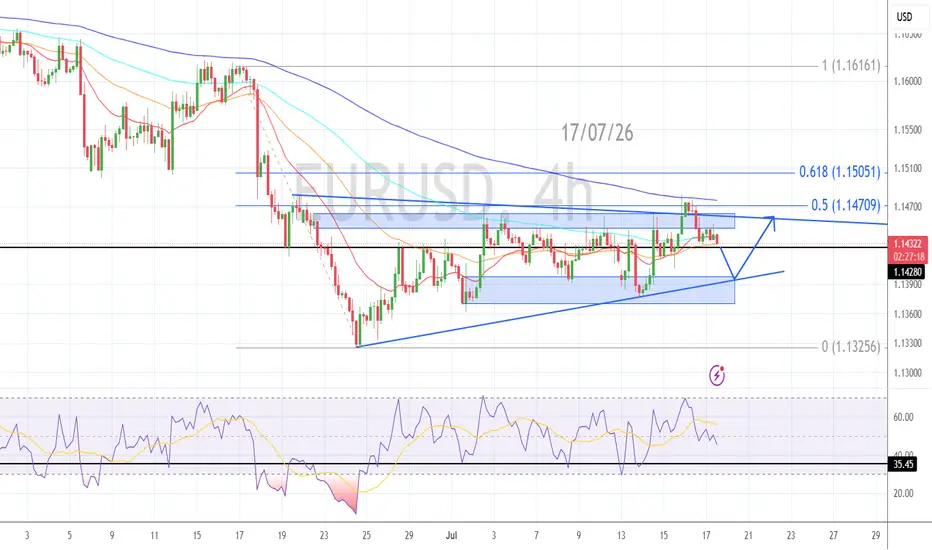
EURUSD AANALYSISEURUSD Analysis (H4 Chart)
The pair are trending in an ascending wedge, although the rising trajectory looks much more choppier than trending
The prices are correcting after the upper zone of the wedge, while testing the fib level 0.5 and the 200 EMA.
Currently the cluster of EMAs - 20/50/100 are creating a strong support for the EUR bears
But a breakout of the EMAs below 1.1428 will drive prices further lower towards lower end of the wedge near 1.1400 - 1.1390 zone
Soft inflation reading
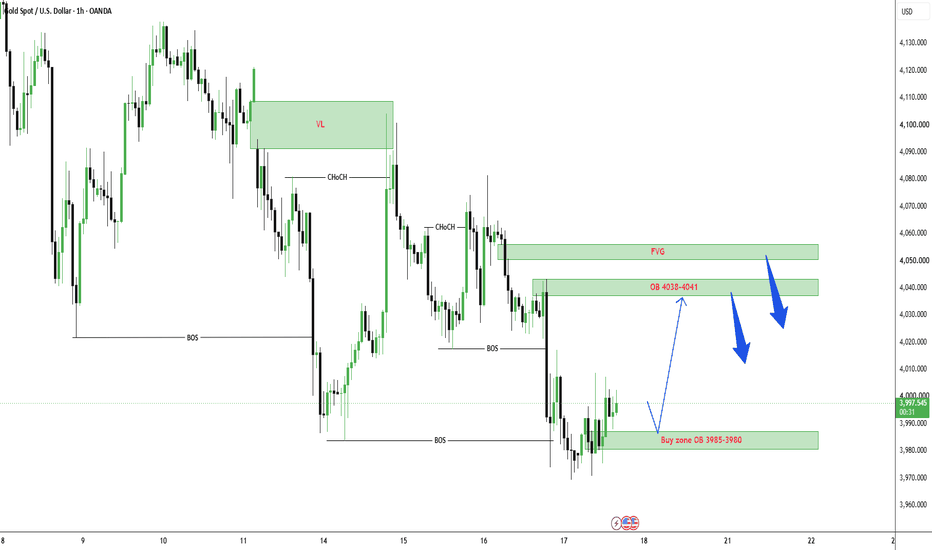
XAUUSD — Key Entry Zones Around OB and FVG
Gold is trading around $3,998 after recovering slightly from the lower Buy zone OB around $3,980–$3,985. The short-term reaction shows that buyers are trying to defend this demand area, but the overall structure is still not fully bullish because price remains below the upper OB and FVG supply zones.
From an SMC perspective, gold recently created bearish BOS and continued to trade below the previous structure. The current bounce from the lower OB looks more like a reaction from liquidity rath
HOW ARE INDIA'S MOST EXCITING STOCKS BEING VALUED? FOLLOW CASH.Applying a practical valuation framework to order books, GMV, users, capacity and future optionality in the Indian market
Indian investors rarely run out of exciting numbers.
An engineering company announces a record order book. A fintech highlights GMV and active users. A quick-commerce platform reports rising order value. A renewable-energy company adds gigawatts. A conglomerate presents opportunities in AI, cloud and new energy.
All these numbers may be real. But none of them, on its own,
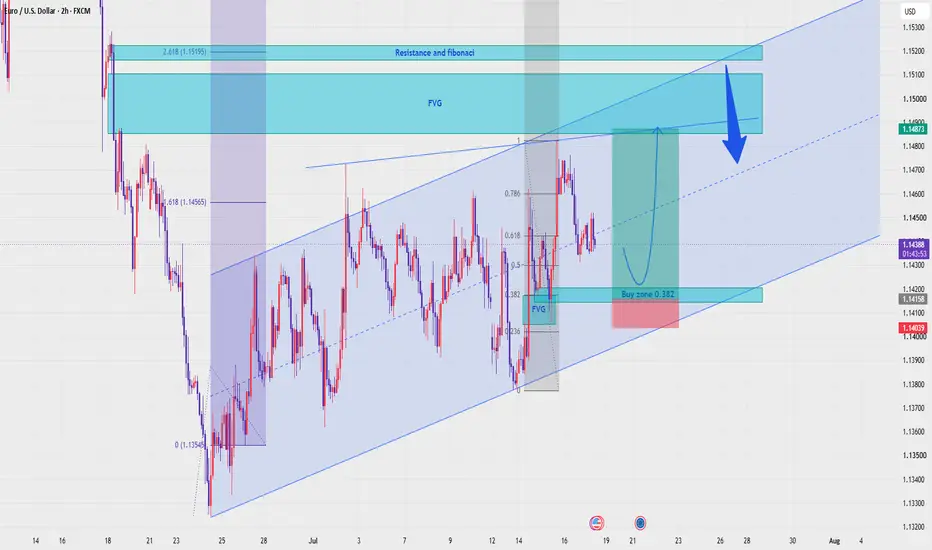
EURUSD — Bullish Channel Retest Setup
Fundamental Analysis
EURUSD is still reacting to USD momentum and upcoming macro data. For now, the short-term structure remains positive while price continues to respect the rising channel.
Technical Analysis
On the 2H chart, EURUSD is trading around 1.1437 and holding inside a clear bullish channel. The key buy zone is around 1.1415 - 1.1420, where the 0.382 Fibonacci area, FVG support, and lower channel reaction align. If price holds this value zone, buyers may push EURUSD back toward 1.14
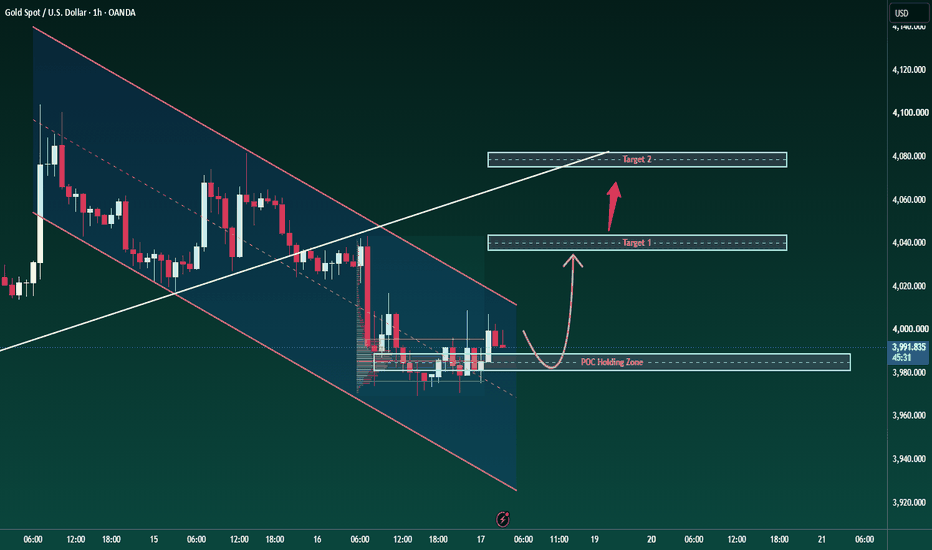
XAUUSD — Strong Support Tested, Recovery Setup
Fundamental Analysis
Gold remains sensitive to USD momentum, Treasury yields, and upcoming U.S. macro data. For now, short-term price action shows a possible technical recovery as buyers continue to defend the same support zone.
Technical Analysis
On the 1H chart, XAUUSD is trading around 3,995 after testing the strong support area near 3,960 - 3,970 multiple times. This repeated reaction shows that sellers are losing some pressure at the low. The first buy zone is around 3,983 - 3,987. If pr
GOLD reacting from low, but still bearish.BRIAN XAUUSD – GOLD REACTING FROM LOW VALUE, BUT HIGHER SUPPLY STILL DOMINATES
Gold is currently bouncing from a lower value area after tapping into the monthly low zone. This move is not a breakout — it is a classic Volume Profile reaction from discounted price, where buyers step in to absorb liquidity.
However, the overall structure still shows imbalance to the downside. The market is not yet accepting higher value, and sellers are still positioned above.
From a macro perspective, USD stren
GOLD: Range Break or Trend Continuation?📌 Market Overview
• Gold remains under pressure after the recent sell-off, with price still trading below the H1 descending trendline.
• Despite several rebound attempts, bullish momentum remains weak and the market is still trapped inside the current consolidation range.
• Today's focus shifts to U.S. Retail Sales, Initial Jobless Claims, and any new headlines surrounding Trump and Iran, as these could trigger the next wave of volatility.
📌 Trading Plan
Resistance: 4000–4010 | 4055–4070
S
BHEL Surges to Record Highs on Earnings RevivalHighlights
* BHEL has witnessed a strong breakout following its Q1FY27 earnings announcement, with the stock hitting a fresh 52-week high as investors cheered its return to profitability and robust revenue growth. The stock continues to outperform the broader PSU and capital goods space.
* The **₹440–₹445** zone remains the immediate resistance area. A decisive close above this range could confirm the continuation of the ongoing rally and open the door for an advance towards **₹470–₹490** i
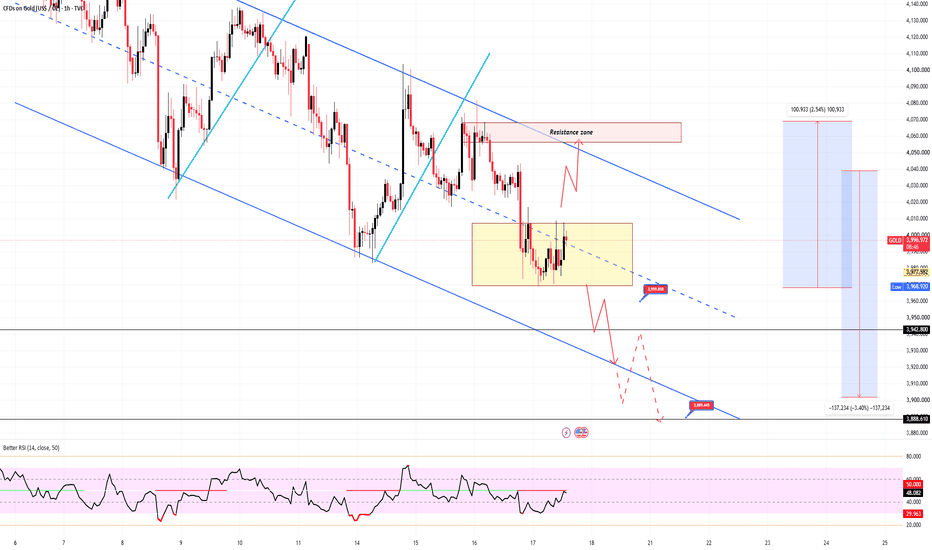
XAUUSD – Gold Stays Heavy, 4,000 Is The Level To Watch XAUUSD – Gold Stays Heavy, 4,000 Is The Level To Watch
Gold is still moving under pressure inside a wide descending channel.
Price is currently trading around 4,026 after failing to build a strong recovery from the lower area. The chart shows that every bounce is still limited below the FVG and channel resistance, which means sellers remain in control for now.
The key level is very clear: 4,000.
If gold breaks and accepts below this psychological level, bearish momentum may accelerate toward
Why Markets Move Every day, millions of traders watch price charts, searching for the next big move.
Some rely on indicators.
Others study chart patterns or economic news.
Yet beneath every candle, every breakout, and every trend lies one simple process that drives every financial market:
An auction between buyers and sellers.
The market doesn't move because an indicator turns green or a news headline appears. It moves because buyers and sellers constantly negotiate what an asset is worth.
Understanding
AEducation
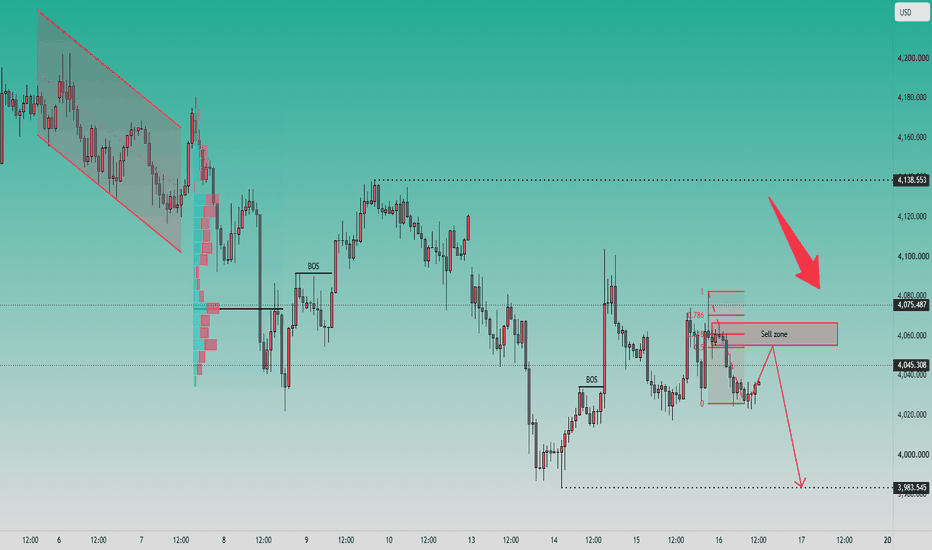
XAUUSD — 4,060 Is the Sell Zone XAUUSD — 4,060 Is the Sell Zone
Gold is trying to bounce, but this bounce does not feel clean enough to trust yet.
Price reacted from the lower area near 4,030, then started climbing back toward the 4,045 - 4,060 zone. At first glance, that can look like buyers are coming back. But when you slow the chart down, the move looks more like price walking back into a sell zone rather than starting a strong bullish reversal.
The key detail is the retracement. Gold is now moving back into the 0.618 -
Can Silver touch 49?US-Iran war still ON. Inflation numbers does come down but will be inflated again as oil touch 85. Rate-cut possibility is diminishing day by day. Though we could see a rate hike. but what about silver? Fundamentals says downward pressure is there but there will be some volatility due to good recent cpi data's (but we all know they are lagging indicators). so charts does say 49 to me, downward pressure is there too. lets see what happen? Remember its a 4hr chart🥲, so have patience..
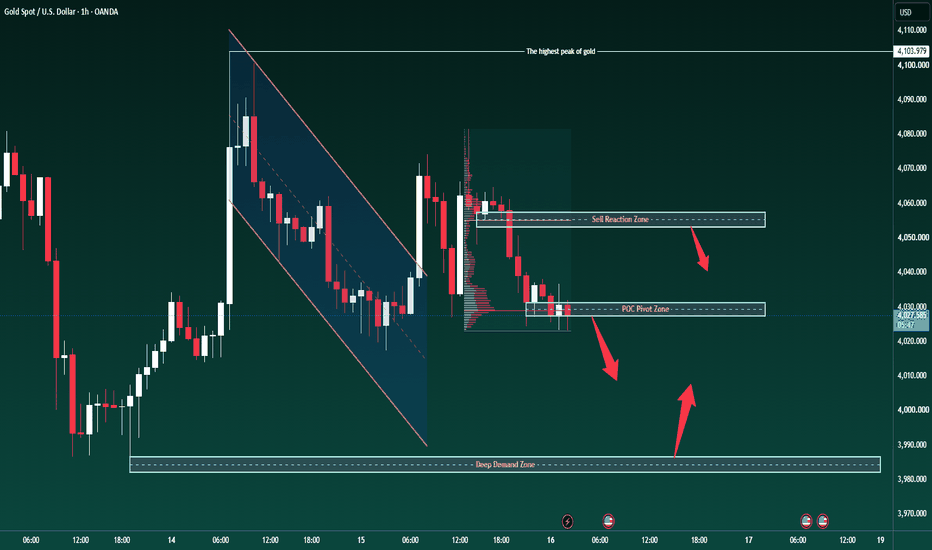
GOLD SELLING PRESSURE NEARBRIAN XAUUSD – GOLD UNDER SELL PRESSURE NEAR POC PIVOT
Gold is facing fresh supply on Thursday as energy-driven inflation concerns keep the market focused on the risk of a more hawkish Fed. At the same time, rising US-Iran tension is supporting safe-haven demand for the US dollar, adding pressure to XAUUSD during the session.
The macro backdrop is not friendly for gold right now. A stronger dollar, inflation risk from energy prices, and weak technical structure are keeping sellers active.
Tec
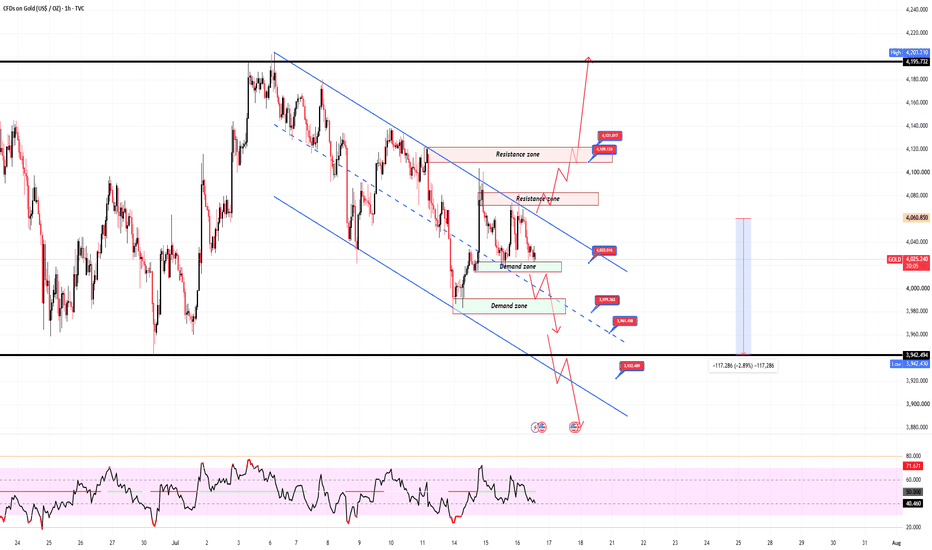
Inflation Cools, But Gold Still Can't Break Out of the DowntrendKey Highlights
Both the U.S. CPI and PPI came in below expectations, signaling easing inflation pressures and reinforcing expectations that the Fed may adopt a more dovish stance.
Despite the softer inflation data, gold remains confined within its H1 descending channel, with no confirmed trend reversal yet.
The next major catalysts are Retail Sales, Jobless Claims, remarks from President Trump, and the U.S. Consumer Sentiment report.
📌 Trading Plan
Resistance: 4070–4085 | 4105–4120 | 4195
Su
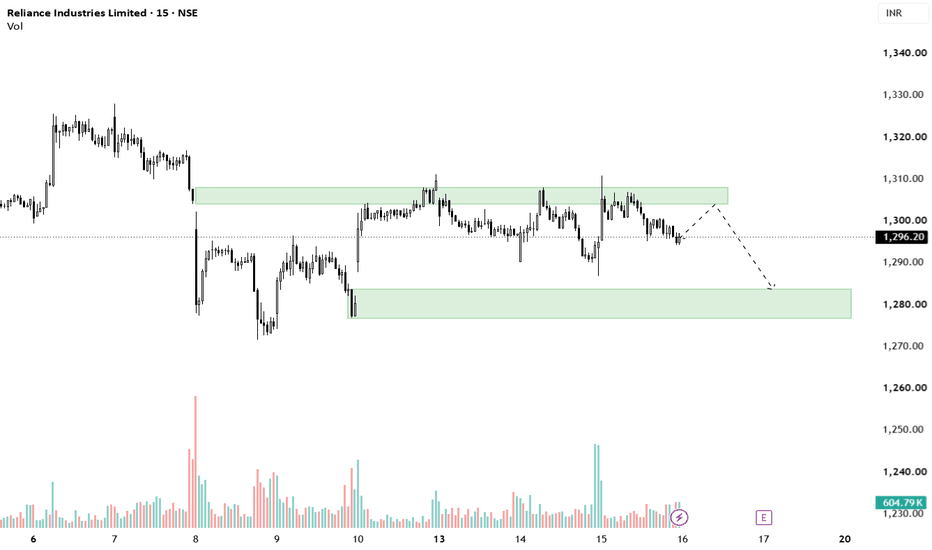
Reliance Industries Ltd - Intraday Bearish View (15-M)As highlighted in the chart, price is approaching the upper resistance zone after consolidating in a range. A descending trendline is clearly visible, suggesting potential rejection and downward move.
Key Levels:
Resistance Levels:
Immediate Resistance: ₹1,300 – ₹1,305
Major Resistance: ₹1,310 – ₹1,315 (Strong supply zone + upper green area)
Support Levels:
Immediate Support: ₹1,285 – ₹1,280
Lower Support: ₹1,270 – ₹1,265
Bearish Setup:
Price is likely to touch the resistance zone (₹1,300–₹1,315
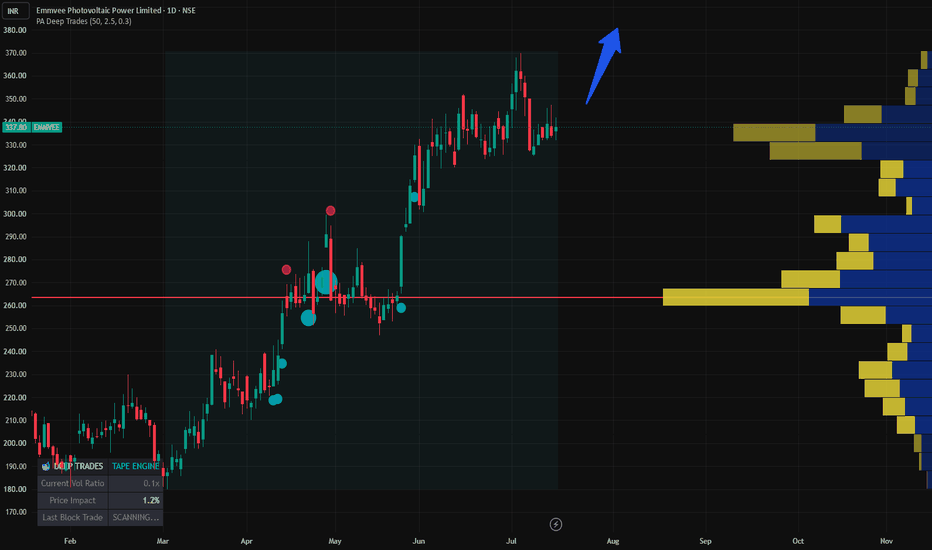
Emmvee Photovoltaic Power Ltd 20% upside chanceBusiness Profile
Emmvee Photovoltaic Power is one of India's leading integrated solar manufacturers, engaged in producing solar PV modules, solar cells, and EPC solutions. The company is expanding manufacturing capacity under the government's renewable energy initiatives and is well positioned to benefit from rising domestic solar demand and import substitution.
Earnings & Fundamentals
The company has reported strong earnings acceleration, driven by higher capacity utilization and operating l
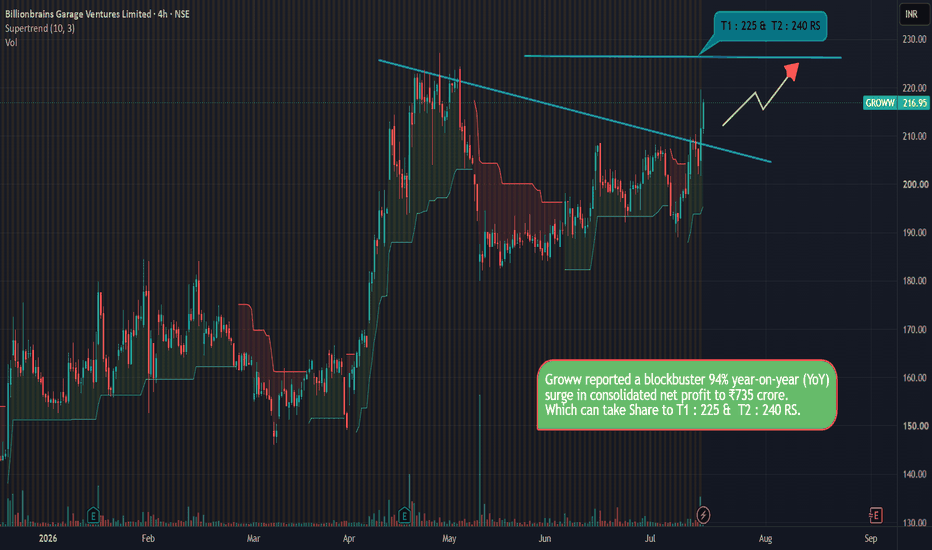
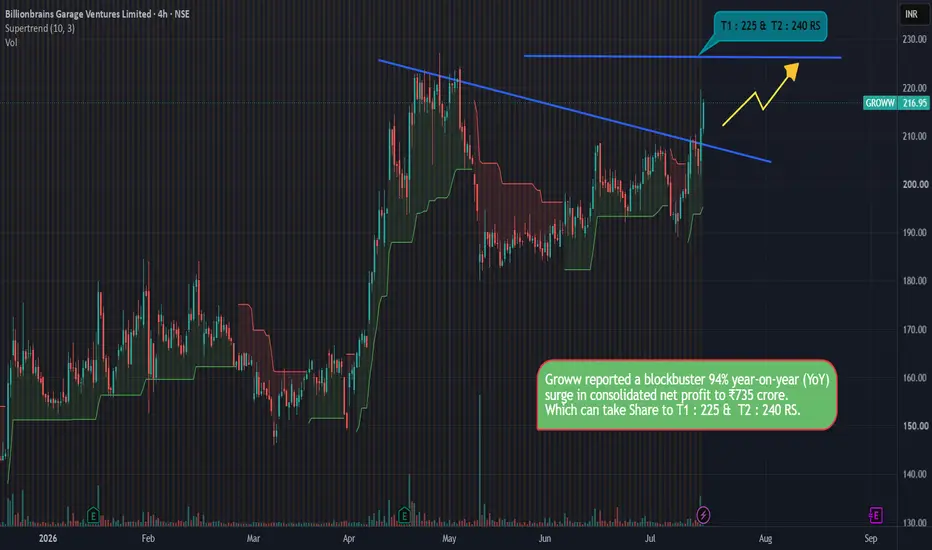
GROWWDriven by an exceptional 95% year-on-year surge in consolidated net profit, Groww has reported strong quarterly results that make the stock look highly attractive at this point. This robust earnings momentum can potentially drive the stock toward Target 1 of ₹225 and Target 2 of ₹240 in the upcoming months as a mid-term view.
Kindly note that I am not a SEBI-registered analyst, so please consult your financial advisor before making any investment decisions.
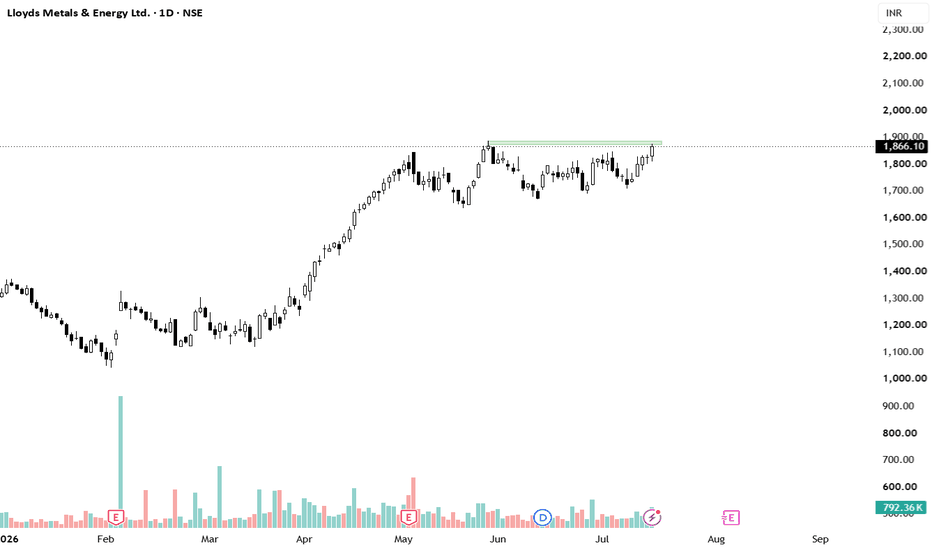
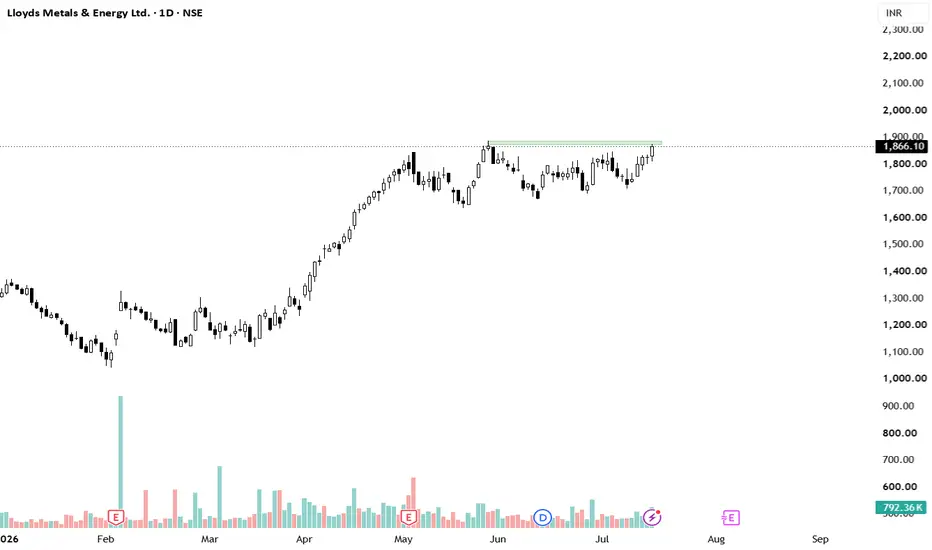
Lloyds Metals Rally Continuation? Breakout Above ₹1,900 Ahead?Lloyds Metals & Energy Ltd. has delivered an impressive uptrend since early 2026, rising from the ₹1,100–1,300 range to the current levels near ₹1,866. The stock is now consolidating just below the psychological ₹1,900 resistance.
Key Levels to Watch:
Resistance: ₹1,900 (immediate and critical).
Support: ₹1,800–1,850 zone.
A decisive close above ₹1,900 with healthy volume would strengthen the bullish case for continuation toward ₹2,000+.
Outlook:
The broader trend remains positive. If the curren
BHEL Breakout? Will the Rally Continue After Consolidation ?Bharat Heavy Electricals Ltd. (NSE: BHEL) has been consolidating between ₹375 and ₹440 following a powerful rally from the ₹280 zone. The stock is currently trading at ₹417.95, testing the upper edge of this range with decent volume support.
Key Levels:
Resistance: ₹417–440 (immediate), with a major breakout target above ₹440.
Support: ₹375–380 zone.
A clear close above ₹440 on increased volume would confirm continuation of the uptrend.
Outlook:
The overall structure remains bullish. If the pr
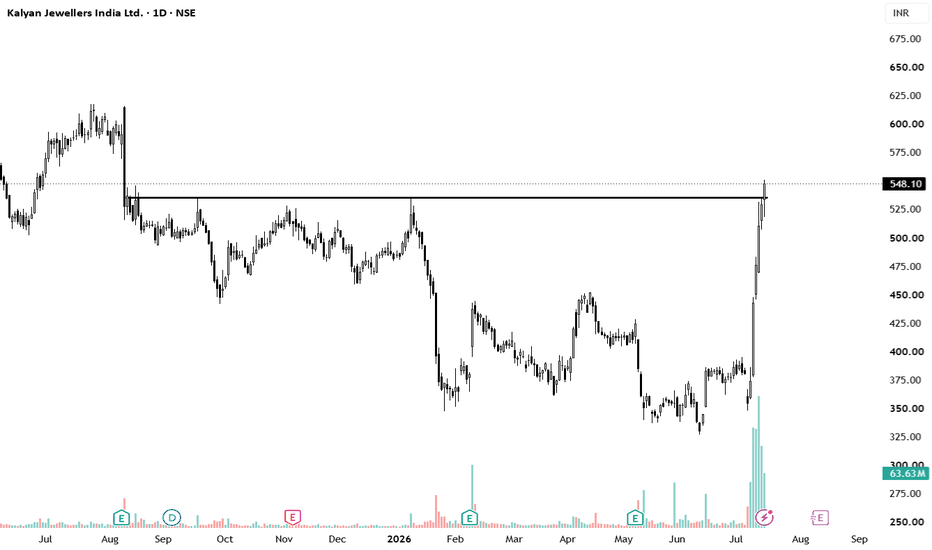
Will Kalyan Jewellers Recent Rally Sustain? Technical OutlookKalyan Jewellers India Ltd has shown a strong recovery in recent sessions, rebounding from the ₹350–400 zone established earlier in 2026. The price is currently trading at ₹548.10, testing a significant horizontal level that previously acted as both support and resistance.
Key Technical Observations:
The stock has broken above short-term moving averages with notable volume expansion during the latest upmove.
A critical resistance lies at ₹587.25. A decisive close above this level could confirm c