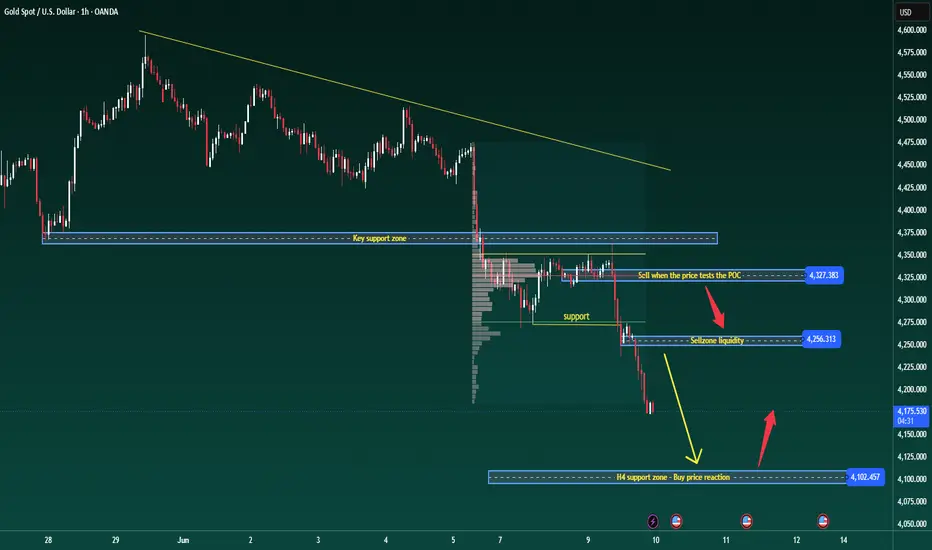
BRIAN XAUUSD – GOLD CONTINUES SHARP H1 SELLINGGold is trading under strong bearish pressure after a heavy one-day decline. The H1 chart shows a clear breakdown structure, with price losing multiple support zones and continuing to accept lower levels.
From a macro view, gold remains pressured by firm USD demand and cautious market sentiment. However, the chart is giving the clearest message now: sellers are still controlling the short-term structure, and rebounds remain vulnerable unless price can reclaim broken value.
Technical structure
Fundamental Analysis
CPI Day — Gold Has Already Started Moving Before the DataMacro Highlights
The U.S. carried out additional strikes against Iran yesterday, keeping geopolitical tensions elevated.
Gold came under pressure and declined ahead of today's CPI release.
Today's U.S. CPI report is the key event that could shape Fed policy expectations and determine gold's next move.
Trading Plan
Main bias: Sell the rallies.
Key resistance levels:
4220, 4250, 4280, 4360
Key support levels:
4140, 4100–4090, 4050–4000
Personal View
Sellers remain in control unless gold can
Orient bell Orient bell
I'm bullish on the construction materials sector over the next 1–2 years.
company's revenue & profit have improved a lot over the last qtr
It has also increased tile prices by up to 20%.if demand remains good company can benefit from operating leverage.
Technically stock is showing strength after almost 3 years of consolidation .
Now it's offering a good risk-reward opportunity for a long position.
BRIAN XAUUSD – GOLD CONSOLIDATING BEFORE CORRECTIONGold is currently compressing after the sharp bearish move from the upper value structure. Price is holding around the Buy zone FVG & POCPO near 4,320 - 4,335, showing that sellers are slowing down in the short term.
From a macro view, gold is still under pressure from USD strength and cautious market positioning. However, after a strong decline, the chart now suggests a potential corrective rebound if buyers can defend the lower value area.
Technical structure
On the H1 chart, gold is moving
Apollo PipesApollo Pipes
I'm bullish on the construction materials space for the next 2-3 years. Apollo Pipes looks interesting. In the recent earnings call, management guided for 5,000 cr revenue by FY31 compared to around 1,000 cr in FY26. They have also targeted EBITDA margins of 10–12%, while current margins are around 6%.
The stock hasn't delivered no returns over the last 5 years but technically it is showing relative strength after a long consolidation phase.Apollo Pipes could be a decent bet for
Gold Continues to Trade Sideways — All Eyes on CPI on June 10Macro Highlights
The market is now focused on the upcoming CPI report on June 10.
CPI is expected to be the next major catalyst that could determine gold's short-term direction.
Trading Plan
Gold remains in a narrow sideways range with no clear breakout signal yet.
Key resistance levels to watch:
4350, 4372, 4400–4405
Key support levels to watch:
4315, 4280, 4270, 4250, 4225, 4200
If price loses the 4270 level, gold could extend its decline toward:
4250, 4225, and 4200
Personal View
My
XAUUSD: Intraday bullish channel supports recovery.Gold is building a short-term recovery structure after the recent sharp decline, and price is now moving inside a rising intraday channel. From Kelly’s view, the main scenario for today still leans bullish as long as gold can hold above the lower channel support and stay above the key violation area near 4,313.
The important detail is that this recovery is not fully confirmed as a broader reversal yet. It is an intraday bullish channel inside a market that still carries medium-term bearish risk
15MIN Trading
📈 Bullish Scenario
Hold above 4325
Break 4350
Target 4372
Extended target 4410–4420
📉 Bearish Scenario
Lose 4325
Revisit 4301
Break 4301
Target 4283
Simple Trader Summary
Gold is showing short-term bullish strength after defending the 4301 demand zone. Buyers are targeting 4350 first and then 4372. As long as price stays above 4325, bulls remain in control. Watch the 4372 resistance closely for either breakout continuation or rejection.
Brian XAUUSD – Gold breaches support level.BRIAN XAUUSD – GOLD BREAKS VALUE SUPPORT
Gold is trading under clear bearish pressure after breaking below the Sell VAL support zone around 4,430 - 4,440. The H1 structure shows that buyers failed to defend value, and price is now rotating lower into a new downside leg.
From a macro view, gold remains sensitive to USD strength, Fed expectations, and defensive positioning. But on this chart, the technical message is stronger: XAUUSD has lost the main intraday value support, and rallies are now
XAUUSD: Consolidation Before the Next Liquidity Move
Fundamental Analysis
Gold is starting the day in a consolidation phase after the previous strong bearish movement. The market is still waiting for clearer direction as traders react to USD strength, risk sentiment, and upcoming economic data. At this stage, price is not showing a clean continuation yet. Instead, gold is moving inside a short-term range where both buy-side and sell-side liquidity are building.
Technical Analysis
From an SMC perspective, gold is consolidating below the previo
ZYDUSWELL : Near ATH BreakoutZydus Wellness is breaking it ATH level in this half bear market. Consolidation near breakout is also good..
All data is available in public domain..
CMP : 525
TG : 650
SL : 475
Stock's selection based on 5 Point Analysis:
1: Idea : Breakout.
2: Support : Volume, Delivery .
3: Technical : 21/55/200-EMA, Super trend up, RS>0 RSI.
4: Fundamental : PE, PAT, Industry & peer PE and sector performance.
5: Timing : Entry Timing on Daily chart.
Disclaimer : It is my personal view as a trad
Gold Remains Bearish After Non-Farm — Is 4200 the Next Target? Macro Highlights
Non-Farm Payrolls came in stronger than expected, confirming that the U.S. labor market remains relatively resilient.
Expectations for an early Fed rate cut continue to fade, supporting the U.S. Dollar and weighing on gold.
This week's focus shifts to CPI, PPI, and interest rate decisions from the ECB and the Bank of Canada.
Trading Plan
Gold remains within a short-term bearish channel, with no clear signs of a trend reversal yet.
Key resistance levels:
4325, 4372, 4400, 4480
Bandhan Bank Bandhan Bank
fundamentals are improving &the stock is currently trading at 1.3 times of book value. re-rating could happen over the coming quarters.
From a technical perspective it is showing relative strength after 6-7 years of underperformance. Looking ahead,probability of the stock revisiting or even surpassing its alltime high over the next 2–3 years appears promising.
XAUUSD GOLD NEXT MOVE ON (08 JUN 2026)#XAUUSD UPDATE...!!!
Current price = 4325
BUY LIMITED - 4280-4270
If price stay above 4225 then next target 4350,4425 and 4500 and below that 4100
Plan1;If price break 4280-4270 area,and stay above 4280 we will placed buy order in gold with target of 4350,4425 and 4500 & stop loss should be placed at 4225
Stock analysis - Himadri Speciality Chemical Ltd Himadri Speciality Chemical is primarily engaged in the manufacturing of carbon materials and chemicals. It is the No.1 coal pitch manufacturer in India and is the only company to manufacture advanced carbon material in India. It is also the largest player of Naphthalene and SNF in India.
Product Portfolio
The company is a key player across various product segments, including battery materials, coal tar pitch, carbon black, naphthalene, refined naphthalene, SNF, and specialty oils. It serves
RVNL — Strong Business, Weak Stock | Bearish Until Proven Otherw📊 TECHNICAL OVERVIEW-
Trend: Strong downtrend — lower highs, lower lows intact
Key level broken: 0.618 Fibonacci retracement at ₹271.50 is lost
Next major support: ₹170–₹180 zone (0.786 Fib retracement)
📉 FUNDAMENTAL SNAPSHOT (FY2024–25)
Net Sales Growth: –8.57% YoY
PAT Growth: –18.75% YoY
P/E Ratio: 56.17 vs Industry Average: 22.69 → Expensive relative to peers
PEG Ratio: –4.23 (negative) → Earnings declining, valuation not justified
ROE: 19.42% → 14.01% (deteriorating)
Working Capital Cycle:
XAU/USD Bearish Breakdown – Liquidity Target in Focus Gold (XAU/USD) continues to trade under strong bearish pressure after rejecting a key resistance zone. Price remains below the descending trendline, confirming seller dominance. The current structure suggests a move toward the major liquidity area around 4100, which could serve as the next downside target.
🔹 Bearish market structure intact
🔹 Resistance zone successfully defended
🔹 Descending trendline remains valid
🔹 Liquidity resting near 4100 level
🔹 Sellers remain in control until a clear bu
XAUUSD: Weekly Bearish Trend Continues DownwardGold is still trading inside a broad descending channel, and the weekly structure continues to favor the downside. From Kelly’s view, the latest price action does not yet show a strong reversal signal. Instead, the chart suggests that sellers are still controlling the larger trend, with the market now moving towards lower target zones.
The main idea for next week is simple: gold remains under pressure while price stays below the descending structure.
⟡ Market structure
The broader chart shows
Rishabh Instruments — Operating Leverage | Target ₹850–950# Rishabh Instruments — Operating Leverage Inflection | Target ₹850–950
**NSE: RISHABH | CMP ₹512 | MCap ₹1,979 Cr | Timeframe: 12–18 months**
---
## Business Model
Rishabh Instruments is a Nashik-based precision instrumentation company operating across three segments:
- **EEI (Electrical & Electronics Instrumentation)** — Panel meters, current transformers (CTs), power quality analyzers. Claims to be the largest CT manufacturer in the world. High-margin, IP-driven business with 60–70% gros
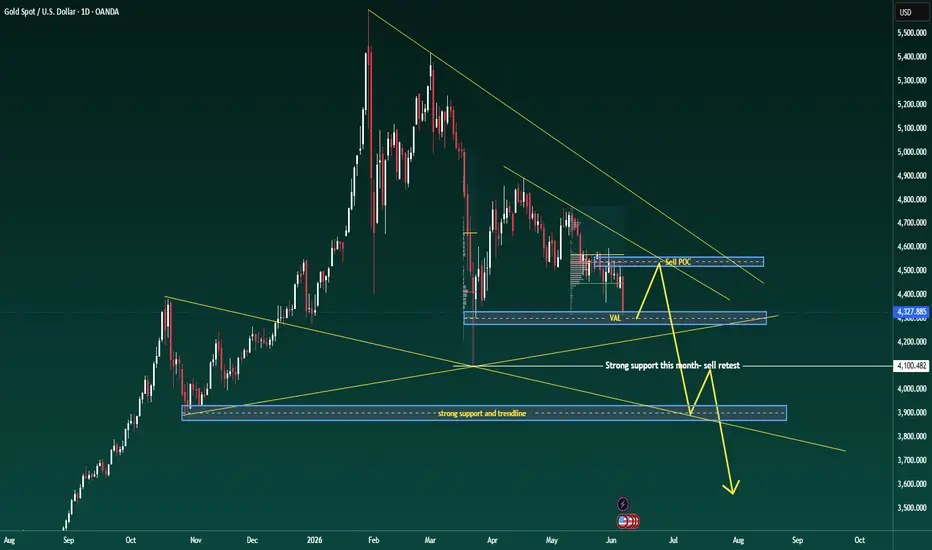
BRIAN XAUUSD – DAILY CHART ANALYSISGOLD SITTING ON VALUE SUPPORT
Gold is trading under short-term pressure after failing to recover above the upper value zone. The daily chart shows price rotating lower inside a corrective structure, with XAUUSD now sitting near the Value Area Low around 4,300 - 4,330.
From a macro view, gold remains sensitive to USD strength, Fed rate expectations, and defensive market positioning. However, the chart is giving the cleaner signal now: price is trapped between VAL support below and the Sell POC
NASDAQ Sitting on a Decision Point — What's Next?NASDAQ 100 has reached a critical support zone after a sharp sell-off. The reaction around this level could determine the next major move.
📌 Three possible scenarios:
1️⃣ H&S Pattern Formation – Price stabilizes and forms the right shoulder before a larger directional move.
2️⃣ Bear Trap & Reversal – Sellers get trapped below support, leading to a sharp recovery and trend continuation.
3️⃣ Breakdown → Retest → Further Fall – Support fails, price retests the breakdown zone, and downside momentum
DXY — US Dollar Index Monthly Analysis, Danger Bells??Guys today something significant happened in global markets and I want you to understand exactly what it means and why it matters for you.
NDX fell 4%. US bond yields spiked. Dollar strengthened. All on the same day.
Most people see these as three separate events. They are not. They are one single story playing out simultaneously. Let me break it down.
🚨First. The Dollar Chart — 18 Years of Truth.
Look at the DXY monthly chart. The US Dollar Index has been inside a clean ascending channel sin
Non-Farm Is Approaching — Gold Awaits a Market-Moving CatalystMacro Highlights
The market is now fully focused on this week's Non-Farm Payrolls (NFP) report.
Expectations that the Fed will keep interest rates higher for longer continue to weigh on gold.
Ahead of major economic data releases, markets often become choppy and prone to liquidity sweeps.
Trading Plan
Gold remains in a sideways range between:
4430 – 4480
Key resistance levels to watch:
4480 | 4515 | 4540 | 4580
Key support levels:
4430 | 4400–4405 | 4380 | 4365
Personal View
My preferred