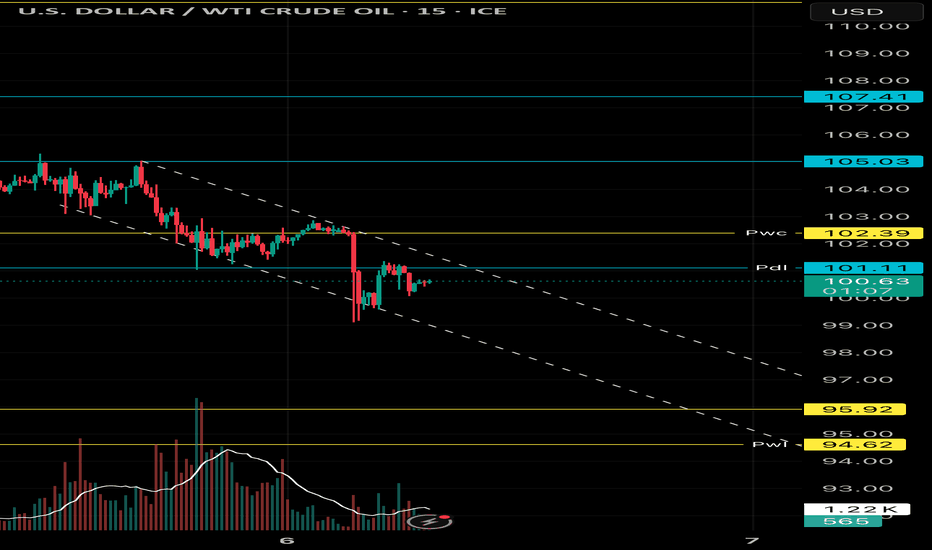
USOIL Analysis on (23 MAR 2026)#USOIL UPDATEDE
Current price - 97.900 (Sell limited 99.000 to 100.000)
If price stay below 101.500, then next target 96.300,93.000 and 90.500 above that 103.600
Plan;If price break 99.000 to 100.000 area,and stay below 99.000 ,we will place sell order in USOIL with target of 96.300,93.000 and 90.500 & stop loss should be placed at 101.500
Fundamental Analysis
Gold fell; best trade today is inaction.Today the market is moving violently. Gold has dropped sharply as US-Iran tensions escalated after Trump’s 48-hour ultimatum related to the Strait of Hormuz.
So right now, the market is not only watching key support levels. What matters even more is Iran’s next response. That reaction could be the key factor that determines gold’s next direction in the short term.
My personal bias is still to look for selling setups. But the real question is not just selling or buying. The real question is: where do you sell without getting stopped out in this kind of chaotic market?
When price is driven by headlines, many technical levels become far less reliable. M1 and M15 candles can easily sweep both sides in minutes. And on days like this, trading more is not always a sign of skill — sometimes it is just forcing yourself into a bad environment.
When the market gives you a difficult problem, you do not have to solve it. You only need to wait for the setup that fits your system.
For today, my priority is to stay patient and observe the key support zones: 4000 – 3950 – 3850
If there is a setup, wait for confirmation. If you have already hit your daily loss limit, stop. If the entry is not clear enough, stay out.
In trading, survival does not come from being in the market every day. Survival comes from protecting your capital, protecting your mindset, and staying alive through the most unstable sessions.
Sometimes doing nothing is already a very successful trade.
XShort
TATAPOWER - long term consolidation near to endNSE:TATAPOWER
Price above all EMA - strength in this falling market
All near by resistance has been tested
Good Lynch Score
Energy sector also in demand
Warning:
Trading without knowledge depth, experience and proper risk management may be harmful. I am not a registered analyst, here I am only sharing my view to trading communities, this is not any recommendation.
Do consult your financial advisor prior any trade.
India VIX Hits Historic Highs: Why It’s Time to Buy the FearAn old on Wall Street famously states: "When there is blood on the street, you should be greedy enough to accumulate". For seasoned investors, these moments are the absolute best times to build generational wealth. As of 23rd March, VIX hits record intraday highs of 26.31 and to understand it, we need to look at the ultimate "fear gauge"—the India VIX.
What is VIX?
The India Volatility Index (VIX) measures the market's expectation of volatility over the next 30 days. It is calculated using the implied volatility of Nifty index options.
Low VIX (Under 15): The market is complacent, stable, and generally trending upward. There is little fear.
High VIX (Above 20-25+): Fear has entered the room. Traders are aggressively hedging their portfolios, expecting sharp, violent downswings.
Historically, the stock market and the VIX have an inverse relationship. When the Nifty crashes, the VIX spikes.
A Look at Historical Panic
If you look at the historical monthly chart of the India VIX, a clear pattern emerges. Every major macroeconomic shock creates a violent spike in the index. Notice the cyclical spikes into the 30–40 range during past periods of panic. You can also see a yellow accumulation zone at the bottom (around the 10-12 level). That is the complacency zone. When the VIX drops into this zone, markets are calm—but the best buying opportunities have usually already passed.
The Current Scenario: Nearing Historical Fear Levels
We are currently printing a massive green monthly candle, with the VIX surging past the 26 level—an increase of over 90% from recent lows.
We are rapidly approaching historical fear levels, eyeing that crucial 31–38 resistance zone that has marked the climax of past bear markets and panic events.
Extreme fear is cyclical, not permanent
Fear is temporary, but the equity accumulated during maximum pessimism pays dividends for a lifetime. When the VIX spikes up to 31-39 zone at this point most of the retail traders are getting shaken out, panic selling into "Smart Money that accumulates".
What Should You Do?
If the VIX continues its upward trajectory into these historical resistance bands, be prepared to deploy capital.
1. Prepare your watchlist: Identify the fundamentally strong, high-conviction stocks you've always wanted to own but found too expensive.
2. Keep cash reserves ready
3. Buy the panic: Stagger your entries. You don't have to catch the absolute bottom, but accumulating when the VIX is in the "red zone" has historically been a winning strategy.
Daily Macro, Market Mood Swings, and the Stories Behind the NoisMarkets Green, But Nerves Frayed
Indian equities managed to close in the green, though enthusiasm clearly clocked out early. The Sensex rose 325 points and the Nifty added 112, but both retreated from intraday highs—classic case of optimism running into reality. Meanwhile, the rupee had a rough week, slipping past record lows to close near 93.7, down over 1%—with oil demand and geopolitics doing it no favors. Bond markets weren’t thrilled either, with the 10-year G-Sec yield climbing to 6.74%, as investors quietly recalibrated for higher oil, stickier inflation, and fewer policy freebies.
Oil Shock Turns Structural (Not Temporary Anymore)
What began as a geopolitical flare-up is now morphing into a full-blown energy crisis. The third week of the Middle East conflict saw direct hits on critical infrastructure, shifting the narrative from disruption to damage. Qatar losing 17% of its LNG capacity for potentially up to five years isn’t a headline—it’s a structural supply shock. Add to that the strike on Iran’s South Pars field, and suddenly “temporary volatility” starts looking like a long-term problem.
Attempts at calming things down didn’t quite stick. Even after assurances from political leaders, strikes continued, and by week’s end, the IEA labeled this the biggest threat to global energy ever—a line you don’t use lightly. Translation: markets are no longer debating if there’s damage, but how much more is coming.
Crude Surges, Food Inflation Queues Up
Oil prices have gone vertical—Brent up ~60%, WTI over 50% in just three weeks. That’s not a rally, that’s a sprint. Outside of rare moments like 1990 or pandemic distortions, this pace is unusual—and uncomfortable. While benchmarks differ across regions, the message is consistent: supply risk is real, and markets are scrambling to price it.
But the real second-order effect? Agriculture. Farming runs on energy—from fertilizers to transport—and rising oil prices quietly push up food costs with a lag. Farmers either cut inputs (lower yields) or pass on costs (higher prices). Either way, consumers eventually foot the bill. Inflation, it seems, is just getting warmed up.
Central Banks Hold… But Hawkish Undercurrents Rise
Central banks mostly stood still last week—but the messaging did anything but. The Fed, ECB, BoE, and BoJ held rates, yet markets pushed rate cuts further out and even flirted with hikes in 2026. Yield curves flattened as traders digested a world where inflation refuses to behave.
The Fed’s Powell added a subplot, hinting he may stick around longer than expected—much to the surprise of those who like their central bankers predictable. Meanwhile, the RBA broke ranks with a hike, a subtle reminder that inflation isn’t done and neither are central banks. The pause, in short, looks more like a breather than a pivot.
Dash to Cash: Everything Else Takes A Hit
Across asset classes, the message was simple: when in doubt, sell first, ask questions later. US equities logged a fourth straight week of losses, with global markets faring even worse. Gold, silver, and Bitcoin all slipped—so much for “safe havens” and digital rebellions.
Meanwhile, oil marched higher, widening its dominance over everything else. Bonds didn’t offer much comfort either, as rising yields and widening spreads delivered a double blow. Correlations spiked—oil up, equities down—suggesting markets are moving less independently and more… nervously.
The Week Ahead: Watching, Waiting, Pricing Risk
There’s little on the calendar today, but don’t let that fool you—the week ahead is packed. The trajectory of the Middle East conflict remains the main event, with markets watching for either de-escalation or a broader spillover. Expect fresh signals from PMIs and sentiment data, which may start reflecting early stagflationary hints.
Central banks are back in the spotlight too, with multiple Fed speakers lined up—so expect no shortage of opinions. Add OECD assessments, G7 commentary, and key data from the US, Europe, China, and the UK, and it’s clear: the data flow resumes, but the narrative remains unchanged.
BTC approaching key trendline support – breakout soon?BTC is currently trading near an important ascending trendline support on the 4H timeframe.
Price faced rejection from the 75k resistance zone and is now consolidating around 68.6k.
As long as price holds above 66.8k, we can expect a potential bounce towards 71k and possibly 74k. However, a breakdown below 66.5k could trigger further downside towards 65k support.
Market structure remains neutral with a slight bullish bias while price stays above the trendline.
Key Levels:
Support: 66.8k / 65k
Resistance: 71k / 75k
Watch for breakout confirmation before entering trades and manage risk properly.
XAUUSD GOLD Analysis on (23 MAR 2026)#XAUUSD UPDATEDE
Current price - 4497 (Sell limited 4550-4600)
If price stay below 4650, then next target 4500,4400 and 4250 and above that 4800
Plan;If price break 4550-4600 area,and stay below 4590 ,we will place sell order in gold with target of 4500,4400 and 4250 & stop loss should be placed at 4650
HDFC BANK "LEADER OF PVT BANK"Following a substantial correction, HDFC Bank now trades at more attractive valuation levels, with the ₹740–₹760 range emerging as a strong accumulation zone supported by historical demand and improved risk-reward dynamics; backed by its consistent earnings trajectory, strong CASA franchise, and disciplined risk management, the bank remains fundamentally well-positioned to capitalize on India’s long-term economic growth, where credit demand is expected to remain resilient, and therefore, initiating or gradually accumulating long positions within this range appears prudent for investors with a medium- to long-term horizon, with an expected upside potential of approximately 20%, while remaining mindful of near-term market volatility and adopting a staggered investment approach to optimize entry.
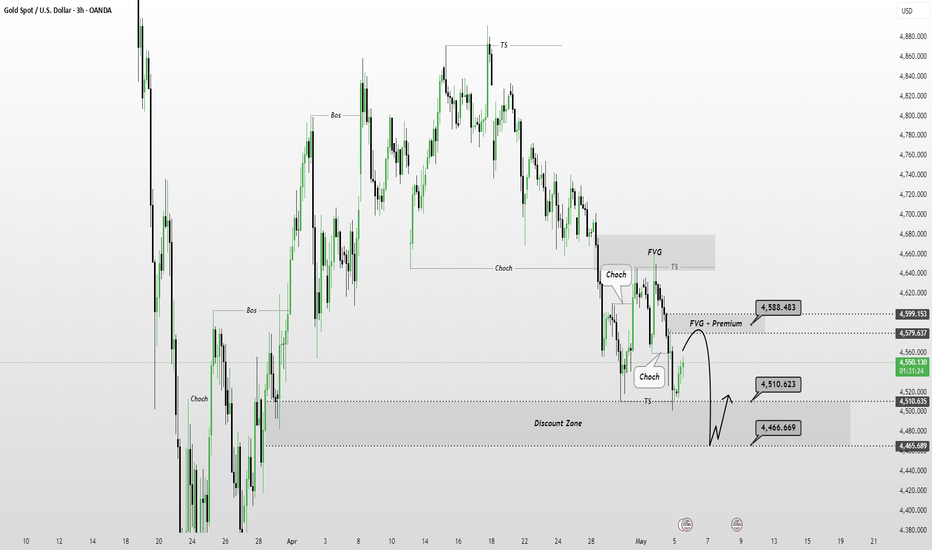
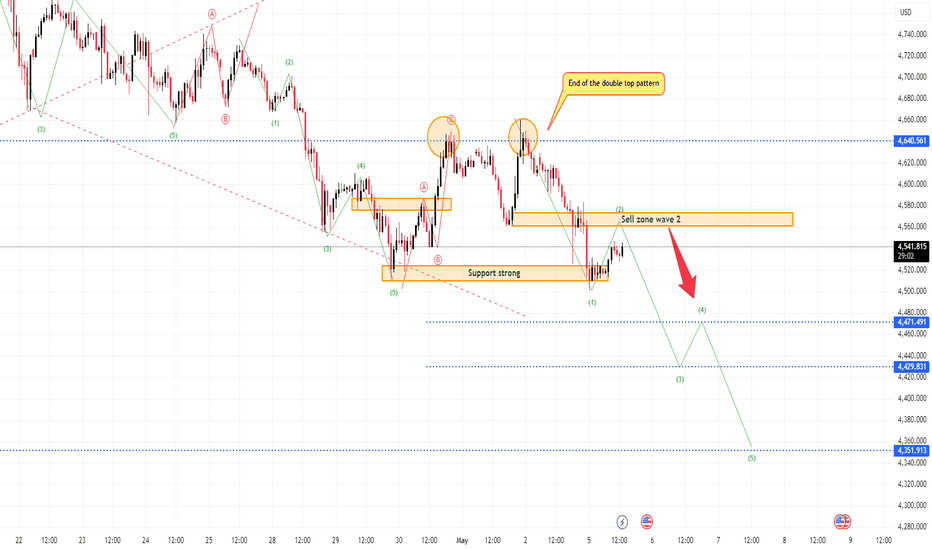
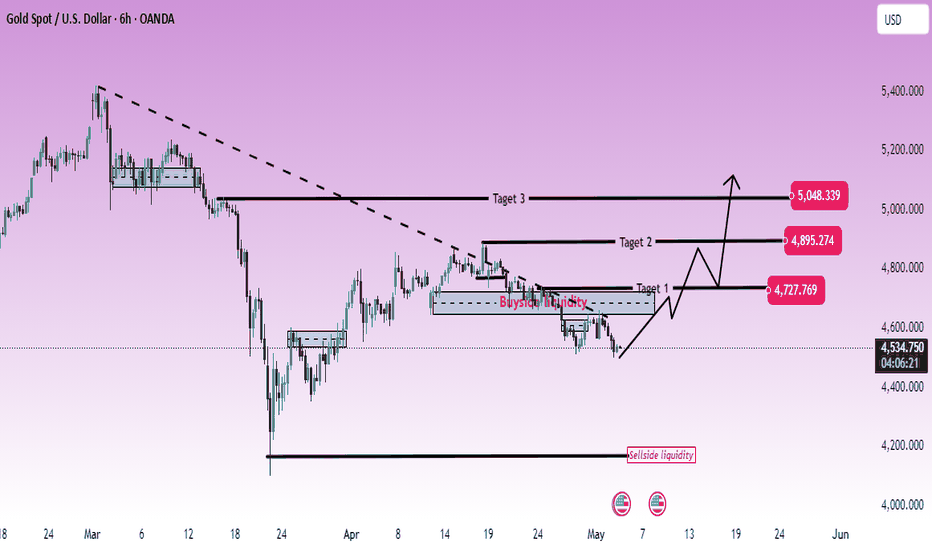
XAU/USD – DOWN 8 CONSECUTIVE DAYS… WHAT'S NEXT?Gold has now dropped for 8 consecutive sessions, closing the week down over 8.5% — a massive move that signals one thing clearly: the market is shifting into bearish control.
📉 At the time of writing, XAU/USD is trading around 4560, down nearly 2% today, while the DXY continues to strengthen, driven by:
Rising US Treasury yields (10Y near 4.38%)
Strong expectations that the Fed will NOT cut rates anytime soon
Increasing demand for USD as a safe-haven asset
⚡ Macro Pressure is REAL:
Oil (WTI) surges near $98/barrel amid escalating Middle East tensions
Military escalation is pushing inflation expectations higher
Fed officials (Powell, Waller) shifting tone → more hawkish bias
👉 Higher oil = higher inflation risk
👉 Higher inflation = higher yields
👉 Higher yields = bearish for Gold
📊 Technical + Smart Money View:
Market already confirmed CHoCH → BOS ↓
Structure = Bearish continuation
Price is aggressively moving into HTF Discount Zone
🔻 Key Zone: 4300 – 4380
→ This is the decision point of the entire trend
🚨 Trading Scenarios:
🟥 Primary (High Probability):
Pullback into IFVG (around 4.75x – 4.85x)
Rejection → Continue SELL
🎯 Targets: 4490 → 4300
🟩 Alternative (Reaction Play):
Price taps 4300 zone
Liquidity sweep + CHoCH (LTF)
→ Short-term BUY scalp
❌ Invalidation:
Strong break below 4300
→ Expect deeper downside continuation
🧠 Final Thought:
This is not a market to blindly catch bottoms.
The macro + structure are aligned:
➡️ Sell the rallies, not the dip.
#XAUUSD #Gold #SMC #ICT #Forex #TradingView #SmartMoneyConcepts
US30 Analysis on (22 MAR 2026)#US30 UPDATEDE
Current price - 45700 (Sell limited 46300-46700)
If price stay below 47300, then next target 45000,44500 and 44000 above that 49000
Plan;If price break 46300-46700 area,and stay below 46300 ,we will place sell order in US30 with target of 45000,44500 and 44000 & stop loss should be placed at 47300
XAUUSD H4: Gold Faces Selling PressureXAUUSD H4: Gold Faces Sellside Liquidity as the Market Prepares for Next Week’s Direction
Gold remains under pressure on the H4 chart as price continues to trade below the recent resistance zone and moves closer to an important sellside liquidity area. The current structure suggests that the market is still in a corrective bearish phase, but the next reaction from support will likely determine whether gold forms a rebound first or extends lower into a deeper downside leg next week.
Technical structure on H4
Overall structure
On the H4 timeframe, gold is showing a clear sequence of lower highs after failing to sustain the previous recovery. The broader structure has shifted from distribution at higher levels into a more defensive phase, with price now moving closer to the lower liquidity pool around 4404.
The recent decline also fits well with the wave projection on the chart, where the market appears to be completing another downside leg before reaching a more meaningful reaction zone.
4,800 – 4,840: Near-term supply zone
The 4,800 – 4,840 area is now the first important resistance zone.
This level previously acted as support, but after the recent breakdown it has turned into supply. If gold attempts to rebound early next week, this is the first area where sellers may become active again. A weak rejection here would keep the broader bearish structure intact.
4,404: Sellside liquidity pivot
The main level to watch is the 4,404 sellside liquidity zone.
This is the key support area on the chart and the most important short-term pivot for next week. If price moves into this region and buyers defend it well, gold may form a technical rebound back towards the upper supply area. But if this level is broken decisively, the market could open the way for a deeper move lower.
4,220 – 4,250: Lower support zone
Below the sellside liquidity, the next downside area comes in around 4,220 – 4,250.
This would be the next logical target if the current support fails and the bearish wave continues to expand. It is also the area where the market may begin to search for stronger demand after a deeper correction.
What order flow is suggesting
Current order flow suggests that sellers still control the broader structure, but price is already approaching a zone where downside momentum may begin to slow.
So for now:
sellers remain in control below the 4,800 – 4,840 resistance zone
buyers are likely waiting around the 4,404 liquidity area
and this support region may become the key decision point for next week’s direction
This means the market may first test lower liquidity before deciding whether to rebound or continue the correction.
Trading scenarios for next week
Scenario 1: Rebound from sellside liquidity
If gold holds above 4,404 and shows a clear bullish reaction, the market may recover towards the first resistance zone.
Entry: around 4,404 on bullish confirmation
SL: below 4,350
TP1: 4,650
TP2: 4,800 – 4,840
Scenario 2: Rebound into supply, then selling resumes
If price rebounds early in the week but fails around 4,800 – 4,840, the bearish trend may continue.
Entry: 4,800 – 4,840 on bearish rejection
SL: above the local swing high
TP1: 4,500
TP2: 4,404
TP3: 4,220 – 4,250
Scenario 3: Breakdown below 4,404
If gold breaks decisively below 4,404, the correction may extend further into the lower support zone.
Entry: below 4,404 on confirmed breakdown
SL: above the broken support
TP1: 4,250
TP2: 4,220
Key levels to watch
4,800 – 4,840 → near-term supply zone
4,404 → main sellside liquidity support
4,220 – 4,250 → lower support target
Outlook for next week
Gold still looks vulnerable in the short term, and the broader H4 structure continues to favour sellers while price remains below resistance. However, the market is now approaching an important liquidity zone, which means downside may begin to slow if buyers step in around 4,404.
For next week, the preferred view is still cautious to bearish, with 4,404 acting as the key decision level. A hold above this area may trigger a rebound, but a breakdown would expose a deeper correction into the next support zone below.
Follow Lana for more XAUUSD trading ideas and clear technical setups.
Gold Experiences Deeper Weekly PullbackGold Faces a Deeper Weekly Pullback
XAUUSD is entering next week under pressure, with the structure still pointing towards a deeper move into the 2.618 Fibonacci support zone.
Gold ended the week on a heavy note after failing to hold above the rising trend structure that had supported the broader advance for months. The recent breakdown matters. What was previously a stable bullish trend has now shifted into a more vulnerable phase, with price slipping back below key Fibonacci support layers and losing upside momentum into the weekly close.
From a broader perspective, this is no longer just a routine correction. The chart is starting to show a market that is unwinding a larger bullish leg, and unless buyers quickly rebuild structure above broken support, the downside path remains open into lower demand zones next week.
Technical Structure
On the higher timeframe, gold has already rejected from the upper extension area and rolled over sharply. The latest decline has pushed price below the rising trendline that previously held the bullish structure together, while the market is now trading back under the 0.382 Fibonacci region.
That shift leaves the chart in a weaker position.
The next key zone sits around 4,292, marked as the Fibonacci resistance area. This is the first level that would need to be reclaimed to reduce immediate downside pressure. But as long as price stays below it, the market still looks vulnerable to another leg lower.
Below current levels, the more important downside target comes in around 4,131, which aligns with the 2.618 Fibonacci zone and the highlighted buy area on the chart. This is the area where stronger demand may begin to reappear if the sell-off continues next week.
Key Price Zones
Near-Term Resistance: 4,292
This is the first important level on the way back up. If gold cannot reclaim this zone, the bearish structure remains intact.
Major Downside Target / 2.618 Fibonacci Zone: 4,131
This is the main level to watch next week. It is the deeper support area and the most likely downside destination if pressure continues.
Broken Trend Support
The loss of the previous ascending trendline is a major technical warning. Unless price can recover back above it, rallies may continue to be treated as corrective rather than a real bullish recovery.
Weekly Scenarios
Scenario 1 – Continue Lower Into 4,131
This is the primary scenario for next week.
If gold remains below the broken support structure and fails to reclaim 4,292, the market may continue extending lower into the 4,131 buy zone. That would complete a deeper retracement into the 2.618 Fibonacci area and keep the current weekly pressure firmly on the downside.
Scenario 2 – Short-Term Bounce, Then Resume Lower
Gold may still produce a technical rebound early in the week, especially after such a sharp decline. But unless that rebound can reclaim and hold above 4,292, it would likely remain corrective.
In that case, any recovery would simply reset price before sellers press the market lower again.
Scenario 3 – Reclaim 4,292 and Stabilise
This is the less likely scenario for now, but it cannot be ignored.
If buyers manage to reclaim the 4,292 resistance zone and build acceptance above it, the immediate downside pressure would begin to ease. That would reduce the risk of a direct move into 4,131 and suggest the market is trying to stabilise after the breakdown.
Still, this would need clear confirmation. At the moment, the chart does not support that view as the primary path.
Market Insight
Gold is heading into next week with a structure that has clearly weakened.
The breakdown from trend support, the rejection from higher Fibonacci levels, and the inability to hold recent rebound attempts all point to a market that is still in correction mode. That does not mean price cannot bounce along the way, but it does mean the burden of proof is now on buyers.
From my perspective, the market still looks vulnerable to a deeper move into the 2.618 Fibonacci zone near 4,131 before stronger support can be tested properly.
For next week, the message is simple: unless gold can reclaim 4,292, the broader structure still favours another leg lower into deeper support.
Gold is falling in a war—here’s what most traders misunderstand!At first glance, gold dropping during geopolitical tension feels irrational. War + inflation should push gold higher… right?
But markets don’t move on logic alone—they move on liquidity and policy control.
The Gold Cycle (Simplified):
Phase 1 – Fear & Inflation → Gold Rises
War begins, inflation rises → capital flows into gold as a safe haven.
Phase 2 – Policy Tightening → Gold Falls (Current Phase)
Central banks step in:
Higher interest rates
Rising bond yields
→ Capital shifts back to USD
→ Gold loses attractiveness
Phase 3 – Economic Slowdown → Gold Stabilizes
High rates start hurting growth → cracks appear in the system.
Phase 4 – Crisis & Liquidity Injection → Gold Rallies Strong
Rate cuts + money printing → currency devaluation → gold surges.
Phase 5 – Recovery → Gold Declines / Ranges
Capital rotates back into productive assets → gold cools off.
Current Reality:
We are likely in Phase 2 (tightening pressure):
USD strong
Yields elevated
Fed still cautious
On top of that:
👉 SPDR Gold ETF reduced holdings by ~23 tons in March
→ Institutional outflow confirms bearish pressure
Key Insight:
Gold is not just a “safe haven”—it’s a liquidity asset.
It rises when money is cheap… and falls when money has a cost.
What to Watch Next:
Yield direction (10Y bonds)
USD strength
Any shift in Fed tone.
XAUUSD H4: Medium-Term Gold OutlookGold May Recover First, but the Medium-Term Structure Still Favours Further Decline
Gold may still show a recovery bounce from current levels, but the broader structure continues to point lower. Even if price rebounds in the short term, the market is still facing medium-term corrective pressure as expectations for tighter monetary policy from major central banks continue to rise, while spot crude oil in the Middle East has surged towards the 150 USD area, keeping inflation risks elevated.
The key question now is not whether gold can recover briefly, but whether that rebound will only create a better selling opportunity before the market continues into the next bearish leg.
Fundamental backdrop
The macro environment remains difficult for gold in the medium term.
Rising expectations for further rate tightening from major central banks are keeping real yield pressure elevated, which reduces the attractiveness of non-yielding assets like gold. At the same time, the sharp rise in crude oil prices is increasing inflation concerns, but it is also reinforcing the likelihood that policymakers may need to remain restrictive for longer.
This combination creates a mixed background in the short term, but from a broader perspective it still favours correction rather than a clean bullish continuation in gold.
Technical structure on H4 Overall structure
On the H4 chart, XAUUSD remains inside a broader bearish corrective phase despite the recent reaction from lower levels. The current rebound does not yet change the larger structure, because price is still trading below the major long-term selling zone at 4815–4845 and below the previous breakdown structure.
The chart also suggests that the market may still be unfolding a larger bearish sequence, with the current rebound potentially acting as a temporary recovery before the next downside extension.
4815–4845: Long-term selling zone
The 4815–4845 area is the most important resistance zone in the current structure.
This is the main zone where price may complete a recovery leg and attract renewed selling pressure. If gold rebounds into this area but fails to reclaim it with strong momentum, the market may begin the next medium-term decline from here.
From a structure perspective, this is the most reasonable area to wait for a sell setup rather than chasing the current move lower.
4404: Sellside liquidity target
Below the market, the 4404 area stands out as the main sellside liquidity level.
This zone is important because it represents the next major downside objective if the broader bearish structure continues to unfold. A move into this area would also fit the idea of the market extending into a larger wave 5 decline.
4300 area: Deeper OB support
If bearish momentum expands further, the next major reaction zone comes in around the 4300 OB area.
This is the deeper support zone on the chart and the region where a stronger reaction from buyers may appear if the correction becomes more aggressive.
What the wave structure is suggesting
The current structure supports the idea that gold may still be preparing for another leg lower in the medium term.
The recent rebound looks more like a corrective recovery than the beginning of a new bullish cycle. If price continues to recover into the 4815–4845 resistance zone and then gets rejected, that could become the trigger for the next broader decline, with the market potentially extending into a wave 5 move lower.
So for now:
the broader trend remains under corrective bearish pressure
the current rebound may only be temporary
and the preferred strategy is still to wait for a better sell zone rather than buying into resistance
Trading scenarios Scenario 1: Recovery into sell zone, then bearish continuation
If gold continues to recover towards 4815–4845 and shows clear rejection, the market may resume its medium-term decline from this area.
Entry: 4815–4845 on bearish confirmation SL: above 4870 TP1: 4680 TP2: 4500 TP3: 4404 TP4: 4300
This remains the preferred setup, as it aligns with the broader bearish structure and the expectation of a larger wave 5 extension.
Scenario 2: Direct continuation lower without deeper rebound
If gold fails to recover into the higher resistance zone and remains weak below current structure resistance, sellers may continue pressing price lower directly.
Entry: on bearish continuation below the recent recovery structure SL: above the local swing high TP1: 4500 TP2: 4404 TP3: 4300
Scenario 3: Bullish invalidation
If price breaks above 4845 and holds firmly above the long-term selling zone, the bearish medium-term view would weaken significantly.
That would suggest the market is no longer in a simple corrective rebound and may need a broader re-evaluation.
Key levels to watch
4815–4845 → long-term selling zone 4680 → first downside reaction level 4500 → intermediate bearish target 4404 → major sellside liquidity 4300 → deeper OB support zone
Conclusion
Gold may still recover in the short term, but the broader H4 structure continues to favour a medium-term decline. The current rebound is more likely to be a corrective move rather than the start of a sustained bullish reversal.
For Lana, the preferred approach is clear: wait for a reasonable sell zone, not chase price at the bottom. As long as gold remains below 4815–4845, the market still has room to extend lower, with 4404 and then 4300 remaining the key downside targets in a potential wave 5 scenario.
Follow Lana for more XAUUSD trading ideas and clear technical setups.
GOLD: 4860 DEATH ZONE – DON’T BE FOOLED BY WAR HEADLINES!Warning: Is the "Safe Haven" rally a massive trap for retail buyers?
While the world is fixated on U.S.-Iran tensions and hawkish rhetoric from the Middle East, the XAU/USD chart is whispering a completely different story. Are you following the "News Headlines" or the "Smart Money Footprints"?
1. The "Geopolitical" News Trap 🛡️
War news often creates a psychological "knee-jerk" rally. Retail traders are FOMO-buying, fearing they’ll miss the flight to safety. But look at the macro reality:
The Fed & Powell: Inflation driven by surging oil prices is the perfect excuse for the Fed to keep rates "higher for longer." High rates are the #1 enemy of non-yielding Gold.
Margin Call Liquidation: In periods of extreme market stress, institutional players often dump their most liquid assets—like Gold—to cover losses in crashing equity portfolios.
2. Price Action: 4860 is the "Pivot of No Return" 🎯
Stripping away the noise, the market structure tells a cold truth: THE BEARS ARE IN FULL CONTROL.
Structural Breakdown: Gold has officially breached key support levels on the H4 timeframe, confirming a shift from bullish to bearish momentum.
The Confluence Zone (4860): This is where heavy institutional sell orders are likely sitting. It’s not a place to "buy the breakout"—it’s a place where the market resets for the next leg down.
The Target: If 4860 holds, we are looking at a slide toward 4584, or even a deep liquidity sweep at the 4390 level.
3. Execution Strategy 📝
STAY PATIENT: Do not jump in while the price is floating in "No Man’s Land."
WATCH THE REACTION: Wait for a retest of the 4860 zone. Look for rejection candles or a breakdown on lower timeframes before pulling the trigger.
RISK MANAGEMENT: Geopolitical volatility can cause "stop-loss hunting" in both directions. Keep your risk tight!
WHAT’S YOUR MOVE?
Can Middle East tensions break the bearish structure? Or is this just a "dead cat bounce" before the next crash?
👇 Comment "SELL" or "BUY" below to join the discussion!
#XAUUSD #GoldStrategy #MarketAnalysis #ForexTrading #WarNews #Fed #PriceAction #Investing #GoldPrices
Trend Integrity Test: Mid-BB & RSI 50 Under PressureSince Nov 2023 (Israel–Hamas War), gold has maintained a strong uptrend, consistently holding above the mid Bollinger Band (20 MA) and RSI 50.
Multiple macro-driven pullbacks (e.g., U.S. Import Tariffs announcements, 2024 U.S. Presidential Election, Iran war escalation Feb 2026) have acted as continuation points rather than breakdowns.
The current move marks the first meaningful attempt to break this structure.
🔍 What the chart is really showing
1. Persistent trend behavior (since Nov 2023)
Price has respected the middle Bollinger Band (20 MA) as dynamic support.
RSI has consistently held above 50 during pullbacks.
Every “event-driven dip” (wars, tariffs, elections) = buy-the-dip reaction, not trend failure.
👉 That’s classic strong trend continuation behavior, not distribution.
2. What’s different this time?
Right now:
You have a sharp rejection from ATH (~5600)
A strong bearish candle closing below the mid-band
RSI is breaking down toward (or below) 50
This is important:
⚠️ This is the first real structural violation attempt of the trend.
🧠 Two scenarios from here
🟢 Bullish continuation (trend survives)
This happens if:
Price quickly reclaims the mid Bollinger Band
RSI reclaims 50 and holds
This drop turns into another “event-driven shakeout”
👉 Then this becomes:
Just another higher low
Continuation toward new highs
Probability note:
Still reasonable because the trend has been extremely resilient.
🔴 Bearish breakdown (trend change)
This happens if:
Price fails to reclaim the mid-band on bounce
RSI stays below 50 (very important)
Lower highs start forming
👉 Then you likely get:
Move toward lower Bollinger Band
Deeper pullback (potential trend shift)
Key insight:
The first clean loss of mid-band + RSI 50 after a long trend often leads to a larger corrective phase, not just a shallow dip.
⚖️ So… continuation or major breakdown?
My honest take based on your chart:
This is a decision point, not a confirmed breakdown yet.
But it’s also not just another routine pullback anymore.
👉 In simple terms:
Above mid-band again → bullish continuation likely
Below mid-band + RSI < 50 holds → bearish phase beginning
🎯 What I’d watch (very actionable)
Next 3–5 candles
Strong reclaim? → bullish
Weak bounce? → bearish setup
RSI behavior
Snap back above 50 = trend intact
Rejection at 50 = trend shift signal
Structure
Higher low vs lower high → tells you everything
🧩 Final thought
What made this trend powerful wasn’t just price going up—it was:
Repeated failure of bears to break the mid-structure.
Right now, bears are finally attempting that break.
This is exactly where:
Trends either reset and continue
Or transition into a deeper correction
XAUUSD - Recovering after sharp decline.XAUUSD is attempting to rebound after a heavy correction, but the market is still trading inside a broader pressured structure.
Gold came under strong selling pressure after the US Dollar held firm, with the DXY trading near 99.40 following the Federal Reserve’s decision to keep policy unchanged while maintaining a hawkish stance. That combination kept the dollar supported and forced gold into a deeper correction, as higher-for-longer expectations continued to weigh on upside momentum.
Still, Friday’s price action is beginning to show a different tone.
After the sharp sell-off, gold is now reacting from a key lower demand zone around 4,648, suggesting that buyers are starting to step back in as the market moves towards the end of the week. This does not yet mean the broader pressure has disappeared, but it does open the door for a rebound into the weekly close if price can continue rebuilding structure from current levels.
Technical Structure
From a technical perspective, gold remains under pressure on the higher structure, but the latest move has pushed price into an area where short-term recovery becomes technically reasonable. The chart shows that the recent decline extended aggressively into the lower buy zone before buyers finally responded.
That response matters.
The market is now trying to recover from an oversold leg, and the first thing to watch is whether price can hold above the 4,648 support base. As long as that area remains protected, the rebound scenario stays valid.
The next upside layer sits around 4,851, which marks the first important recovery resistance. If gold can reclaim that level with a firmer reaction, the market may continue rotating higher into 4,958, where another resistance zone is waiting. Above that, the broader upside target opens towards 5,078, which aligns with the upper fair value gap and a much heavier resistance structure.
So while the chart is still technically recovering inside a damaged structure, the path for a Friday rebound is clearly visible if buyers can keep price stable above the current base.
Key Price Zones
Buy Zone / Immediate Support: 4,648
This is the key support holding the rebound scenario together. If gold stays above this area, buyers still have room to lift price into higher recovery levels.
First Recovery Resistance: 4,851
This is the first important barrier on the way back up. A move through this zone would show that the rebound is gaining traction.
Second Resistance: 4,958
This level is the next upside checkpoint. If reclaimed, it would strengthen the case for a broader late-week recovery.
Major Recovery Target / FVG Zone: 5,078
This is the upper resistance area and the more meaningful upside objective if Friday’s rebound extends with stronger momentum.
Market Scenarios
Scenario 1 – Hold Above 4,648 and Rebound Into the Close
This is the preferred scenario for Friday.
If buyers continue defending the current support zone, gold may recover into 4,851 first, then extend towards 4,958. If momentum remains strong into the close, the market could even test the upper imbalance area near 5,078.
This would fit the idea of a sharp correction followed by a recovery rebound to finish the week.
Scenario 2 – Bounce Into Resistance, Then Stall
Even if gold rebounds, resistance still has to be respected.
A move into 4,851 or 4,958 could still attract fresh selling if the broader bearish pressure remains in control. In that case, the rebound would remain corrective rather than a true reversal.
This is why reclaiming levels is not enough on its own. The market also needs to hold above them.
Scenario 3 – Lose 4,648 and Keep the Structure Heavy
If price falls back below 4,648 with clear downside acceptance, the rebound scenario weakens quickly.
That would suggest the current bounce is failing and that sellers are still controlling the short-term direction. In that case, Friday may finish with pressure still dominating rather than easing.
Market Insight
Gold is not trading in a clean bullish environment right now.
The stronger dollar, the Fed’s hawkish tone, and the recent damage in structure are all factors that continue to limit upside confidence. But at the same time, the latest sell-off has pushed price deep enough into support to create room for a technical rebound.
That is where the market stands now.
From my perspective, this is a Friday recovery setup, not a confirmed trend reversal. As long as gold can stay above 4,648, the rebound towards 4,851 and 4,958 remains technically valid, with 5,078 as the higher recovery target if momentum improves into the weekly close.
But this still needs confirmation.
In markets like this, the smartest approach is not to assume the rebound is real too early. It is to let the market earn that view level by level.
NZDCHF Analysis on (19 MAR 2026)#NZDCHF UPDATEDE
Current price - 0.46200
If price stay above 0.45800 then next target 0.46700,0.47200 and below that 0.45100
Plan1;If price break 0.46100-0.46200 area,and stay above 0.46200 we will placed buy order in NZDCHF with target of 0.46700,0.47200 & stop loss should be placed at 0.45800
XAUUSD H2: Gold Continues Bearish TrendGold remains under heavy pressure, and the current structure still favors sellers. The latest drop is not just a technical pullback — it reflects a market that is losing bullish support while macro pressure continues to build.
Fundamental backdrop
The Fed kept rates unchanged, but Powell’s tone stayed firm, which reduced expectations for near-term rate cuts and kept the US Dollar supported. At the same time, US PPI came in stronger than expected, adding more pressure on the inflation outlook.
On top of that, tensions between Iran and Israel continue to escalate, pushing oil higher and increasing overall market uncertainty. Even with geopolitical risk in the background, gold still sold off sharply, which shows that bearish pressure is currently dominating price action.
Another negative signal came from ETF flows, as SPDR Gold Trust reduced its gold holdings again. That tells us institutional sentiment is not yet providing enough support to stabilize the market.
Technical structure on H2 – SMC view
Overall structure
On the H2 chart, XAUUSD is clearly trading in a bearish trend. Price continues to form lower highs and lower lows while remaining inside a descending structure. This confirms that sellers are still controlling the market.
The recent breakdown below the previous support base shows that the downside move is still active. For now, the market is not showing a true reversal pattern — it is only pausing after strong selling pressure.
4,900 – 4,940: FVG resistance
The nearest area to watch on any rebound is the 4,900 – 4,940 FVG zone.
From an SMC perspective, this is the first imbalance area where price may return before sellers step back in. If gold retraces into this region and fails to reclaim it, the market may form another lower high and continue the bearish trend.
This keeps the FVG as a clear sell zone rather than a bullish recovery area.
5,038: OB resistance
Above that, the 5,038 order block remains the next major resistance.
If price manages to push beyond the first FVG, this level becomes the next premium area where sell pressure may return. As long as gold stays below this OB, the broader bearish structure remains unchanged.
4,844: Breakdown pivot
The 4,844 area is now acting as the key short-term pivot.
Price is trading around this level after the latest selloff, and it now separates a weak bounce from a deeper continuation lower. If buyers fail to recover above it with strength, the current move is likely just another bearish consolidation before the next leg down.
4,700 – 4,680: Sellside liquidity zone
Below the current price, the next major target sits around 4,700 – 4,680.
This is the main sellside liquidity area on the chart and also the next important reaction zone. If sellers continue to press lower, this region becomes the most likely downside objective.
4,600: Deeper liquidity target
If bearish momentum continues to expand, the 4,600 area becomes the deeper target to watch.
That would represent a broader correction, but under the current structure, it remains a realistic downside path while gold stays below resistance.
What order flow is suggesting
Order flow still supports the bearish side.
So for now:
sellers remain in control below the descending structure
rebound attempts are being capped before reclaiming bullish zones
and the market still looks like distribution rather than accumulation
This is why the preferred view remains bearish unless price can reclaim both the FVG and the upper order block.
Trading scenarios
Scenario 1: Pullback into FVG, then sell continuation
If gold rebounds into 4,900 – 4,940 and shows rejection, sellers may use that area to continue the downtrend.
Entry: 4,900 – 4,940 on bearish confirmation
SL: above 4,980
TP1: 4,844
TP2: 4,700
TP3: 4,680
TP4: 4,600
Scenario 2: Direct bearish continuation
If price remains below 4,844 and fails to recover, gold may continue lower without a deeper pullback.
Entry: below 4,844 on confirmed continuation
SL: above the nearest reclaimed structure
TP1: 4,700
TP2: 4,680
TP3: 4,600
Scenario 3: Recovery only if structure is reclaimed
A stronger bullish recovery would only become valid if price reclaims the FVG and breaks back above 5,038.
Entry: only after a confirmed reclaim above resistance
SL: below the reclaimed zone
TP: higher resistance based on follow-through
At this stage, this remains the weaker scenario.
Key levels to watch
5,038 → OB resistance
4,900 – 4,940 → FVG sell zone
4,844 → breakdown pivot
4,700 – 4,680 → major sellside liquidity
4,600 → deeper downside target
Conclusion
Gold still looks clearly bearish on the H2 chart. The combination of a firm Fed tone, stronger inflation pressure, weaker ETF sentiment, and a broken technical structure keeps the market under downside pressure.
As long as XAUUSD stays below 4,900 – 4,940 and especially below 5,038, Lana still prefers the bearish scenario. For now, the focus remains on selling rallies rather than expecting a full reversal too early.
Follow Lana for more XAUUSD trading ideas and clear SMC setups.
XAUUSD- Wave 5 Is Nearly DoneXAUUSD (H1) — The downtrend is still dominant, but the better setup may soon shift from selling to reversal trading
Gold is still trading inside a very clear bearish sequence on H1.
The chart continues to print lower highs and lower lows, and the latest breakdown shows that sellers are still controlling the broader move. From a structural point of view, this is still a market under heavy pressure, not a market that has completed reversal confirmation.
However, the chart is now entering a different stage of the trend.
The sell side is still dominant, but the easy short entries are no longer as clean as they were earlier in the move.
Structure reading
Looking at the chart, the bearish flow has already developed through a fairly complete impulsive decline.
The market moved from a larger consolidation block near the 5000–5040 region, then broke sharply lower and continued printing a fresh sequence of lower swing points.
The wave labels on the chart also suggest that the move is already deep into a 5-wave decline, with the current leg likely approaching the later stage of that sequence.
That matters because once wave 5 becomes extended, the risk starts to change:
trend direction may still be bearish
but fresh sell entries become less efficient
and the probability of a corrective rebound begins to increase
So the chart is still bearish, but not in the same “high-quality short entry” condition as before.
Key technical zones from the chart
1. Upper supply / recovery cap around 484x–485x
This is the first recovery ceiling marked on the chart.
If gold starts to rebound from current lows, this is the nearest area where short-term supply may appear again.
For now, this zone is still acting as a technical cap.
A bounce into this area without strong follow-through would still look corrective.
2. Recent sell liquidity around 4803
This dotted horizontal level is important because it marks the recent sell-side liquidity reference.
Price has already moved through that area and is now trading below it, which confirms that the structure has weakened further.
Unless the market can reclaim that level with strength, the current breakdown remains valid.
3. FVG sell scalping zone around 474x
This is the lower orange zone shown on the chart.
Under normal trending conditions, such an area can still offer a reaction or short-term rejection, but the problem now is timing.
Because price is already extended into the lower part of the structure, Kelly does not see this as an attractive place to chase the sell side aggressively.
The move has already traveled far, which means reward-to-risk for fresh shorts is no longer ideal.
4. Current low area around 468x
This is where the market is now trading after the latest strong breakdown candle.
When price reaches this kind of stretched location after an impulsive fall, the market often enters one of two phases:
a final exhaustion push lower
or a technical rebound before the next larger corrective sequence begins
That is why the next opportunity may no longer come from trend-chasing, but from waiting for a reversal structure.
Why Kelly does not prefer a fresh sell here
This is the most important part of the chart.
Yes, the structure is still bearish.
Yes, sellers are still in control.
But the sell entry now is late.
The earlier short opportunities came from:
rejection below broken support
retest of supply
continuation from cleaner lower highs
Now price is already far below those better entry zones.
Selling here means entering after extension, when the downside may still continue but the quality of positioning has clearly dropped.
For Kelly, that is not ideal trading.
A correct bias does not automatically mean a correct entry.
What Kelly is watching next
The chart itself already hints at the next likely transition:
after the 5-wave decline completes, the market may begin an ABC corrective phase.
That does not mean gold becomes bullish immediately.
It means the first cleaner setup may come from a smaller-timeframe reversal structure, not from another late sell.
What Kelly wants to see now is:
price stops printing aggressive impulsive sell candles
a lower timeframe base begins to form
the market creates a higher low
broken intraday resistance gets reclaimed
a reversal pattern appears before any long idea is considered
In other words, the buy is not here yet — but the market may be getting closer to preparing one.
Scenario map
Main scenario
Gold may complete the final portion of wave 5, then begin a corrective rebound.
If that happens, the next move could develop as an ABC structure, with the first upside reaction likely aimed back toward the nearby recovery zones.
Secondary scenario
If sellers still force one more breakdown from current levels, the move may become a final exhaustion leg.
But even in that case, Kelly would still avoid chasing that weakness too late and would rather wait for the post-extension reversal pattern.
Kelly’s read
This chart is still bearish in structure, but no longer attractive for fresh aggressive selling.
That distinction matters.
For Kelly, the market has moved from a trend-following sell phase into a wait-for-reversal-preparation phase.
The bias remains down, but the better opportunity ahead may come from patience on the lower timeframe, not from selling after the move is already stretched.
Conclusion
Gold is still sitting in a clear bearish H1 structure, and the 5-wave decline appears close to completion.
The sell side still controls direction, but the entry quality for new shorts has deteriorated sharply after the latest extension.
That is why Kelly is no longer focused on chasing the downtrend here.
The better plan is to wait for the smaller timeframe to build a proper reversal structure. If wave 5 finishes as expected, the next meaningful move may come in the form of an ABC corrective rebound.
The trend is still bearish — but the next clean trade may belong to the patient buyer, not the late seller.