XAGUSD 4H: Reversal Plan after Buyer Shakeout & Seller Trap1. Market Context
Following up on our June 22nd strategy, Silver has executed the anticipated liquidity run perfectly. The price aggressively collapsed below the 63.377 key support (marked "Buyer Lose") to clean out retail buyers. It has now reached the absolute structural support zone near 56.725 on the 4H chart of image_06c301.png, showing strong signs of exhaustion.
2. Sentiment & Price Trap Analysis
• The Finished Buyer Hunt (Buyer Lose): The heavy decline below 63.377 successfully triggered the stop losses of early retail buyers, forcing them out of the market at the worst possible prices.
• The Late Breakout Seller Trap (No Buyer): As the breakdown looked extremely bearish, a massive wave of retail momentum traders chased the move by opening heavy short positions near the bottom. However, the rejection at 56.725 (marked "No Buyer") indicates that there is no more genuine selling pressure. These late sellers are now completely trapped at the absolute bottom.
• The Impending Short Squeeze: As the price begins to recover, these trapped sellers will be forced to buy back their positions to cut losses. Their stop losses (buy stops) are clustered at key structural levels (marked "Seller Wait Here" at 63.377, the local trendline, and the major descending trendline near 71.332), which will act as rocket fuel for a massive upward squeeze.
3. Trade Setup (The Squeeze Play)
We target a high-reward long entry to exploit the trapped sellers' exit momentum.
• Entry: 56.725 (Buying the reversal confirmation / No Buyer zone)
• Stop Loss (SL): 54.160 (Placed safely below the ultimate support at 54.451)
• Take Profit (TP): 85.802 (Targeting the major descending trendline breakout and upper target)
• Risk-to-Reward Ratio (R:R): Approx 11.3:1
Gann Box
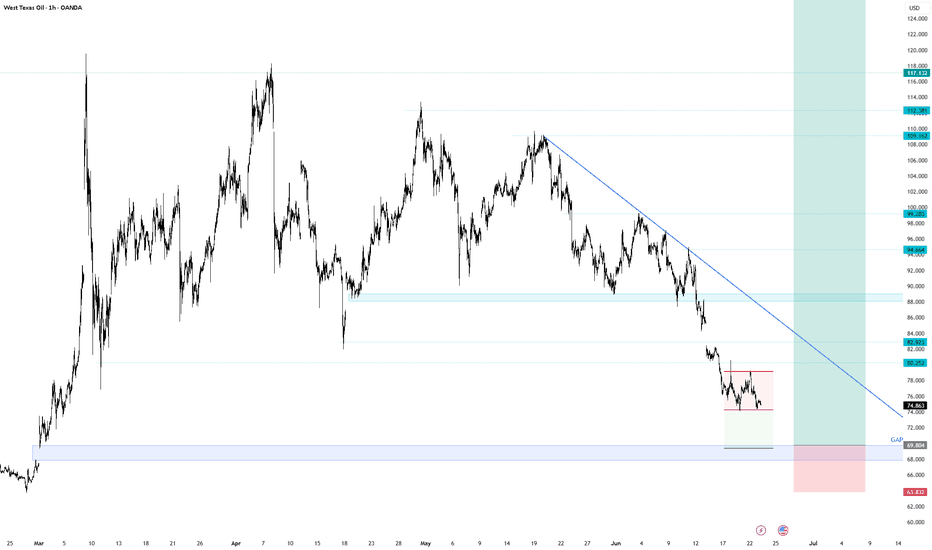
WTICOUSD Strategy: Hunting the Consolidation & Gap Trap
1. Market Context On the 1H chart of image, West Texas Oil is trading under a major descending trendline. After a sharp decline, the price is consolidating in a tight range between 74.000 and 79.500.
2. Psychology & Price Trap Analysis
• The Buyer Trap: Retail traders are trying to buy the local double-bottom support around 74.000, placing their stop losses just below this level.
• The Breakout Seller Trap: A breakdown below 74.000 will trigger panic, inducing retail momentum sellers to aggressively short near the bottom.
• The Liquidity Hunt: Market makers are highly likely to sweep these stops and drive the price deeper into the major historical GAP zone at 69.804. Once the GAP is filled and sellers are trapped, a rapid V-shape recovery will trigger a massive short squeeze.
3. Trade Setup (The Gap Fill Play)
We set a buy limit at the major liquidity sweep zone below.
• Entry: 69.804 (Buying the GAP fill / liquidity sweep)
• Stop Loss (SL): 63.832 (Placed safely below the ultimate invalidation level)
• Take Profit (TP): 99.203 (Targeting the major descending trendline breakout target)
• Risk-to-Reward Ratio (R:R): Approx 4.9:1
NZDUSD 1H - Reversal Plan: Trapping the Late Sellers1. Market Sentiment & Price Trap
Following up on our June 18th plan, the market has perfectly executed a psychological trap. The aggressive breakdown below 0.57500 triggered the "Buyer Lose" phase, forcing early longs to liquidate their positions. As price pushed into the 0.57100 zone, retail traders fell into the trap, aggressively chasing the momentum with late shorts. However, the "No Buyer" signal at the absolute low indicates that the selling pressure has dried up after the liquidity sweep. Market makers have successfully trapped the FOMO sellers right at the bottom of the descending structure.
2. Technical Structure
Price is currently holding firm above the multi-week major descending trendline support and the critical horizontal floor at 0.56862. The local consolidation right above this green support line shows that the bearish momentum has completely faded, setting the stage for a sharp short squeeze to clean out the trapped sellers.
3. Tactical Execution
We trigger a long position to exploit the trapped short positions and target the upper liquidity pools.
• Entry Zone: 0.57312 (Current market price)
• Stop Loss (SL): 0.56858 (Placed safely below the key green support line)
• Take Profit (TP): 0.58320 (Targeting the upper counter-trendline and major liquidity pool)
• Risk-to-Reward (R:R): Approx 2.2:1
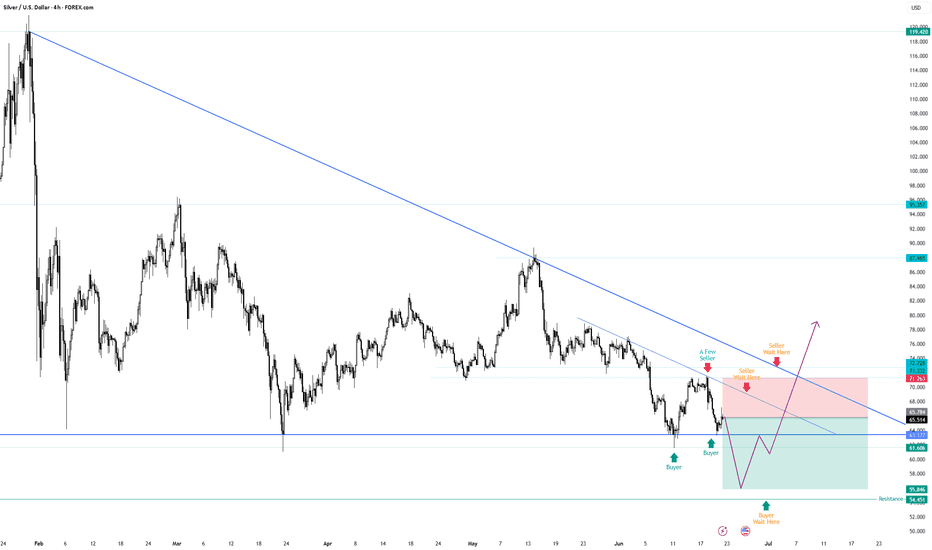
XAGUSD Strategy: Shaking Out Buyers & Trapping Breakout Sellers
1. Market Context
On the 4H chart of image, Silver is trading under a long-term descending trendline. After a temporary relief rally, the price is facing strong rejection at the local resistance zone near 71.263 (marked "A Few Seller").
2. Psychology & Price Trap Analysis
• Chasing Away Buyers (Stop Hunt): Retail traders have been buying the horizontal support at 63.377 (marked "Buyer"). Their stop losses are clustered heavily below 63.377 down to 55.846. Market makers are highly likely to drive the price downward to sweep these stop losses, forcing early buyers out of their positions.
• Trapping Sellers (The Bear Trap): As the price aggressively breaks below 63.377, it will look like a massive bearish breakdown. This clean breakdown will induce retail breakout traders to chase the momentum and open heavy short positions near the absolute bottom (55.846). Once they are fully trapped, a rapid V-shape recovery will be triggered.
3. Trade Setup (The Liquidity Run)
We target a short position to capitalize on the downward momentum generated by the retail buyers' stop-run.
• Entry: 65.606 (Selling the local resistance rejection)
• Stop Loss (SL): 71.263 (Placed safely above the local swing high)
• Take Profit (TP): 55.846 (Targeting the major support sweep/Buyer Wait Here zone)
• Risk-to-Reward Ratio (R:R): Approx 1.72:1
EURUSD: Bearish Orderflow Continuing From PremiumPrice continues to respect bearish orderflow after reacting from premium arrays and internal liquidity.
Current framework:
Clear H1 bearish displacement
Retracement into imbalance and premium zone completed
Price rejecting lower-timeframe supply
Sell-side liquidity resting below current structure
Discount targets aligned beneath current lows
My expectation:
As long as price remains below the marked premium zone, continuation towards the sell-side liquidity and lower discount arrays remains the higher probability scenario.
Bearish expansions often retrace into inefficiencies before continuing in the direction of delivery.
Banknifty key levels for this year 2026Banknifty key levels for this year 2026.
These levels are derived from past 52 weeks data of Banknifty.
These key levels will act as major support and resistance for the coming weeks.
100% candles are not correct, it can be deceiving, don`t fall into traps.
Line chart might help.
Plot these levels and check yourself.
Have Green New Year (2+0+2+6=1)
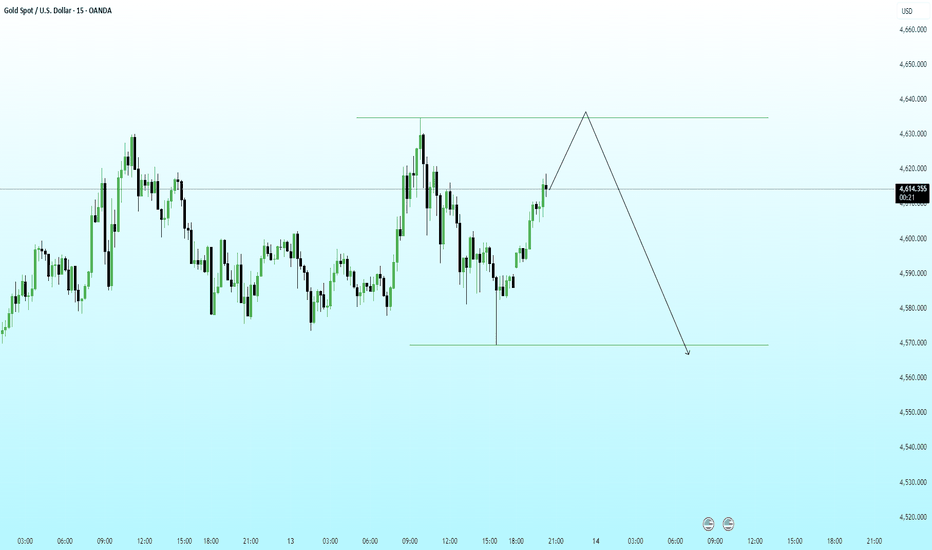
XAUUSD (15M) – Liquidity Sweep → Distribution SetupPrice is currently trading inside a clearly defined range.
Previous sell-side liquidity has already been swept from the equal lows, triggering a sharp displacement to the upside. This move looks corrective rather than impulsive.
Key observations:
Upside move is targeting equal highs / range high liquidity.
Area near the range high aligns with premium zone + likely supply.
Expecting buy-side liquidity grab above highs to trap late longs.
Plan & Bias:
Allow price to run the highs and complete the liquidity sweep.
Watch for bearish shift in market structure (MSS) on lower timeframe near the range high.
Look for short entries on retest of supply / FVG after MSS.
Target is a range rotation back to sell-side liquidity near the range lows.
Narrative:
Classic range manipulation. Market clears the downside, entices breakout buyers at the highs, then distributes and reverses. Patience until liquidity is taken, then execution.
📌 Bias remains short after buy-side liquidity is swept.
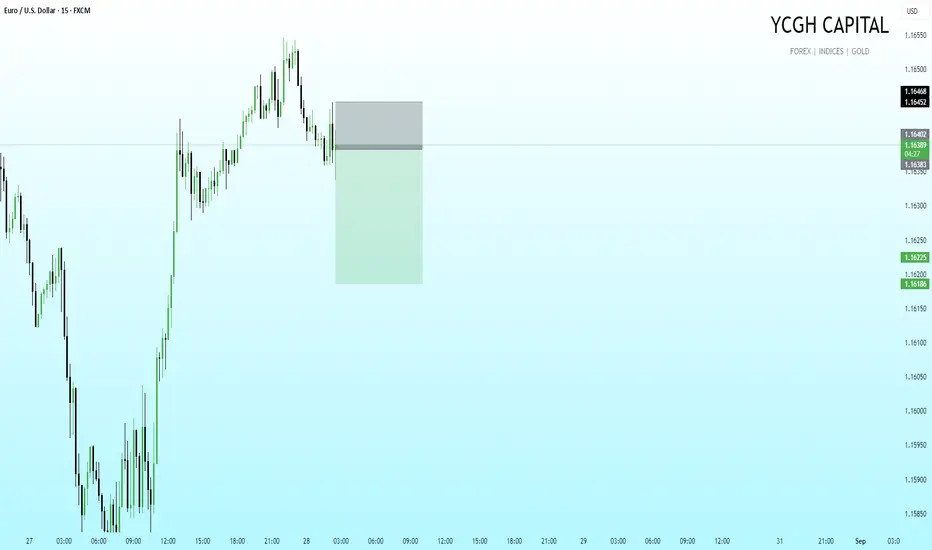
EUR/USD – Long SetupPrice swept liquidity below intraday low and tapped into demand zone. Strong bullish reaction confirms short-term reversal probability.
Entry taken on confirmation candle with tight invalidation and clear liquidity target above 1.1520.
Bias: Bullish (Scalp to Intraday)
Entry: 1.1509
SL: 1.1505
TP: 1.1519
RR: 2.5R
YCGH Capital | Precision over prediction.
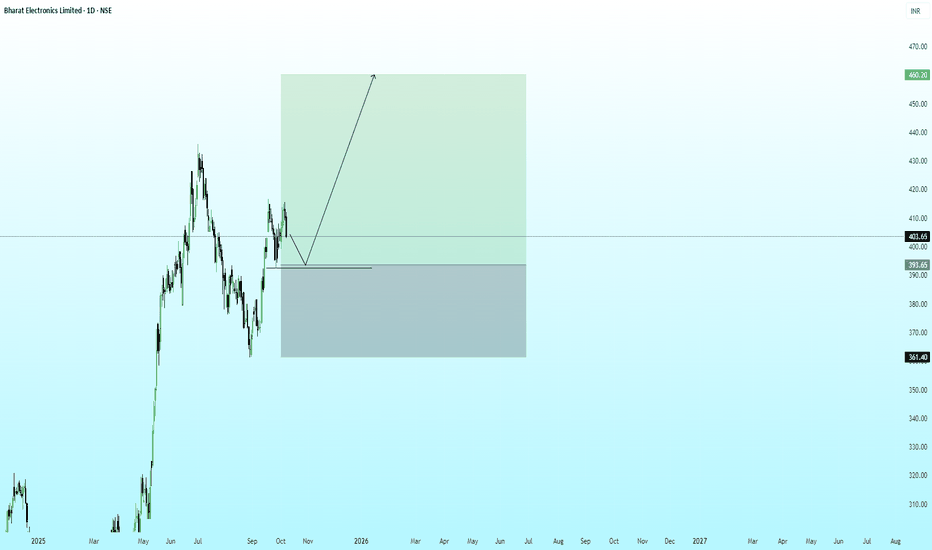
Bharat Electronics Ltd (BEL) – DailyMarket Structure:
BEL has maintained a bullish market structure on the higher timeframe, forming higher highs and higher lows. The current correction seems to be a retracement phase within that bullish leg — potentially offering a high-probability demand reaction zone.
Point of Interest (POI):
A demand zone is visible around ₹390–₹395, aligning with previous structure support and a fair value gap. Price may tap into this POI to collect liquidity before resuming bullish expansion.
Liquidity Dynamics:
Liquidity Sweep: Sell-side liquidity resting below the recent swing low (~₹395 zone).
Fair Value Gap: Present between ₹400–₹410, may act as magnet for price during continuation.
Trade Setup:
Entry Zone: ₹390–₹395 (within discount & POI).
Stop Loss: Below ₹360 (structural invalidation).
Target: ₹460+ (previous high & premium range).
Bias: 🟢 Bullish – Anticipating liquidity grab and displacement to the upside.
Confirmation: Wait for a bullish BOS and displacement candle before entry trigger.
United Breweries Ltd for Long-Term investment?Starting date 01Jul2008
First low 01jan2009 @63.05 and it is low to All-Time.
All-Time High 03Jun2024 @2,182.45
United Breweries Limited (UBL) is engaged in the business of manufacture and sale of beer and non-alcoholic beverages.
The Co markets its products under the flagship brands Kingfisher and Heineken. Some of the most popular brands in its portfolio include Kingfisher Premium, Kingfisher Ultra, Kingfisher Strong, Kingfisher Ultra Max, UB Export Lager, London Pilsner etc.
The Co has a market share of 54% in the Indian beer market as of March 2022. In FY21, the Co unlocked the African continent by foraying into seven countries: Kenya, South Sudan, Ethiopia, Tanzania, Uganda, Democratic Republic of Congo and Seychelles. With this expansion, the Co now has a strong presence in more than 50 countries, and will continue to expand into similar such potential markets in the future.
In FY21, The Co leveraged its long-standing association with ‘Sunburn’, Asia’s biggest electronic dance music festival as a platform to promote home consumption. Kingfisher sponsored ‘Sunburn@Home’ which was streamed live on Facebook and Instagram, reaching 50 Million people. The Co also got associated with IPL cricket teams via two of its best-known campaigns, the iconic ‘Divided by Teams, United by Kingfisher’ campaign and the more recently launched ‘Kya Plan Hai’ campaign.
Kingfisher Storm has extended its footprint by entering the Northern markets of Delhi & Rajasthan. Amstel International, slow brewed Beer also continued its footprint expansion in Haryana, Telangana & Maharashtra which were added to the list of Amstel markets post the gradual unlocking in FY21.
Domestic- 99%
Export- 1%
The Co’s top 2 customers accounted for 33% of its total revenue in FY22.
Market Cap 54,601Cr INR, Stock P/E 133, Current 2,065INR, ROCE 13.5 %, ROE 10.1%, Debt to equity 0.02 Company is almost debt free.
Company has been maintaining a healthy dividend payout of 68.6% , Promoter holding 70.8%, Return over 3yr 13.9%, Return over 5yr 8.55%, ROE 3yr 9.35%, ROCE 3yr 12.7%, Industry PE 31.8, Net Profit 411Cr INR
I think this company is good for long-term investment.
I WELCOME YOUR THOUGHTS. BE SURE TO SHARE YOUR THOUGHTS ON THIS.
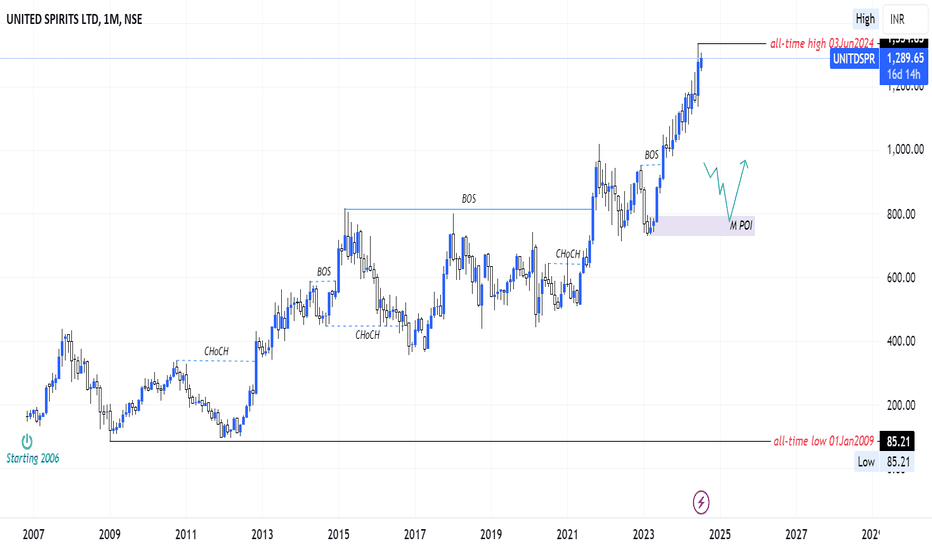
United Spirits Ltd for Long term Investment?Starting date 01Nov2006
Then after that he met his First High on 01Oct2007 @439.15
Then after that he met his First Low on 01Jan2009 @85.21 and that's an All-Time Low.
All-Time High on 03Jun2024 @1,334.85
If you are looking for an entry then it must be @796.70 - @730.95 because you can see a BOS & BOS comes with POI "MPOI" which means there will be mitigation @796.70 - @730.95 for LONG side.
Diageo India incorporated in India as United Spirits Ltd.(USL) is the country’s leading beverage alcohol company and a subsidiary of global leader Diageo PLC. The company manufactures, sells, and distributes a wide portfolio of premium brands such as Johnnie Walker, Black Dog, Black & White, VAT 69, Antiquity, Signature, Royal Challenge, McDowell’s No.1, Smirnoff and Captain Morgan.
USL has the highest market share of 25% in the Indian spirits industry It is the 2nd largest spirits company in the world. The company has ~45% market share in the Indian Whiskey market. Whiskey accounts for over 60% spirits sale in India.
USL has a comprehensive brand portfolio with more than 80 brands of Scotch whisky, IMFL whisky, brandy, rum, vodka, and gin. Out of these, 9 brands that sell more than a million cases each year, of which 1 brands sells over more than 25 million cases each annually.
The Co. has a pan India manufacturing presence with more than 37 facilities and a distribution network of 70,000 outlets.
Market Cap 93,803Cr INR, Stocks P/E 68.2, Current price 1,290INR, ROCE 27.9%, ROE 21.0%, ROE 3yr 19.6%, ROCE 3yr 24.3%, Return over 3yr 25.6%, Return over 5yr 16.7%, Promoter holding 56.7%, Debt to equity 0.04% Company is almost debt free, Industry PE 31.8, Net profit 1,408Cr INR
This Company has a very good HOLD in this industry. And so I think this company is good for long-term investment.
I WELCOME YOUR THOUGHTS. BE SURE TO SHARE YOUR THOUGHTS ON THIS.
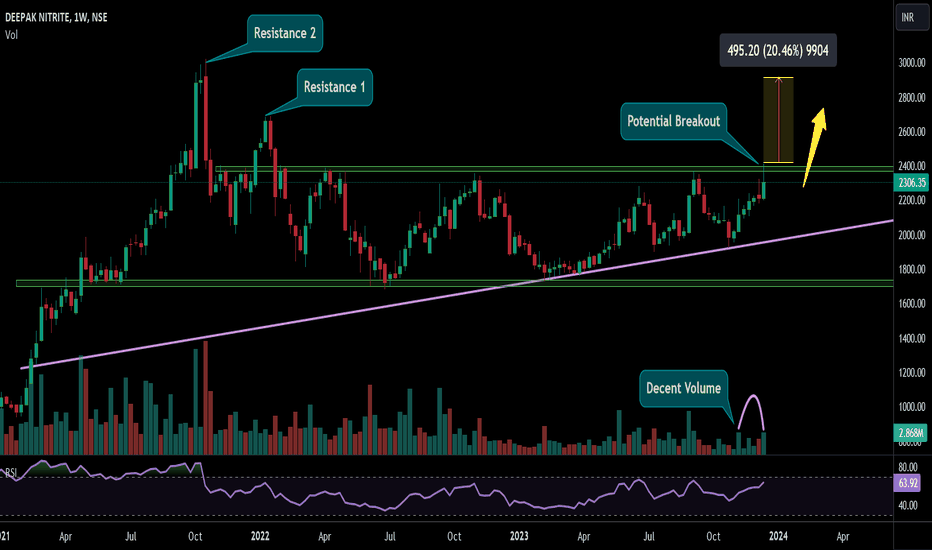
Bullish Breakout Setup - Darvas Box PatternChart displays a compelling Darvas box pattern, indicating a consolidation phase and potential breakout opportunity.
Long-range accumulation signals growing investor interest and positions being built for a potential upward move.
Key Points:
Darvas Box Pattern: Recognized consolidation pattern, suggesting a breakout in the prevailing trend direction.
Volume Analysis: Notable volume buildup near the breakout zone, with expectations of volume expansion post-breakout, indicating increasing market participation.
Resistance Levels: Anticipate potential resistance at R(1) and R(2) post-breakout; monitor how the price reacts at these levels.
Trade Idea:
Consider a long position upon confirmed breakout, ensuring sustained volume and price action support the bullish move.
Use proper risk management techniques to mitigate potential downsides.
Regularly monitor price action, especially around resistance levels, for further confirmation and adjustment of the trade.
EURUSD WEEKLY#EURUSD All time LOW at 0.90275 and that's the starting point of EURUSD candle on 01MAY2002.
#EURUSD All time HIGH at 1.60388 on 01JULY2008.
On 02NOV2009 price drops at 1.51440. After that price drops again at 1.49401 on 02MAY2011 but able to touch previous High. Again price drops at 1.39936 on 01MAY2014. Drops again at 1.2556 on 01FEB2018. As you see I Already marked POI on 26MARCH2018 and I was waiting for a mitigation and price went that direction as a magnet!
Then we saw something new after few month's price try to touch the previous high but...! Price failed to the previou high at 1.23496 on 01JAN2021 and price drop again!
I marked some Important POI
Now price is moving towards 1.12826 POI to mitigate.
When price gives as a BREAKOUT on 1.25560 level then we can see a BULL MARKET
Until then, we can expect the price should not fall down below 0.9536
CORRECT ME IF I'M WRONG!
Finnifty"Trading day, March 20th: The global market indicates a negative start, with a moderately bullish nature that may begin with a gap-down. If the market immediately takes a pullback, we can expect minor consolidation before the rally continues, and it should break the Fib level of 38%. On the other hand,. On the other hand, if the initial market declines sharply, we can expect a minor correction that will reach an immediate support level. If the market rejects this level, we can expect a pullback. However, if the market breaks that level, it could indicate a trend reversal."
WEEKLY BITCOIN WE ARE NOT...BITCOIN's all time High on 08Nov21 @69198..7
Bitcoin extreme POI is not mitigated yet!
We can see a couple of HIGHS as well if we see High in Descending order we can see the yellow colour represent the third high @32446.5
Once the Price Breakout the third high after that we can say we are in BULL MARKET!
WE ARE NOT IN BULL MARKET YET!!!
BULL TRAP!? BINANCE:BTCUSDTPERP
CORRECT ME IF I'M WRONG!
THIS IS BITCOIN TETHERUSSo as you see on 4H there's CHoCH so I created first POINT OF INTEREST { POI } for long and now waiting for Mitigation so I placed an order for long! But then we saw a rejection on 16FEB23 21:30 with big candle and small body. Next day on 17FEB23 1:30 another HUGE RED CANDLE so I have to mark POI so I mark another POI and wait for Mitigate. MITIGATION means we have to wait for the market to come in the POI price entering the box is called MITIGATION.
18FEB23 1:30 price entered the box and we can see a price consolidate.
19FEB23 13:30 placed short entry and my SL is above New HIGH which created on 16FEB23 21:30 @25250
RRR 1:3
21FEB23 13:30 we saw a rejection again! REJECTION FROM PREVIOUS HIGH!!!
CORRECT ME IF I'M WRONG!!!
THIS IS POLKADOT TETHERUS.As you see in 1H Marked first OB and placed couple of entry limit orders. I thought first OB will mitigate so I placed order for SHORT but as you see Market Always Do What He Wants To Do!
Market changed his direction and we a pullback @7.381 toward down.
Then we can see a another BOS and a good BIG BULL CANDLES. So I marked my second OB for LONG.
first RRR 1:3
second RRR 1:3
NOW WAIT FOR MITIGATION!
CORRECT ME IF I'M WRONG!!!
THIS IS HDFC BANKHDFC First High @1724.30 on 04APRIL22
HDFC Second High @1702.00 on 24JAN23
I can see three possibility.
1. Price will go up near @1702.00 and breakout! or a Rejection.
2. Market will mitigate the box and down that means SHORT.
3. MAYBE NEW HIGH BETWEEN @1724.30 & @1702.00
CORRECT ME IF I'M WRONG!!!
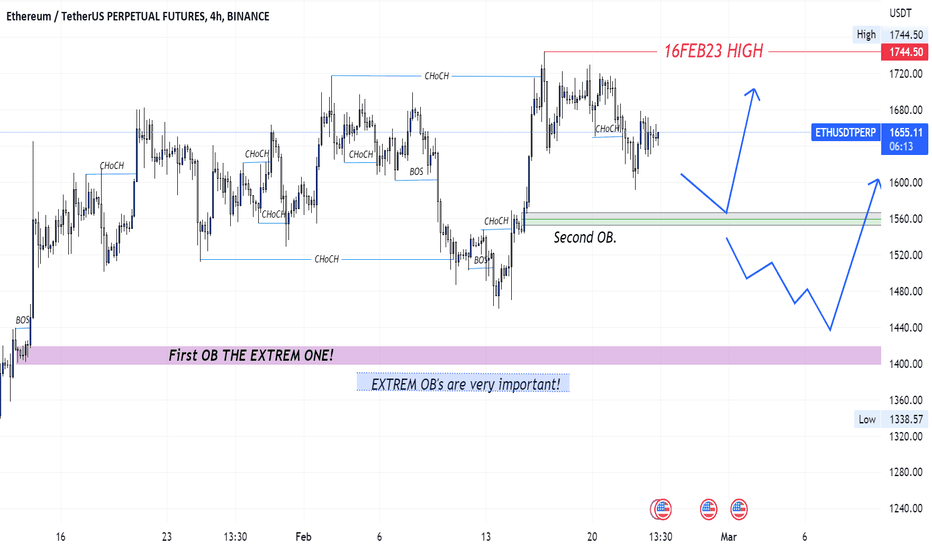
THIS IS ETHEREUM TETHERUSETHEREUM is in UP trend moving UP since 01JAN23 on 14JAN23 we can see HUGE BULL CANDLE and I found my BOS so I marked my OB first OB on 4H.
On 15FEB23 saw couple of BIG BULL CANDLE and that's my second OB.
ETHEREUM market showing BIG CANDLES with BIG WICKS!
If market break second OB and went down then what? NO WORRIES!!!
Because we have EXTREME OB already and never underestimate the Extreme OB so our first OB is UNMITIGATE since 13JAN23 once first OB mitigate we can go for LONG and we can use Trailing SL.
THIS IS LITECOIN TETHERUS.LITECOIN 4H marked POI important level for LONG.
Once market mitigate that POI then we see a clearly a LONG Opportunity.
WHY LONG? Because we already know where the price will go.
I marked 2 HIGHS on chart first @107.16 05MAY22
And we can see rejection on 16FEB23 @105.86 price couldn't touch the previous High which is @107.16
CORRECT ME IF I'M WRONG!!!