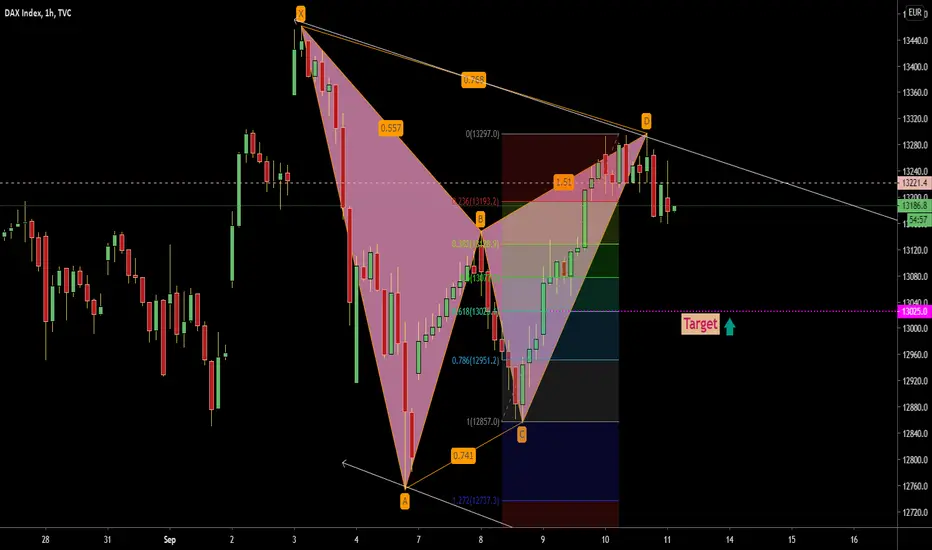
This is a perfect the "Gartley Pattern" for NIFTY.
"B" retracement of XA leg @ 61.8%
AB = CD, is at 11737
Potential Reversal Area with overlapped Terminal bar.
"D" retracement of XA leg in range of 1.27 to 1.618.
Spent 5 Day for, "B" retraced, "D" also 5 days.
This is the district the Gartley Pattern example. The price is travelling 61.8% retraceme nt area after reversal area.
Gartley
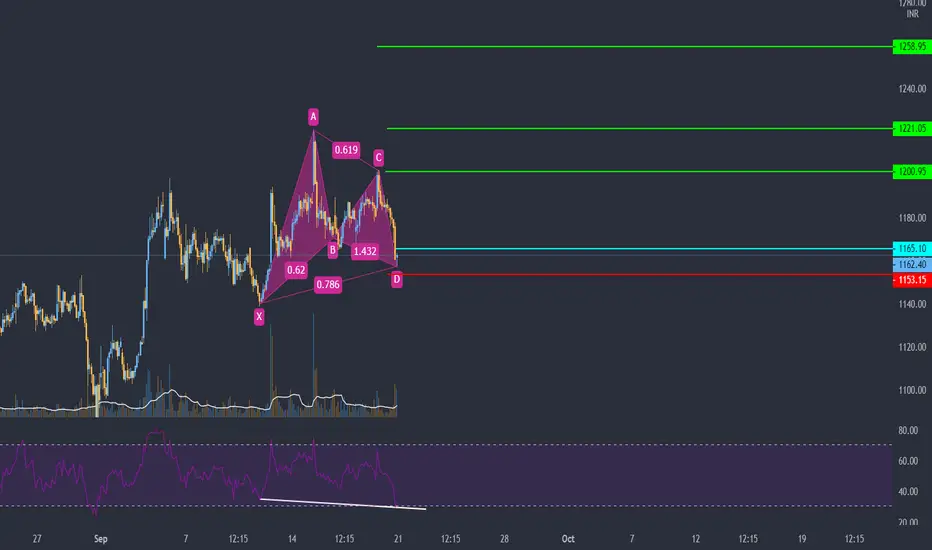
This is the the Bullish Gartley pattern (Pre-Prediction Area)This is the the Bullish Gartley pattern which was pre-predicted retracement of D point of XA retracement.
The Probability Reversal Area at 11736 (current market price 11840) which is 100 points far from now.
The overlapping of the AB=CD and this is a nice structure with ideal alignment of harmonic numbers on 15min chart. After failing this pattern will be expectation of fall.
I prefer to wait and watch for the range of Probability Reversal Area.
Nifty - Plan C (Bearish Gartley-Sell At 11975)Chart Timeframe - 15 mins
[Plan C Active - has Bearish Gartley - Target - 11870/11880 as updated this morning in yesterday's video idea published last on Nifty
Safe Traders - Avoid selling if crosses above 11975 / Risky Traders can sell until 12025 holds as top
----------------------------------------------------------------------------------------------------------------
Plan A - Sell Below 11955 for 11790-11810 target zone (Stops- 11960)
Plan B- Buy in 11790-11810 with stops below 11
L&T showing strong uptrend in coming days?Yes,it's true.
See this latest bullish fundamental report:
The National High Speed Rail Corporation Limited (NHSRCL)
on October 19 said Larsen & Toubro has emerged as the lowest bidder for the
largest segment of the Mumbai-Ahmedabad bullet train project.
And now I seen something surprisingly in the technical chart.
that is......
Cup and handle formation and bullish Gartley pattern.
1 chart pattern and 1 harmonic pattern.both bullish.
and the stock also breaked it's trend line which was acting as
Gartley pattern in SBIN-Another huge uptrend in coming days?Sbin formed Inverted head and shoulders pattern in previous sessions and showed an uptrend after it.
the stock again formed a Bullish Gartley pattern now-we are waiting for another huge uptrend even stronger
than the first uptrend which was shown with inverted head ans shoulders-the real thing is that the inverted H&S
pattern's uptrend is still pending.the picture is still incomplete :D (hindi quote) :D
It is the best entry time to buy this stock :)
Please like and comment your thoughts on this
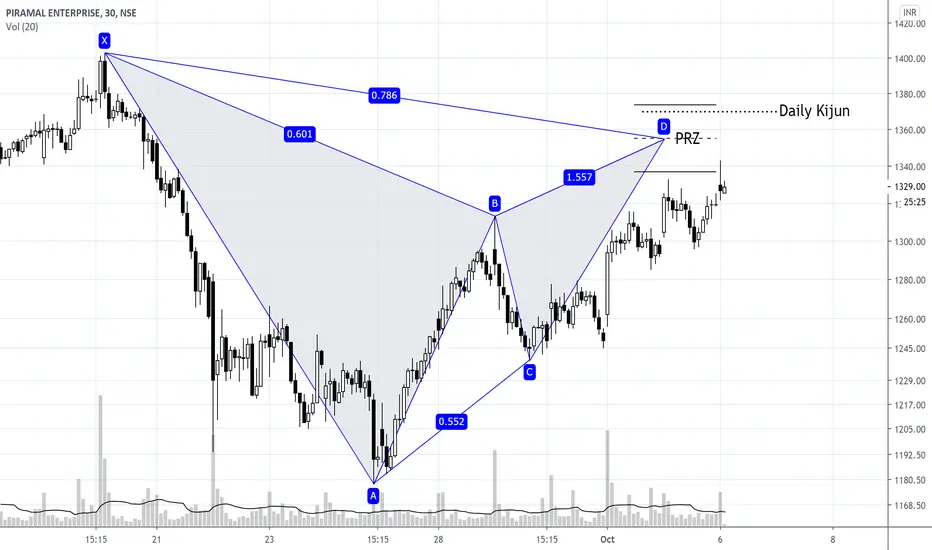
PEL - Bearish GartleyBarish Gartley observed in PEL. Also levels near daily resistance zone.
Wait for a strong terminal candle before entering.
I'll be entering (if there is confirmation candle) with a combination of put options as IV is high.
Views only for educational purposes. Do your risk assessment before entering financial positions.
PShort
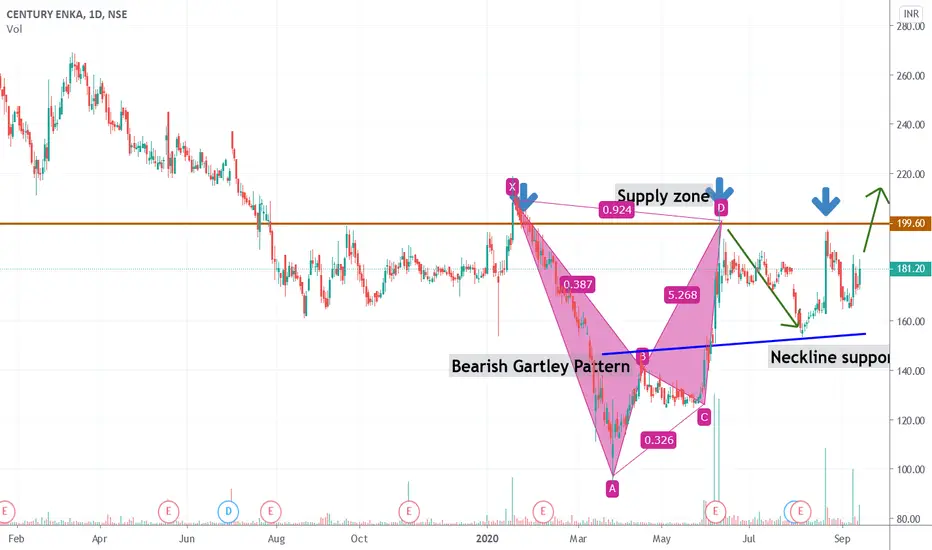
Centuryenka: Bearish Gartley pattern( XABCD)Strong supply zone near 200.
3 attempts to cross the zone have rejected sharply.
A bearish Gartley pattern has took shape in process...
Neckline of the formation is near 150s. it took support from there and now moving towards supply zone again,
We can go long till 200 and if it crosses the zone strongly , next targets would be 230.
T1: 200
T2:230
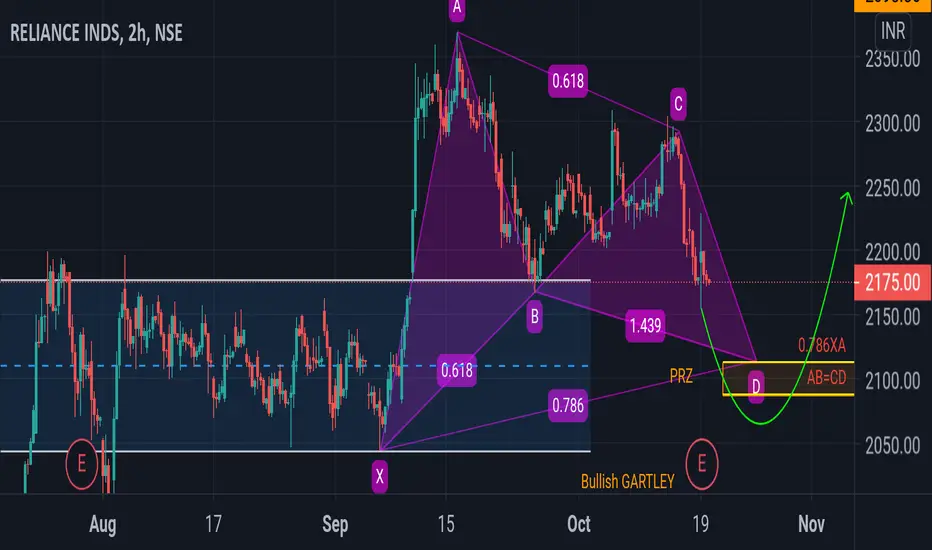
RELIANCE - 3H TF - Bullish Bat, Gartley & ButterflyBullish Bat pattern forming on 3H Chart of RELIANCE. BUY 2021-2022, SL 1999.9, Target(s) - 2040, 2050.
Bullish Gartley pattern forming on 3H Chart of RELIANCE. BUY 2041-2042, SL 2019.9, Target(s) - 2062, 2070.
Bullish Butterfly pattern forming on 3H Chart of RELIANCE. BUY 2041-2042, SL 2030.9, Target(s) - 2052, 2055.
Below 2000 -> 1980.
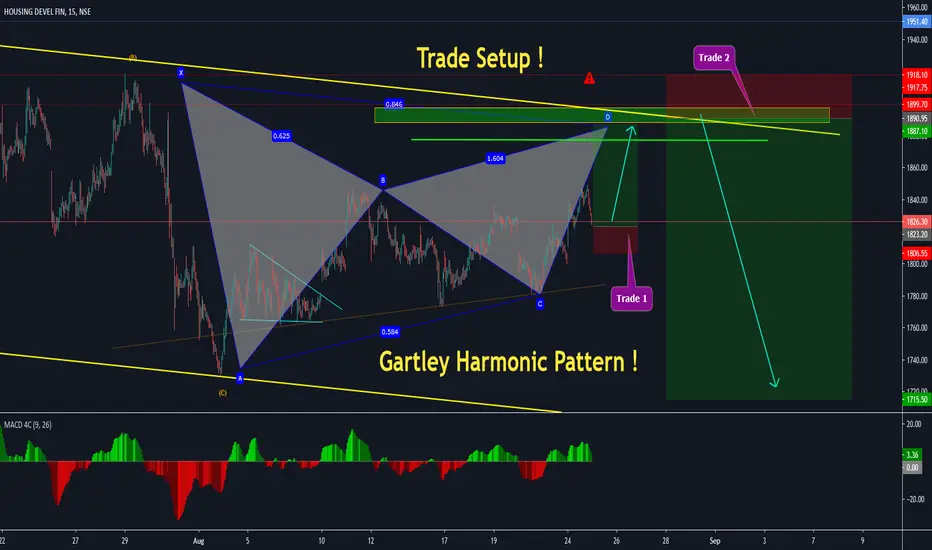
HDFC Updated Chart & Trade Setup ! DONT MISS !!TREND ANALYSIS & TRADE SETUP
GARTLEY HARMONIC PATTERN !!
Follow Chart Instruction.
Do not be Hurry for entry.
Wait for Proper Entry Setup.
Buy/Sell with Best Risk Reward.
Educational Chart Only.
August Series Option can be traded.
Wait for entry setup, if available then Long/short.
Reward is 8-10 Times
DO NOT MISS ENTRY IN AUGUST EXPIRY !
H