Short
Short
 Long
Long
Divi's Laboratories Ltd - ABCD | Bearish Harmonic Reversal Setup## **Divi's Laboratories Ltd – Daily Time Frame | Bearish Harmonic Reversal Setup**
📊 **Stock:** Divi's Laboratories Ltd (NSE)
Divi's Laboratories is trading near a **Bearish Harmonic PRZ Type 3** around **₹8,500–₹8,660**, after a strong and extended uptrend. The stock has reached the **D point** of the harmonic structure and is currently consolidating near the resistance zone, making this an important area to watch for a possible reversal or profit-booking move.
### **Technical Outlook**
* 🔻 **PRZ Type 3** identified near the D point.
* 🔻 Major resistance zone: **₹8,517–₹8,662**.
* 🔻 Price has rallied strongly from the ₹5,600 region.
* ⚠️ The stock is showing consolidation near the PRZ, so bearish confirmation is required before considering a reversal trade.
* 📉 A rejection from the PRZ could trigger a corrective move towards the lower support zones.
### **Potential Trading Plan**
* **Entry:** ₹8,500–₹8,530
* **Stop Loss:** Above ₹8,662
* **Target 1:** ₹8,090
* **Target 2:** ₹7,560
* **Target 3:** ₹7,300–₹7,500
### **Key Levels**
**Bearish PRZ / Resistance:** ₹8,517–₹8,662
**Immediate Support:** ₹8,090
**Major Support:** ₹7,560
**Demand Zone:** ₹7,300–₹7,500
### **Risk Management**
Do not initiate a short position merely because price has reached the PRZ. Wait for a **clear bearish rejection/confirmation** near ₹8,517–₹8,662. A decisive breakout and sustained close above **₹8,662** would invalidate the bearish reversal setup.
> **Conclusion:**
> Divi's Laboratories is currently trading at a **major bearish harmonic reversal zone** after a powerful upward move. The **₹8,517–₹8,662** region is the key decision area. If the stock gets rejected from this zone and bearish momentum develops, a correction towards **₹8,090**, followed by **₹7,560** and potentially the **₹7,300–₹7,500** demand zone, could be expected. Confirmation is essential before taking a reversal trade.
**Disclaimer:** This analysis is for educational purposes only and should not be considered investment advice. Always use proper position sizing, confirmation and strict risk management before taking a trade.
 Short
Short
XAUUSD 4660 exhaustion — 4525 calling? XAUUSD 4660 exhaustion — 4525 calling?
That stall under 4,660 is the warning.
Gold had the clean bullish push already. Downtrend channel broke, price exploded through the Smart Money Reload Zone, then climbed inside that bullish leg like sellers had no control.
Nice move.
But now? Different spot.
Price is sitting around 4,642, right under the Buyer Exhaustion Zone around 4,660 - 4,690. That is not a cheap buy zone anymore. That is where late buyers usually start getting tested.
The FVG around 4,655 - 4,670 is the trap area for me. If gold pushes into it and fails to hold, that can be the last bait before sellers drag price lower.
Main bias is bearish pullback while gold stays below 4,690.
The seller trigger base around 4,595 - 4,610 is the key floor. If that cracks, the move can open fast toward 4,525. That downside liquidity target is sitting clean. Too clean to ignore.
I’m not saying the full bullish trend is dead. Not yet. Bigger structure still came from a strong expansion. But short-term? Buyers look tired up here.
Trading scenario:
Sell idea only if gold rejects 4,655 - 4,690 or breaks below 4,610 with clean pressure.
Entry zone: 4,655 - 4,690 after rejection
Alternative entry: below 4,610 after breakdown confirmation
Stop loss: above 4,705
TP1: 4,610
TP2: 4,575
TP3: 4,525
No rejection, no sell. No breakdown, no chase.
If gold closes strong above 4,705, this pullback idea is cooked. Then buyers can keep pushing for new highs.
For now, I’m reading this as buyer exhaustion first, 4,525 liquidity next.
You think gold traps buyers at 4,660 before the flush?
Short 
 Long
Long
 Long
Long
Long 
CMP: 13,678 | Structure: Multi-channel bullish alignment, mid-chWhat The Chart Is Telling Us
Maruti is trading inside a stacked ascending channel structure — both the broader long-term channel (from the lows) and a tighter recent channel are pointing in the same direction: up.
After the sharp correction from the 17,370 high down to ~12,000, price found strong demand and has been building a new ascending channel with clearly defined higher lows and higher highs. The recent pullback from ~14,200 to current 13,678 is a healthy retest of the mid-channel — exactly the kind of shallow correction that precedes the next leg up.
This is a trend continuation setup, not a reversal trade. The bigger picture is intact.
The Trade Setup — Why 13,400 Is The Pivot
👉 13,400 is the make-or-break level.
It's the confluence of:
Ascending channel mid-line support
Recent swing low structure
Prior consolidation base
⚠️ Not investment advice. Levels are technical observations. Manage your own risk.  Long
Long
Short 
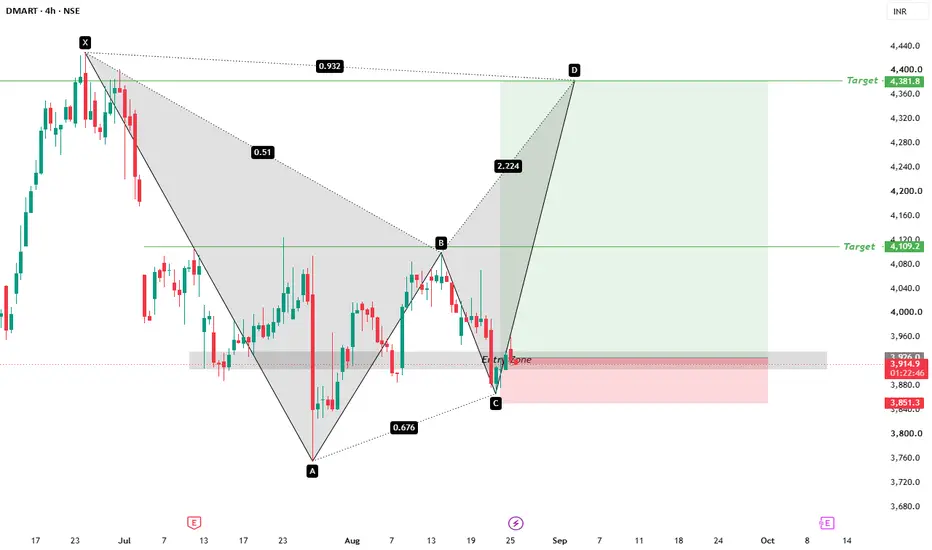
DMART 📊 DMART – Technical Analysis 📈
Current Price: ₹3,915
On the DMART 4H chart, a Bullish Harmonic Pattern is currently forming. Price is now trading near the Entry Zone, so the price reaction around this zone will be important.
🟢 BULLISH SCENARIO
Entry Zone → ₹3,900 – ₹3,930
If price takes support from this zone and gives a bullish move:
🎯 Target 1 → ₹4,110
🎯 Target 2 → ₹4,380
🛡️ Stop Loss → ₹3,850
Risk Management:
If price sustains below ₹3,850, this bullish setup will be considered invalid.
### 🎯 KEY LEVELS
🟢 Entry Zone: ₹3,900 – ₹3,940
🎯 Target 1: ₹4,110
🎯 Target 2: ₹4,380
🔴 SL: ₹3,850
👉 At the current level, trade execution should be considered only after price confirmation within the Entry Zone.
━━━━━━━━━━━━━━━
⚠️ DISCLAIMER
This post is for Educational & Informational Purposes Only. It is not a Buy/Sell Recommendation, Investment Advice, or a Guaranteed Target.
Stock Market and Trading involve Risk. Before taking any trade, make your own decision based on your Analysis, Risk Management & Capital Management.
Technical Analysis does not guarantee future results.
 Long
Long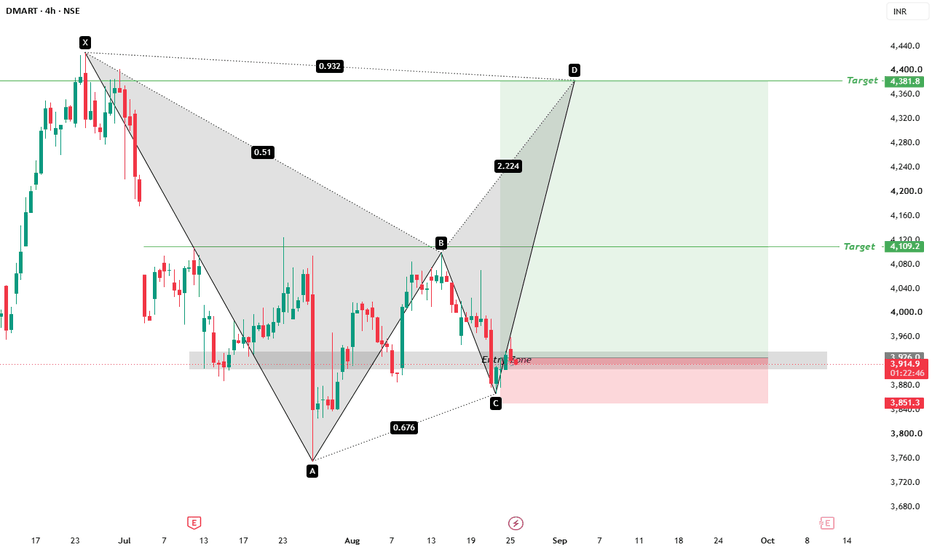
Why I Still Use Fibonacci in Market AnalysisFibonacci is one of the most debated tools in trading.
Some traders see 0.382, 0.5, and 0.618 as almost “magical” price zones. Others believe they are just numbers traders give meaning to.
In my view, both interpretations miss the point.
Fibonacci is useful not because it predicts the future, but because it helps measure the depth of a pullback and identify areas where price reaction may become important.
1. Fibonacci Is Not a Buy/Sell Button
Imagine the market is trending strongly higher and then starts to pull back.
Instead of guessing:
“Has price pulled back enough?”
Fibonacci helps divide the previous move into reference zones such as 38.2%, 50%, and 61.8%.
If price returns to 0.618, that does not mean you should automatically buy.
It simply tells me:
“This is an area worth watching. Now let’s see whether buyers actually return.”
2. Why Do Traders Watch 0.382 and 0.618?
In a strong trend, a shallow pullback near 0.382 can suggest that the side controlling the market is still aggressive.
Deeper retracements toward 0.5–0.618 may give price more room to “reset” before the trend continues.
One interesting detail: 0.5 is not actually a Fibonacci ratio , but traders still use it widely because the 50% retracement has long been important in technical analysis.
3. Fibonacci Works Best With Confluence
I rarely care about a Fibonacci level on its own.
It becomes more meaningful when it aligns with:
Support/Resistance + Market Structure + Previous Breakout Zone + Liquidity + Price Action .
For example:
Price pulls back to 0.618, reaches an old support zone, and shows a strong bullish reaction.
At that point, I am not buying because of “0.618”.
I am buying because multiple factors are telling the same story .
4. If the Anchor Points Are Wrong, Everything After That Is Wrong
This is a very common mistake.
Traders sometimes draw Fibonacci from almost any high and low until they find a level that looks “perfect”.
But Fibonacci is only useful when you identify the correct meaningful swing high and swing low for the move you are analysing.
Do not use the tool to prove what you want to see.
Use it to measure the move the market has actually created.
5. Do Not Turn 0.618 Into a Magic Number
Price may react at 0.618.
It may also break straight through it.
No ratio is strong enough to replace Stop Loss, invalidation, or risk management.
Fibonacci gives me an area to watch. Price Action decides whether there is a trade.
The Most Important Point
Leonardo Fibonacci did not invent Fibonacci Retracement for financial trading. He became famous for the number sequence popularised in Liber Abaci in the 13th century; applying related ratios to financial charts came much later.
That is why I do not see Fibonacci as a mystical forecasting tool.
I see it as a pullback measuring tool.
And when that measurement is placed correctly within trend, structure, and price reaction , it can still be extremely useful.
Do not ask: “Did price reach 0.618?”
Ask:
“If price reaches 0.618, how does the market react?”
That is the part that should drive the trading decision.
This article is for educational purposes only and does not constitute financial advice. Education 
Short 
XAUUSD/GOLD 4H SELL LIMIT PROJECTION 25.08.26This XAUUSD / Gold 4H chart is showing a Sell Limit / bearish pullback setup for 25 Aug 2026.
📉 SELL SETUP EXPLANATION
Seller Entry Zone: approximately 4,648 – 4,652
Stop Loss: around 4,666.45
Take Profit 1: around 4,622
Take Profit 2: around 4,599.34
Current Price shown: around 4,633.79
Why Sell?
1. Strong Resistance Zone – 4,652 to 4,666
Gold previously showed rejection from this upper area. The chart treats this zone as a supply/resistance area, where sellers may become active again.
2. Bearish Rejection Candle
Price pushed higher but failed to sustain above resistance and produced a strong bearish move. This indicates selling pressure from higher prices.
3. 4,652 Level is Important
The planned entry is near 4,652.17. If price retests this level and fails to break above it, it can provide another confirmation for sellers.
4. TP1 – 4,622 Support
The first downside target is the nearby support zone around 4,620–4,623. Partial profit can be considered here because buyers may react from this level.
5. TP2 – 4,599 Support
If 4,620 support breaks strongly, the next major downside target is around 4,599.34.
🎯 Expected Movement
4,648–4,652 retest → rejection → 4,622 → 4,599
The bearish setup becomes invalid if Gold breaks and sustains above 4,666–4,670. Short 
 Long
Long
 Long
Long
Long 
Long