Gold Under Pressure — Sellers Remain in ControlXAUUSD remains under short-term bearish pressure, with the post-Fed environment and H1 structure still favoring sellers.
Gold continues to face headwinds after the Fed raised rates by 25 basis points, while elevated Treasury yields and a firm dollar keep the broader environment challenging for the metal.
On H1, price remains below the descending trendline, and the latest recovery was rejected before buyers could change the bearish structure. The 4,335–4,345 area remains the key resistance.
As long as this zone holds, I favor SELL setups on rebounds, with 4,235–4,250 as the main downside area to watch.  Short
Short
INDIGO Filled GapChart Breakdown & Technical Context:
Recent Correction: INDIGO has experienced a sharp decline from its recent highs above the 5,400 level. During this fall, it sliced right through its immediate strong support (the upper shaded zone). According to the principle of polarity, this broken support is now expected to act as overhead resistance.
Current Positioning: The price is currently resting inside a crucial historical demand/support zone (the lower shaded box), trading near the 4,795 mark.
The "Gap Fill" Logic: The lowest horizontal dashed line marked on the chart (around the 4,377 level) represents a major pending gap/liquidity void. In technical analysis, unfilled gaps often act as a magnet for price. If the current support zone fails to hold, the market could drop swiftly to fill this gap.
Trading Scenarios & Action Plan:
🔴 Bearish Breakdown (Gap Fill Target):
If we see a decisive daily candle close below this lower demand box, it will signal strong bearish continuation. The immediate downside target would be the horizontal line at 4,377 to complete the gap fill.
🟢 Bullish Rejection (Relief Bounce):
Since the price is currently sitting inside a strong historical support area, we cannot rule out a bounce. If a clear bullish reversal candlestick pattern (such as a Hammer or Bullish Engulfing) forms within this zone, it could trigger a relief rally. The primary upside target would be a retest of the upper shaded box (previous support turned resistance).
Conclusion:
This is a strict "Wait and Watch" area. It is highly recommended to wait for price action confirmation—either a confirmed breakdown to play the gap fill, or a clear reversal signal to trade the bounce.
Disclaimer: This analysis is for educational purposes only and does not constitute financial advice. Always use proper risk management.  Long
Long
Is Gold Just Rebounding Before the Next Move Lower?Hello traders, if we put short-term noise aside and look at XAUUSD in a disciplined and objective way, the current picture is sending a fairly clear message: the bearish trend has not been broken yet.
Looking at the broader backdrop, pressure on gold remains as hotter-than-expected U.S. inflation has increased expectations of a Fed rate hike, while U.S. Treasury yields continue to stay elevated. This keeps the interest-rate environment unfavorable for a non-yielding asset like gold. In other words, the current rebound still lacks the fundamental catalyst needed to signal the beginning of a new uptrend.
Moving to the H4 chart, the bearish structure remains quite clear:
Price continues to trade below the descending trendline, with a consistent sequence of lower highs.
The area around 4,365 is not random: the descending trendline and the Ichimoku zone converge here, creating an important defensive area for sellers.
Recent recovery attempts have lacked follow-through, suggesting that buyers have yet to regain meaningful control.
What stands out is this: every time gold approaches the resistance area above, selling pressure returns relatively quickly. When a market repeatedly fails to break resistance despite several recovery attempts, it often signals that sellers are still controlling the structure.
📌 Highest-probability scenario:
As long as XAUUSD remains below 4,365 and the descending trendline stays intact, I expect the current rebound to face renewed selling pressure, with my main target around 4,225. Only a decisive and sustained breakout above the bearish structure would make me reassess this scenario. Short 
 Education

 Education

ONE 97 COMMUNICATIONS (PAYTM) – WAVE-3 continuationPAYTM — Swing Trade Plan; CMP: ₹1,649.5; RSI: 76
The weekly chart shows a bullish Elliott Wave structure, with the bullish cyper harmonic XABCD correction apparently completed near ₹950–1,000 and price now progressing in Wave 3. Momentum is strong, but RSI around 76 indicates the stock is stretched in the short term. The 1.272 extension at ₹1,598 has already been crossed, making ₹1,705 (1.414) the next important Fibonacci objective and ₹1,858 (1.618) the major extension.
Trade Recommendation
🟢 HOLD / BUY ON DIPS — ₹1,590–1,630
🎯 ₹1,705 → ₹1,858
🛑 SL ₹1,520
🚀 Above ₹1,705, momentum can accelerate toward ₹1,858+
Important: With RSI already overbought, do not initiate a large fresh position at ₹1,650+. A pullback toward the ₹1,590–1,630 zone offers a better risk/reward setup.
📌 Thanks a ton for checking out my idea! Hope it sparked some value for you.
🙏 Follow for more insights
👍 Boost if you found it helpful
✍️ Drop a comment with your thoughts below!  Long
Long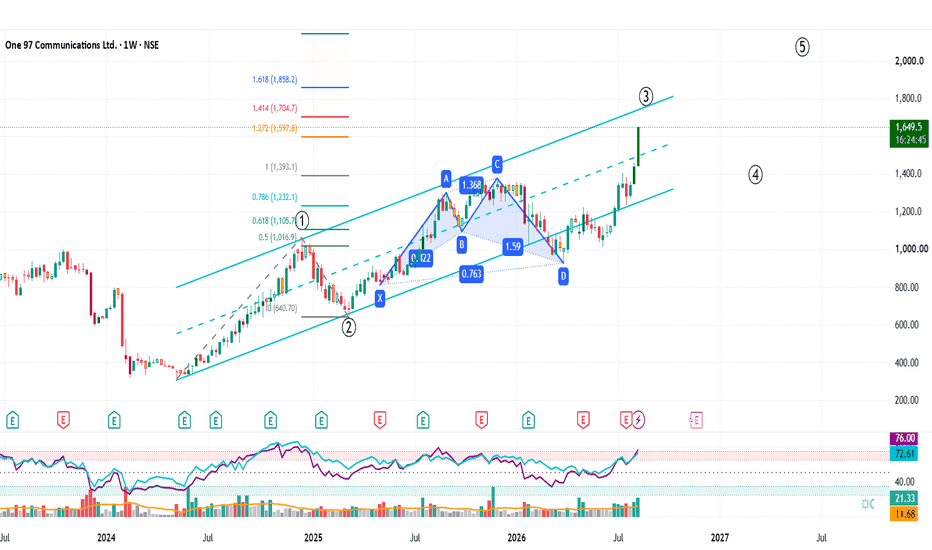
 Education

 Education

Global Financial MarketsGlobal financial markets are systems where people, companies, and governments buy and sell financial assets across the world. They help move money from those who have extra funds to those who need funds.
Main Types of Global Financial Markets:
Stock Markets – Buying and selling shares of companies (e.g., NYSE, NSE).
Bond Markets – Governments and companies borrow money by issuing bonds.
Foreign Exchange (Forex) Markets – Trading currencies like USD, EUR, INR.
Commodity Markets – Trading gold, oil, wheat, etc.
Money Markets – Short-term borrowing and lending.
Derivatives Markets – Contracts based on assets like stocks or currencies.
Importance:
Provide funds for business growth
Support international trade
Create investment opportunities
Help manage financial risks
Affect global economies
Example:
If the US stock market falls sharply, markets in Asia and Europe may also be affected because markets are connected globally.
Education

Trading Masterclass #1Institutional trading means trading like hedge funds, banks, prop firms, and professional desks. They do not trade based on emotions, random tips, or gambling. They use systems, probabilities, risk control, position sizing, discipline, and psychology.
Retail traders often lose because they focus only on “entry.” Institutions focus on:
Risk Management
Capital Protection
Position Sizing
Probability
Psychology
Consistency
Repeatable Edge
In options trading, if you think like institutions, your results can improve significantly Education

EURUSD: The Pressure Is Building — A Bigger Drop Could Be NextEURUSD is still trading with a clear bearish bias , supported by both the current macro environment and the technical structure on the H1 chart.
From a macro perspective, the U.S. dollar continues to have the advantage. Markets are pricing a high probability of a 25-basis-point Fed rate hike , while elevated U.S. Treasury yields continue to support the dollar. EURUSD has consequently remained under pressure ahead of the Fed decision. The ECB’s recent tightening provides some support for the euro, but in the short term, Fed expectations and U.S. yields remain the stronger drivers for this pair.
Technically, the picture is particularly interesting. Following the strong sell-off, EURUSD has formed what looks like a symmetrical triangle on the H1 timeframe , with price becoming increasingly compressed between descending resistance and rising support. Because this pattern is developing after a strong bearish move , I see it more as a potential continuation structure than an early signal of reversal. Price also remains below the Ichimoku Cloud, reinforcing the broader bearish trend.
The key now is the lower boundary of the triangle. If EURUSD produces a clean bearish breakout , the compression could release into another strong selling wave, with the 1.1490 area becoming the next downside target. Until price breaks above the triangle and successfully reclaims the Ichimoku resistance, I continue to favor SELL opportunities and expect the broader downtrend to remain in control . Long 
XAUUSD: Don’t Mistake This Rebound for a ReversalXAUUSD is still trading in a clear bearish trend , with both the macro backdrop and technical structure continuing to favor sellers.
From a macro perspective, gold remains under pressure as persistent U.S. inflation has strengthened expectations of tighter Fed policy , while elevated Treasury yields and a firm U.S. dollar continue to work against the metal. With the Fed decision approaching, the market remains sensitive to any signal that interest rates could stay higher for longer — an environment that remains challenging for non-yielding assets like gold.
Technically, XAUUSD continues to trade inside a descending channel on the H1 timeframe . The pattern of lower highs and lower lows remains intact, while price is still below the Ichimoku Cloud. This tells me that the recent bounce is a correction within the downtrend, not yet a reversal of it .
The 4,305–4,330 area is the key zone to watch. If price rebounds into this region but fails to break through the descending structure, sellers could regain control and push XAUUSD toward 4,205 . Until the channel is decisively broken, I remain focused on SELL opportunities during rebounds rather than trying to catch the bottom. Short 
I Turned $100 Into $10,000 — Here’s What Actually ChangedTurning $100 into $10,000 is the kind of trading story that makes everyone want to know the “secret strategy” behind it.
But if you focus only on the 100x return , you may end up learning the wrong lesson.
The real lesson isn’t how to turn $100 into $10,000 quickly. It’s what needs to change for a trader to stop relying on luck.
1. I Stopped Trying to Grow the Account Fast
Small accounts often create a dangerous mindset:
“$100 is too small. I need to risk big to make it worthwhile.”
That’s where high leverage, oversized positions, and revenge trading begin.
A few lucky trades can grow an account quickly, but the same risk management can take it back to $0 just as fast.
Fast growth does not mean you have a good system.
2. I Started Protecting Capital Before Chasing Profit
Instead of asking:
“How much can this trade make?”
I started asking:
“How much am I willing to lose if I’m wrong?”
Position size, Stop Loss, and invalidation were defined before the entry. One losing trade was no longer large enough to force me into trying to win it back on the next one.
It was a small change on the chart, but a massive change for the account.
3. I Traded Less — But Became More Selective
Before, almost every price movement looked like an opportunity.
Eventually, I understood that not trading is also a decision.
Instead of chasing ten average setups, I waited for trades that actually matched the plan: clear structure, good location, confirmation, and defined invalidation.
Trade frequency went down. Decision quality went up.
4. I Stopped Measuring Success by Account Balance Alone
Going from $100 to $200 could happen because of one extremely risky trade.
That doesn’t necessarily mean you became a better trader.
Better questions are:
Did I follow my plan?
How does my average win compare with my average loss?
Did I keep my risk consistent?
Can these results repeat across many trades?
A beautiful equity curve built on uncontrolled risk can disappear within a few trades.
What Actually Changed
It wasn’t a new indicator.
It wasn’t a secret setup.
And it certainly wasn’t always one life-changing trade.
The real shift happened when my mindset changed from:
“How do I turn a small account into a big account as fast as possible?”
to:
“How do I trade well enough to survive and keep growing?”
Turning $100 into $10,000 is an impressive result, but there is no safe or guaranteed method to achieve it. What matters more is whether the process behind that result can survive when luck is no longer on your side.
Don’t learn how to flip an account. Learn how to build a process that can survive long enough for the account to grow.
This content is for educational purposes only and does not constitute financial advice. Education 
Gold Could Explode Higher This WeekXAUUSD remains bullish within the broader market structure, as the current decline is not yet enough to confirm that gold’s larger uptrend has come to an end.
From a fundamental perspective , gold is under pressure after U.S. August CPI came in hotter than expected, increasing market expectations that the Fed could raise interest rates at this week’s meeting . This is clearly a short-term headwind for gold. However, the metal still rebounded more than 1% in the final session of last week despite the hot inflation data, suggesting that some of the Fed-related pressure may already be priced in . As gold begins to absorb negative news more effectively, the possibility of a short-term bottom is becoming increasingly noteworthy.
On the H8 timeframe, the bullish structure remains intact . XAUUSD continues to trade within the ascending channel that has been in place since June and is now pulling back toward its lower boundary. Price remains below the Ichimoku Cloud, confirming that short-term selling pressure has not disappeared. However, the broader rising channel has not been broken , so the current decline can still be viewed as a correction within a larger uptrend.
The lower boundary of the ascending channel now acts as an important support for the region . If XAUUSD holds this structure and strong buying interest begins to return, the bullish recovery scenario will gain significant strength . A gradual move back above the Ichimoku Cloud could then open the door for another leg higher, with my main target around $4,800 per ounce , as highlighted on the chart.
Overall, XAUUSD appears to be going through a technical correction within a broader bullish trend . My preferred approach for the new week is to look for BUY setups on pullbacks , patiently waiting for price-action confirmation rather than chasing the decline while the dominant structure continues to favor buyers. Long 
 Short
Short
XAUUSD – Bullish Pullback Could Set Up the Next Expansion📊 XAUUSD – Bullish Pullback Could Set Up the Next Expansion
🔍 Market Overview
XAUUSD is entering a deeper correction on the 8H timeframe after failing to maintain bullish momentum near the recent high. Although short-term selling pressure is present, the broader market structure has not yet turned bearish.
The key area to watch is 4,120–4,198. This zone represents previous structural support and also aligns closely with the ascending trendline, creating an important area of confluence. If price continues to pull back toward this region, the buyers’ reaction will determine whether the broader uptrend can continue.
📈 Market Structure Analysis
Main Trend: Bullish
Momentum: Corrective
Current Phase: Pullback → Retest → Potential Continuation
The current decline is bringing Gold back toward the area that previously provided the foundation for the last bullish expansion. More importantly, price is still trading above the broader ascending trendline.
For this reason, I do not yet view the current selling pressure as a confirmed reversal. Instead, it looks more like a return to support to test demand before the market determines its next major direction.
🚀 Trading Scenario
✅ Bullish Scenario
Key conditions:
Price pulls back toward the 4,120–4,198 support zone.
The ascending trendline remains protected.
Buyers show a clear bullish reaction or rejection from this area.
Price begins to reclaim bullish structure after the retest.
I prefer waiting for the market to complete its correction rather than chasing price at current levels. If support holds and buyers clearly return, this area could become the starting point for another bullish expansion.
🎯 Target 1: 4,615
🎯 Target 2: 4,752
❌ Invalidation Conditions
The bullish scenario would weaken if:
Price decisively breaks below the ascending trendline.
The 4,120–4,198 support zone fails.
An 8H candle closes strongly below support.
Market structure begins forming lower lows.
If this happens, the decline would no longer look like a normal pullback, and the possibility of a deeper correction would need to be considered.
📍 Key Levels
🟢 First Target: 4,615
🟢 Extended Target: 4,752
🔴 Key Support Zone: 4,120–4,198
⚠️ Trading View
My bias remains bullish, but that does not mean Gold needs to rally immediately from its current position.
The more interesting scenario is for XAUUSD to continue correcting toward support, test the ascending trendline, and then show a bullish reaction. If buyers successfully defend this area, 4,615 becomes the first upside target, followed by a potential extension toward 4,752.
The key is not trying to predict the exact bottom. It is waiting for the market to confirm that buyers are still defending support.
🧠 Expert View
The current setup is supported by:
The broader bullish structure remains intact.
The ascending trendline is still valid.
The support zone previously produced a strong reaction.
The pullback is approaching an important technical confluence area.
The structure still allows for the formation of a higher low.
Clear upside targets remain above current price.
Preferred approach: Stay patient and allow price to reach support. Avoid trying to catch the bottom without confirmation, and avoid chasing price when the location does not offer favorable risk-to-reward.
🛡️ Risk Management
Limit risk to 1–2% per trade.
Define invalidation before entering a position.
Place stops according to market structure rather than an arbitrary distance.
Do not increase position size simply because price continues falling toward support.
Wait for price-action confirmation before entering.
If support fails, respect the new structure rather than forcing the original bullish bias.
Disclaimer: This analysis is provided for educational purposes only and should not be considered financial or investment advice. Long 
Nifty Intraday Outlook for 15-09-2026📊 **NIFTY 15-Min: Gap-Up Rejected — Opening Structure Turns Weak**
NIFTY opened strongly higher but faced aggressive selling from the 23,590 area.
The first 15-minute candle produced a sharp rejection and price has now slipped below the important 23,470 level.
That shifts the immediate setup toward sell-on-rise unless buyers quickly reclaim the broken structure.
---
📌 **Important Levels**
Resistance:
• 23,520
• 23,590
Upside Targets:
• 23,590
• 23,680
• 23,790
Support:
• 23,445
Downside Targets:
• 23,400
• 23,360
• 23,230
---
📉 **Bearish Plan**
If NIFTY pulls back toward 23,472–23,500 and gets rejected:
• PE after bearish confirmation
• Prefer lower-high formation + rejection
• Targets: 23,445 / 23,420 / 23,400
Below 23,445:
• Bearish continuation
• Prefer breakdown + failed reclaim
• Targets: 23,420 / 23,40 0/ 23,362
Do not chase PE after the sharp opening fall. A pullback can provide a much cleaner setup.
---
📈 **Bullish Plan**
CE only after NIFTY reclaims and sustains above 23,475.
Targets:
• 23,500
• 23,520
• 23,550
Stronger bullish confirmation comes only above 23,590.
A bounce from the opening low alone is not enough — buyers need to reclaim the broken resistance structure.
---
🌍 **Market Context**
The expected positive opening materialized, but sellers aggressively rejected the opening strength.
Brent crude remains elevated near $107 as Middle East supply risks continue.
Higher oil, rupee pressure and elevated US bond yields remain important headwinds for Indian equities.
Markets are also focused on the Federal Reserve meeting, with expectations of a rate hike remaining high.
---
✅ **Final View**
Above 23,475 → short-covering recovery possible
Above 23,520 → recovery strengthens
Reject 23,472–23,500 → PE setup preferred
Below 23,445 → bearish continuation
Below 23,402 → downside momentum strengthens
At current levels after the opening fall → WAIT
Educational analysis only. Trade with confirmation and disciplined risk management.
XAUUSD - Bullish Continuation Setup and Further Upside Expansion🔍 Market Overview
Gold continues to maintain a positive bullish structure on the daily timeframe after recovering strongly from the 4,120–4,198 support zone. The previous rally pushed price toward higher levels, while the current correction has not yet broken the broader bullish structure.
As long as buyers continue to defend the marked support zone and the higher-low structure remains intact, the overall trend continues to favor further upside expansion in XAUUSD.
📈 Market Structure Analysis
Market Trend: Bullish
Momentum: Corrective / Consolidating
Current Phase: Bullish Continuation
The price structure shows that Gold broke away from the lower consolidation area with strong bullish momentum. The recent decline is bringing price lower, but for now, it still appears to be a pullback within the broader uptrend rather than a confirmed bearish reversal.
Price remaining comfortably above the main support zone suggests that buyers still have the advantage. A clear bullish reaction from the current structure could trigger the next upside expansion.
🚀 Trading Scenario
✅ Bullish Scenario
Main trend conditions:
Price continues to hold above the 4,120–4,198 support zone.
The higher-low structure remains intact.
Selling pressure begins to weaken during the correction.
Price regains bullish momentum after the pullback.
Trading Plan:
Look for buying opportunities after a confirmed bullish reaction rather than chasing price while the correction is still developing. A recovery of the short-term bullish structure would provide stronger confirmation for trend continuation.
🎯 Target 1: 4,612
🎯 Target 2: 4,755
❌ Bullish Invalidation Conditions
Price decisively breaks below the main support zone.
A daily candle closes strongly below 4,120.
Market structure begins forming lower lows.
The correction develops into a strong bearish expansion.
A confirmed breakdown below the support zone would significantly weaken the current bullish setup and could open the door for a deeper correction.
🎯 Key Support Zone: 4,120–4,198
📍 Key Levels to Watch
🟢 Nearest Resistance: 4,612
🟢 Main Target: 4,755
🔴 Nearest Support: 4,198
🔴 Key Support: 4,120
⚠️ Trading View
The overall structure remains bullish while XAUUSD holds above the key demand zone. The current decline may simply represent a corrective and reaccumulation phase before buyers attempt to regain control.
If price stabilizes and bullish momentum returns, 4,612 becomes the first upside target. A convincing breakout above this area could extend the move toward 4,755.
However, losing the 4,120–4,198 support zone would materially change the structure and require a reassessment of the bullish scenario.
🧠 Expert View
The current setup is supported by:
Strong recovery from the main support zone.
The higher-timeframe bullish structure remains intact.
Price has not returned below the previous breakout area.
The current decline still has the characteristics of a pullback.
The potential for another higher low remains intact.
Clear upside targets at 4,612 and 4,755.
Preferred approach: Avoid trying to catch the exact bottom and avoid chasing price. Wait for the market to show that buyers are genuinely returning before considering positions in the direction of the broader trend.
🛡️ Risk Management
Risk only 1–2% of trading capital per position.
Define the invalidation level before entering.
Place stop losses according to the relevant support structure.
Do not increase position size simply because price continues to correct.
Wait for price-action confirmation rather than relying purely on prediction.
If the support structure fails, respect the market signal and reassess the bias.
Disclaimer: This analysis is provided for educational purposes and to share a market perspective only. It should not be considered financial or investment advice. Long 
XAUUSD | 4H BUY PROJECTION 15 September 2026
Gold has recovered from the lower boundary of the parallel downtrend channel, presenting a potential countertrend recovery setup.
🔎 PATTERNS & CONFIRMATION
“BULLISH ENGULFING FORMED” — marked on the chart near the lower-channel bounce.
“MORNING STAR PATTERN TO BE EXPECTED HERE” — anticipated near the entry zone; confirmation is still pending.
“NEED TO CLOSE ABOVE HERE FOR VALIDATION OF SETUP” — a completed 4H candle close above approximately 4,311 is required, followed by a retest that holds support.
📍 BUY LIMIT ENTRY ZONE: 4,300–4,304
🛑 DRAWN STOP LEVEL: Approximately 4,282
🎯 RESISTANCE / POTENTIAL TARGETS
R1: 4,317–4,321
R2: 4,355–4,359
R3: 4,375–4,379
🟣 SUPPORT LEVELS
S1: 4,300–4,304
S2: 4,282–4,286
📉 PARALLEL DOWNTREND LINE
The broader channel remains bearish. Its upper boundary may interrupt the recovery before R3.
⚠️ Setup confirmation is pending in this snapshot. All levels are approximate Long 


