How To Understad Option?Institutional Option Trading (7 Key Points):
Smart Money Activity – Institutions like banks, hedge funds, and FIIs trade options with large capital, creating strong directional moves in the market.
Option Chain Analysis – They focus on OI buildup, unwinding, and PCR to identify accumulation/distribution zones.
Liquidity Zones – Institutions trade where liquidity is high (ITM/ATM strikes), ensuring easy entry and exit without slippage.
Hedging Strategies – Use advanced strategies like spreads, straddles, and strangles to manage risk instead of naked positions.
Volatility Play (VIX Focus) – Institutional traders trade based on implied volatility expansion and contraction, not just price direction.
Support & Resistance Creation – Major OI levels act as strong support/resistance due to institutional positioning.
Harmonic Patterns
BTCUSD 30M Short Setup – Rejection at Resistance
TradingView_Screenshot_1779292811959.jpg
Provide me description for tradingview idea
BTCUSD 30M Short Setup – Rejection at Resistance
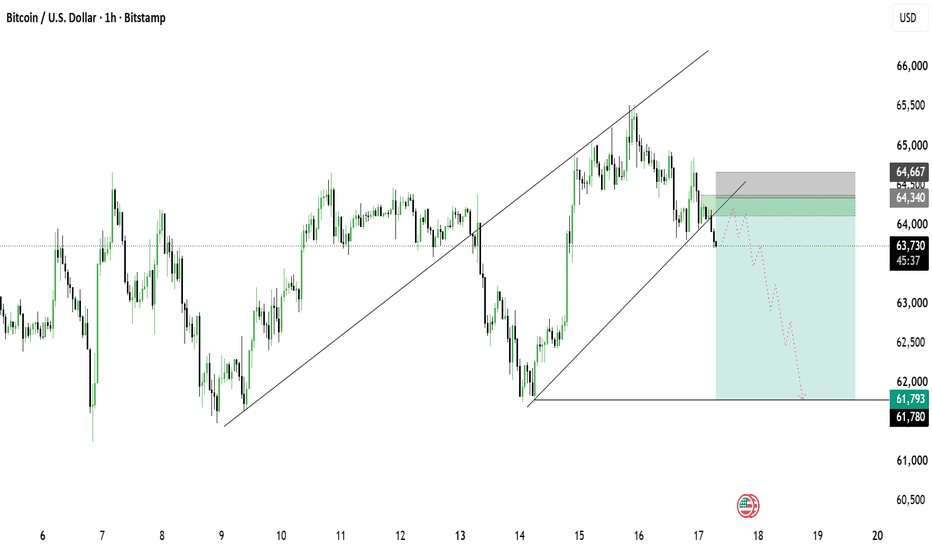
Watching Bitcoin reject the 77.5K resistance zone after multiple failed attempts to break higher. Price formed a bearish reaction candle with declining momentum, while volume suggests sellers are stepping in near local highs.
📍 Entry: 77,394
🎯 Target: 75,318
🛑 Stop Loss: 77,818
This setup offers a strong risk-to-reward ratio as long as price remains below the intraday resistance area. A breakdown below short-term support could accelerate bearish momentum toward the 75.3K region.
Key observations:
Rejection wick near resistance
Weak bullish continuation
Short-term bearish structure forming
Favorable RR setup
NIFTY- Intraday Levels :- 21st May 2026 NIFTY sustain above 23700 above this bullish then 23814/31/46/52/67 above this more bullish above this wait more levels marked on chart.
If NIFTY sustain below 23668 then 23556/40 below this bearish then 23497/67 below this more bearish below this wait more levels marked on chart
My view :-
"My viewpoint, offered purely for analytical consideration, The trading thesis is: Nifty (bullish tactical approach: buy on dip) however, watch for news. as per the levels I see both side movements possibility.
This analysis is highly speculative and is not guaranteed to be accurate; therefore, the implementation of stringent risk controls is non-negotiable for mitigating trade risk."
Consider some buffer points in above levels.
Please do your due diligence before trading or investment.
**Disclaimer -
I am not a SEBI registered analyst or advisor. I does not represent or endorse the accuracy or reliability of any information, conversation, or content. Stock trading is inherently risky and the users agree to assume complete and full responsibility for the outcomes of all trading decisions that they make, including but not limited to loss of capital. None of these communications should be construed as an offer to buy or sell securities, nor advice to do so. The users understands and acknowledges that there is a very high risk involved in trading securities. By using this information, the user agrees that use of this information is entirely at their own risk.
Thank you.
Technical Analysis VS. Institutional Option Trading part - 5Positional trading involves holding trades for weeks to months.
Features:
Based on macro trends
Combines technical + fundamental analysis
Lower stress compared to intraday
Scalping
Scalping is ultra-short-term trading where traders make multiple trades in minutes.
Features:
Small profit targets
High frequency
Requires precision
Ideal For:
Advanced traders with fast execution.
Options trading is a type of derivative trading where contracts derive value from an underlying asset like stocks or indices.
An option gives the buyer the right (not obligation) to buy or sell an asset at a specific price before a certain date.
Technical Analysis VS. Institutional Option Trading part - 2.0Trading is the process of buying and selling financial instruments such as stocks, commodities, currencies, or derivatives with the objective of generating profit. Unlike long-term investing, trading focuses more on price movements over shorter timeframes.
Key Objectives of Trading:
Capital appreciation
Hedging risk
Generating regular income
Leveraging market volatility
Trading operates on the principle of demand and supply, where price fluctuates based on market participants’ actions.
Trading is the backbone of modern financial markets, allowing individuals and institutions to participate in wealth creation, risk management, and price discovery. In today’s digital era, trading has evolved from traditional floor-based systems to advanced algorithmic and data-driven environments. This comprehensive guide will help you understand options and all major types of trading in a structured, professional manner.
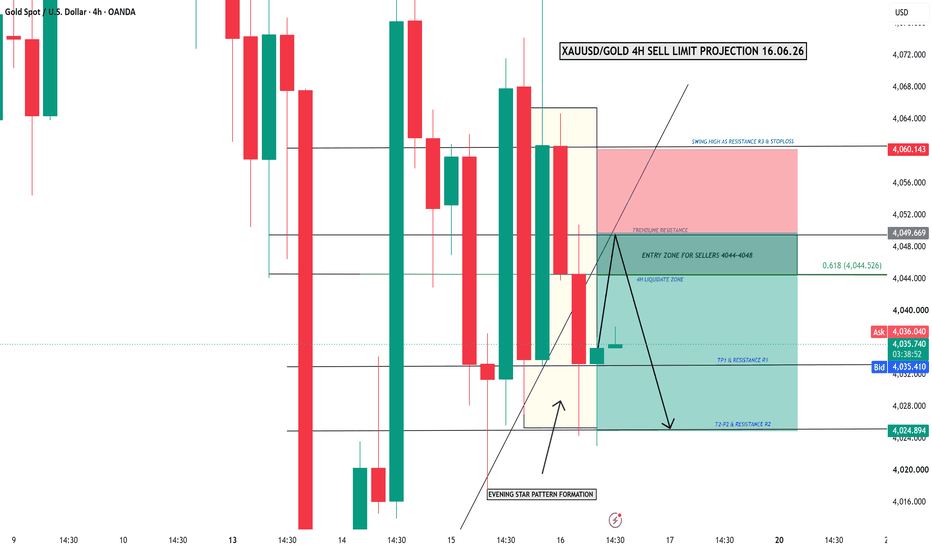
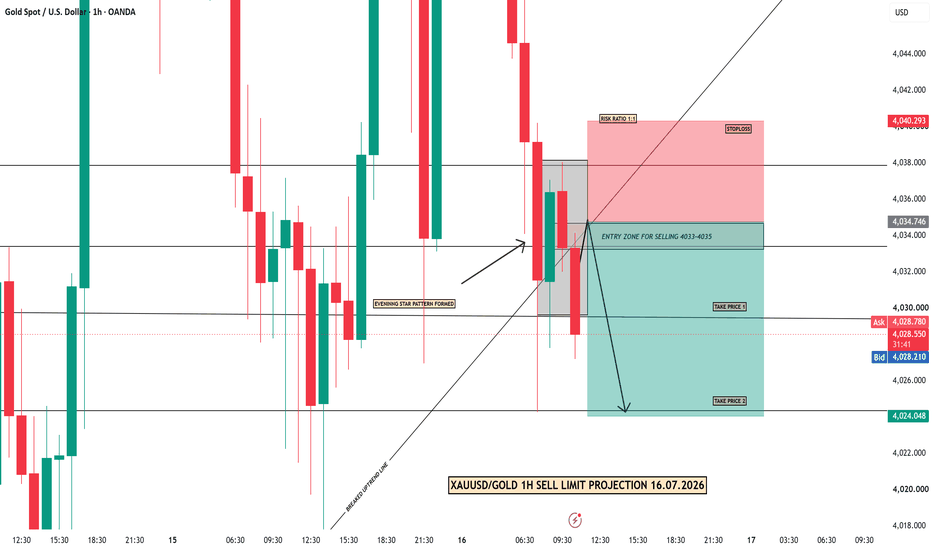
XAUUSD/GOLD 1H SELL PROJECTION 20.05.26The 1-hour chart on XAUUSD currently shows a bearish setup forming inside a clear sloping downtrend structure. Price recently moved upward and collected liquidity near the resistance zone around 4489–4505, where strong rejection is expected. The market is also forming a triangle pattern, and after the breakout retest, sellers appear to be gaining control again. The highlighted sell entry zone near Resistance R1 indicates an area where institutional liquidity may have been collected before a potential downward move.
The stochastic indicator is already in the overbought region, signaling weakening bullish momentum and possible selling pressure. At the same time, RSI remains below the 50 level on the 1H timeframe, confirming that the overall trend is still bearish. As long as price stays below the major resistance and stop-loss zone around 4505, the probability favors continuation toward the downside targets.
USD/CHF Continues Its UptrendUSD/CHF continued its uptrend for the second consecutive day, successfully climbing past the psychological 0.7900 level and retesting a three-week high at the start of the European session.
This strengthening was driven by the strength of the US Dollar (USD), which remained near a six-week high (DXY), although buyers began to show a wait-and-see attitude ahead of the release of the Fed's key documents tonight.
--------------------------------------------------------------------------------------
✅ Fundamental Dynamics: A Push and Push for Hedging Assets
Macroeconomic and geopolitical factors continue to provide a strong foundation for the Greenback:
- ⚡Hawkish Fed Sentiment: Comments from Fed officials (such as Anna Paulson) and a surge in bets on a 2026 rate hike above 55% continue to support US bond yields. Expectations that the Fed will release closely-watched meeting minutes tonight have made the low-yielding Swiss Franc (CHF) lose its appeal.
- ⚡Middle East Geopolitics: Physical tensions following the drone attack on the Barakah Nuclear Power Plant (UAE) and Donald Trump's military bluster ("one hour to the attack") are keeping oil prices high.
--------------------------------------------------------------------------------------
✅ Key Levels to Watch
- ⚡Key Resistance (0.7956): Prices must close above this level on a sustained basis to shift the long-term bias of USD/CHF from bearish to purely bullish.
- ⚡Nearest Support (0.7902): The 50% Fibonacci level. This floor must be held during the New York session to maintain daily bullish momentum.
- ⚡Inside Cushion (0.7868): The 38.2% Fibonacci level. This area will be tested if the release of the FOMC Minutes tonight is surprisingly dovish.
PRESTIGE (Prestige Estates) – Pre-Earnings SetupPrestige Estates Projects Limited (NSE: PRESTIGE) is currently showing an aggressive intraday recovery, trading up at 1,385.30 (+0.60%) after bouncing sharply from its session low of 1,340.60.
The stock has been undergoing a healthy correction over the last few months, dropping roughly 24% from its 52-week highs. However, it is now entering a high-volume accumulation zone supported by massive fundamental tailwinds. The company recently hit a major milestone, crossing ₹30,024 crore in pre-sales for FY26 (a massive 76% YoY surge), driven by a blockbuster response to its Prestige Golden Grove project in Hyderabad and aggressive land acquisitions in Gurugram, Mumbai, and Chennai
With the crucial Q4 FY26 Board Meeting scheduled for tomorrow, May 21, 2026, to declare audited results and final dividends, the risk-to-reward ratio for a long setup right here is exceptionally compelling
The Trade Setup
Strategy: Swing Long (Buy on Dips / Breakout Confirmation)
🎯 Entry Range: 1,365.00 – 1,386.00 (or on a confirmed daily close above 1,390.00)
Key Targets:
Target 1: 1,497.35 (Immediate structural resistance & psychological milestone)
Target 2: 1,566.50 (Mid-term supply zone)
Target 3: 1,657.10 (Major breakout extension target)
Risk Management:
Stop Loss (SL): 1,315.00 on a daily closing basis
Disclaimer: aliceblueonline.com/legal-documentation/disclaimer/
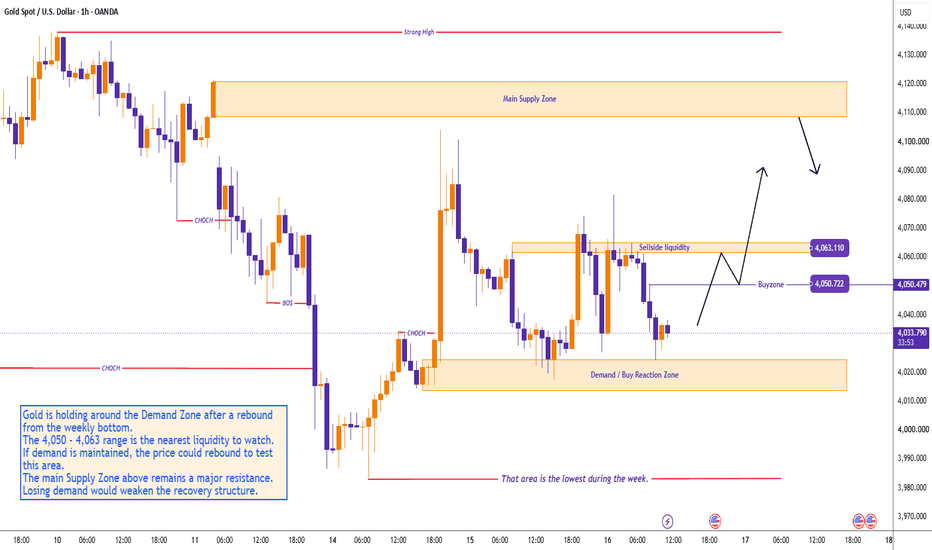
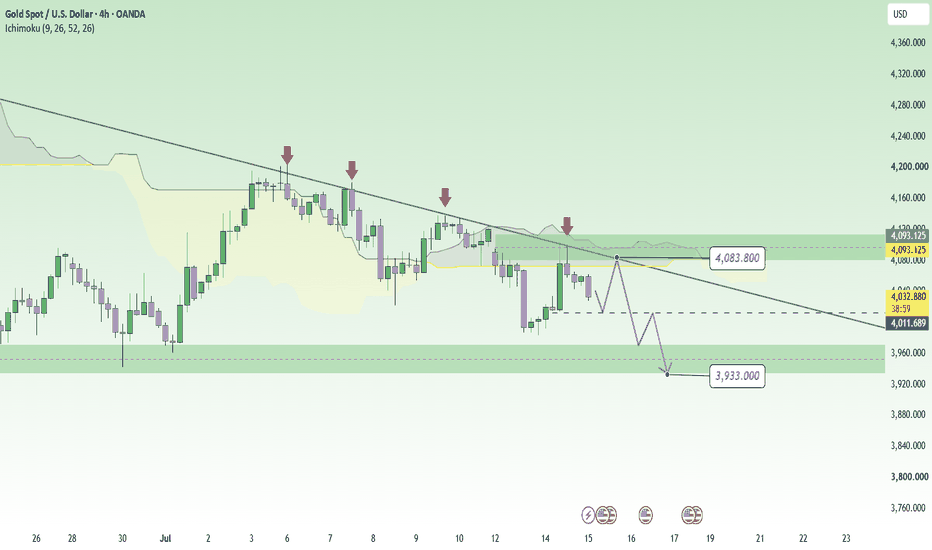
Gold Continues to Experience Bearish PressureGold (XAU/USD) prices held near a seven-week low of $4,470 during today's Asian session.
The US dollar's (USD) dominance, perched near a six-week high, fueled by Donald Trump's "One Hour to Attack" rhetoric and hawkish signals from internal Fed officials, continues to lock the precious metal in a strong downtrend.
------------------------------------------------------------------
✅ Geopolitics: Trump's "One Hour to War" Bluff
Despite behind-the-scenes diplomatic efforts, the physical military threat remains real:
- Trump's Ultimatum: President Donald Trump revealed he was just one hour away from ordering a full-scale military strike on Iran, before ultimately delaying it at the urging of Gulf leaders.
- Vance's Optimism vs. Market Skepticism: Vice President JD Vance attempted to ease tensions by citing "major progress" in the negotiations.
------------------------------------------------------------------
✅ Macroeconomics: Fed Members Hint at Interest Rate Hike
The US Dollar's fundamental foundation is solidifying due to shifting monetary expectations:
- Anna Paulson Statement: Philadelphia Fed President Anna Paulson publicly stated that another interest rate hike would be appropriate if economic growth exceeds potential or if the threat of inflation from the energy sector re-emerges.
- FedWatch Surge: According to the CME FedWatch Tool, the probability that the US central bank will raise borrowing costs in 2026 has now officially risen above 55%.
- Yield Pressure: The combination of high oil prices and Paulson's hawkish outlook has triggered a sharp spike in US Treasury yields. This has automatically dampened the appeal of gold, which does not provide a daily yield.
------------------------------------------------------------------
🎯Key Levels to Watch🎯
- Nearest Support ($4,450 - $4,470): The multi-week low currently being tested. If this level fails to hold the price at the close of tonight's New York session, the decline will continue.
- Macro Resistance Line ($4,363.73): The 200-day SMA. This is a primary target for bears. As long as gold is able to hold above this long-term moving average, the macro (long-term) uptrend is technically intact, and the price will enter a major consolidation phase in this area.
- Capitulation Scenario (Below $4,363): A decisive break below the 200-day SMA would shift gold's long-term bias to bearish and open the door to a much deeper correction towards the $4,200 area.
Trading in Intraday AnalysisOption Chain Analysis: Decoding Open Interest (OI) to find where the "Big Players" are positioned.
FII/DII Data: Understanding institutional activity and its impact on market direction.
Intraday Strategies: Scalping and swing setups using Price Action and key EMAs.
Global Market Cues: How GIFT Nifty and US Markets might influence our opening.
Trading Option Analysis With Education and Logic Part-1ICICI Bank
Support
₹1240–₹1230 → First support area where buyers may enter
₹1200 → Strong support for positional view
If the stock breaks below ₹1220, then selling pressure can increase for some time.
Resistance
₹1275 → Immediate resistance
₹1300 → Main breakout level
A strong close above ₹1300 can push the stock toward ₹1320–₹1350 in the upcoming weeks.
Trading Oversold MarketsWhat is overbought?
When the market goes up too much, too fast — like it got overexcited. RSI crosses above 70. This means most people who wanted to buy have already bought. Not many buyers left. So the market will likely slow down or fall a bit.
What you do: don't buy now. If you're already in profit, book some of it. Keep your stop loss tight.
What is oversold?
When the market falls too much, too fast — like everyone panicked and sold everything. RSI drops below 30. Most of the panic selling is already done. So a bounce or recovery is likely coming.
What you do: don't rush in all at once. Wait for one green candle or a volume pickup as confirmation. Then buy in small parts.
Trading Option Analysis With Education and Logic Part-1TATASTEEL
Immediate Support: ₹162 – ₹158
Major Support Zone: ₹152 – ₹148
Immediate Resistance: ₹170 – ₹174
Strong Breakout Zone: ₹178+
Market Structure
As long as the stock holds above ₹158, bullish sentiment may continue.
Sustaining above ₹170 can trigger fresh upside momentum toward ₹178–₹185.
If ₹158 breaks with volume, short-term weakness toward ₹152 can appear.
Rate Hike Expectations Pressurise Gold TrendRight now market is affected by strong US dollar, which stops gold price from going up. Expectations of interest rate cut have come down, overall market situation is negative for gold. In short term, follow trend and do selling on rise only.
Market condition is weak, upward bounce is very less, heavy resistance seen on upper side. Buyers don’t have enough power to push price high, immediate strong uptrend not possible soon. Main resistance zone 4580 to 4600, price easily falls down after touching this level. Major support zone 4530 to 4500, this is recent low range. If this support breaks, price will drop more, if holds then price will move side ways only.
Short term plan: Sell at 4580–4600
Stop loss place above 4610
Target price 4530-4500
NIFTY- Intraday Levels :- 20th May 2026 NIFTY sustain above 23638/53 then 23668/84/700 above this bullish then 23768/792/816 then 23837/52/67 above this more bullish then 24043/58/73 or 24103/23/43 above this wait more levels marked on chart.
If NIFTY sustain below 23602 then 23588/71/58/48 below this bearish then around 23412 below this wait more levels marked on chart
My view :-
"My viewpoint, offered purely for analytical consideration, The trading thesis is: Nifty ( bullish tactical approach: buy on dip)
This analysis is highly speculative and is not guaranteed to be accurate; therefore, the implementation of stringent risk controls is non-negotiable for mitigating trade risk."
Consider some buffer points in above levels.
Please do your due diligence before trading or investment.
**Disclaimer -
I am not a SEBI registered analyst or advisor. I does not represent or endorse the accuracy or reliability of any information, conversation, or content. Stock trading is inherently risky and the users agree to assume complete and full responsibility for the outcomes of all trading decisions that they make, including but not limited to loss of capital. None of these communications should be construed as an offer to buy or sell securities, nor advice to do so. The users understands and acknowledges that there is a very high risk involved in trading securities. By using this information, the user agrees that use of this information is entirely at their own risk.
Thank you.
DXY Has Potential to Strengthen in the Short TermAround the current price (99,251), price movement has begun to slow and is stuck within the Major Demand Zone.
Although sellers exerted pressure, the emergence of a lower wick in this series of consolidation candlesticks indicates accumulation or initial buying interest attempting to prevent a further decline in the DXY.
The impulsive decline from the premium level above is considered the completion of a long Wave 3 expansion or the final stages of completing Wave 5 within the microcycle.
Because the price has entered the area of major lower demand and is approaching the psychological level of 99,000, this bearish momentum is vulnerable to selling exhaustion.
The market has high potential to enter a Corrective Wave phase (Upward Correction) to ease the oversold indicator before determining the direction of the major trend.
Gold Weakens as Trump's Rhetoric Cuts Short-Term RallyGold prices (XAU/USD) have again attracted significant selling pressure after attempting to recover to the $4,590 level during today's Asian session.
Investors' tactical moves, skeptical of the apparent de-escalation in the Middle East, combined with a strengthening US dollar (USD) supported by a hawkish monetary outlook, have cut short the rebound from the April-May low of $4,480.
----------------------------------------------------------------
✅ Geopolitics: "Qatar Pause" vs. Pezeshkian Defensiveness
Mixed signals from the Washington-Tehran axis are keeping the market cautious:
- ⚡Trump Strike Delay: President Donald Trump confirmed that he was postponing a planned military strike against Iran at the diplomatic request of Qatar, Saudi Arabia, and the UAE. However, Trump emphasized that negotiations are not underway and that he has instructed the US military to remain at "full strike readiness."
- ⚡Iranian Assertiveness: President Masoud Pezeshkian responded to Trump's ultimatum by asserting that Tehran will not bow to any power and will engage in dialogue based on the dignity and preservation of the nation's rights.
- ⚡Support for the DXY: This mutual intimidation keeps the geopolitical risk premium high. Investors prefer to hoard the liquid USD reserve currency over bullion, limiting the commodity rally.
----------------------------------------------------------------
✅ Monetary: 2026 Interest Cut Speculation Officially "Extinct"
From a macroeconomic fundamental perspective, the foundation for US Dollar strength is increasingly solid:
- ⚡December Rate Hike Bets: The market has now completely ruled out the chance of a Federal Reserve rate cut for the remainder of 2026. Conversely, based on the CME FedWatch Tool, the probability of a 25 basis point of view rate hike at the December meeting is stable at around 40%.
- ⚡Bond Yield Pressure: Concerns about structural inflation due to energy costs and US fiscal issues keep the yield on long-dated US Treasury bonds (30-year) near its highest level since 2023. This high yield mechanically suppresses the appeal of gold, which does not provide a daily yield.
----------------------------------------------------------------
🛠️ XAU/USD Technical Analysis (Intraday)
Technically, the price rejection near $4,590 confirms that market control remains under the bearish shadow:
- ⚡Least Resistance Path: Down. Failure to hold the $4,590 level indicates that any intraday price recovery will be viewed by institutions as a supply zone to open new short positions (fade the rally).
- ⚡Immediate Support ($4,520 - $4,530): This area serves as a daily defensive line before the price potentially retests the structural floor at $4,480.
- ⚡Key Resistance ($4,590 - $4,600): Gold needs a daily close above the psychological $4,600 level to break this short-term bearish bias.
COFORGE "BEST BUTTERFLY PATTERN" WEEKLYCOFORGE Weekly: Strong Bullish Reversal from Harmonic PRZ + 200 MA Support
The Chart Description / Caption
Technical Observations:
Harmonic Structure: A precise XABCD harmonic pattern has completed on the weekly time frame. The stock found major buying interest right at the completion of the 'D' leg near the ₹1,000–₹1,200 support band.
Moving Average Confluence: This bottoming out nicely aligns with a multi-year 200 Moving Average (MA) on the weekly chart, adding strong historical confluence to this structural support.
Price Action: We are seeing an initial sharp bounce (rising to around ₹1,414.90, up over 10% on the weekly bar shown) confirming that the demand zone is holding firm.
Key Levels to Watch:
Support / Stop Loss (SL): Strong structural support remains just below point D (around the ₹1,000 psych level).
Immediate Targets: Point B (around ₹1,400–₹1,450) acts as the immediate structural hurdle, followed by a potential shift toward the ₹1,600 and ₹1,800 zones (points C and A) if momentum sustains.
THIS IS NOT MY BUY/SELL CALL IT IS JUST TO TAKE ATTENTION ON.