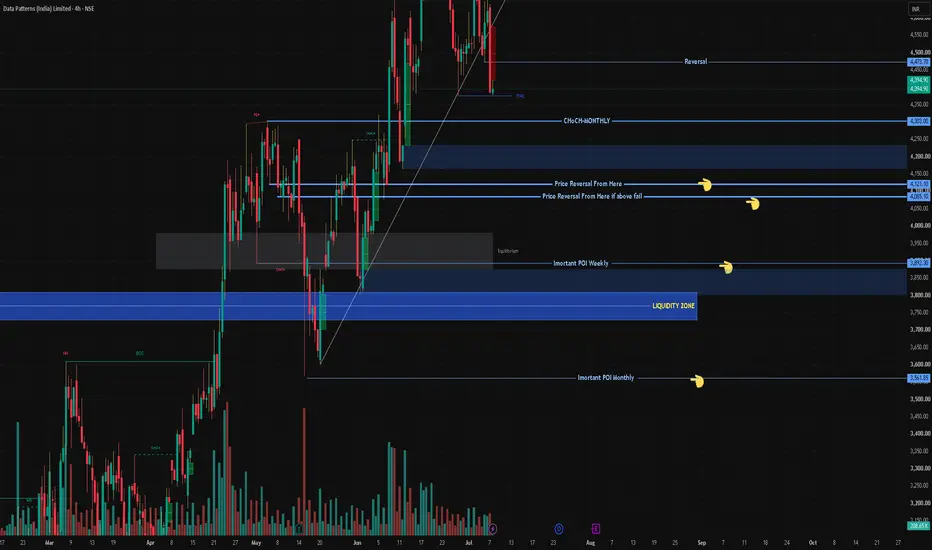
NAM_INDIA - Breakout Setup, Move is ON...#NAM_INDIA trading above Resistance of 1040
Next Resistance is at 1488
Support is at 796
Here are previous charts:
Chart is self explanatory. Levels of breakout, possible up-moves (where stock may find resistances) and support (close below which, setup will be invalidated) are clearly defined.
Disclaimer: This is for demonstration and educational purpose only. This is not buying or selling recommendations. I am not SEBI registered. Please consult your financial advisor before taking any trade.
Harmonic Patterns
Sunflag Iron and Steel Co Ltd - Breakout Setup, Move is ON...#SUNFLAG trading above Resistance of 310
Next Resistance is at 661
Support is at 230
Here are previous charts:
Chart is self explanatory. Levels of breakout, possible up-moves (where stock may find resistances) and support (close below which, setup will be invalidated) are clearly defined.
Disclaimer: This is for demonstration and educational purpose only. This is not buying or selling recommendations. I am not SEBI registered. Please consult your financial advisor before taking any trade.
NAM_INDIA - Breakout Setup, Move is ON...#NAM_INDIA trading above Resistance of 692
Next Resistance is at 1040
Support is at 452
Here are previous charts:
Chart is self explanatory. Levels of breakout, possible up-moves (where stock may find resistances) and support (close below which, setup will be invalidated) are clearly defined.
Disclaimer: This is for demonstration and educational purpose only. This is not buying or selling recommendations. I am not SEBI registered. Please consult your financial advisor before taking any trade.
Trade Summary: Piramal PharmaPPLPHARMA is entering a critical trend-reversal zone, currently testing a major technical "confluence" area.
The 200 DEMA & 100 WEMA Gauntlet: The stock is facing a "dual-ceiling" effect.
200 DEMA (₹172.68): Acting as the immediate barrier to a long-term bullish shift.
100 WEMA (₹174.96): The secondary filter that confirms medium-term structural strength.
Trend Evolution: The chart highlights a Choch (Change of Character) followed by a BOS (Break of Structure), indicating that the previous bearish cycle is exhausting in favor of a new uptrend.
Weekly High Breakout: The price has cleared the Weekly Break-Out level of ₹170.90, which now serves as a dynamic floor for this move.
Wait for a Daily Close above ₹175. This ensures the price has cleared both the 200 DEMA and the 100 WEMA, significantly reducing the risk of a "bull trap" or rejection at these key averages.
The "Danger Zone": The current price is ₹172.40, which is sandwiched between the 200 DEMA (₹172.68) and the 100 WEMA (₹174.96).
False Breakout Risk: Because the stock is trading right at these major moving averages, there is a risk of a "wick rejection."
Recommendation: If you are already in the trade, keep the ₹163.34 stop active. If you are entering now, the ₹168.26 level offers a better risk-to-reward ratio given the proximity to the Target 1 (₹185.04).
An Aggressive Stop Loss is set at ₹168.26, positioned just below the ₹170.90 weekly breakout level to protect traders seeking immediate momentum in case the breakout fails quickly.
A Conservative Stop Loss is placed at ₹163.34, acting as a "hard" exit below the demand accumulation zone and recent swing low; a drop to this level indicates that the bullish structure is officially broken.
Disclaimer: aliceblueonline.com/legal-documentation/disclaimer/
UltraTech Cement has delivered a high-conviction breakout📍 Trade Execution Parameters
Action: Buy / Long
Breakout Confirmation: Above ₹12,282 (Current Price: ₹12,163.00)
Stop Loss (SL): ₹11,484 (Protects against a failed breakout/false start).
Immediate Support: ₹11,874 (200 DEMA confluence).
Target 1: ₹13,000 (Psychological & Historical Resistance).
Target 2: ₹13,250 (Projected Trend Extension).
🚀 Momentum & Volume Indicators
Williams %R (140) Surge: The indicator has climbed to -18.26, crossing the critical -20 threshold.
The Signal: Rather than suggesting an "overbought" exhaustion, this reading indicates a momentum peak. In breakout trading, this confirms intense buying pressure and typically precedes a strong price extension.
Volume Validation: The move is backed by an expansion in volume (1.21M), confirming that the breakout is being driven by institutional participation rather than retail noise.
The combination of a Price Breakout, Moving Average Confluence, and Momentum Peak creates a "Triple Threat" setup. As long as the stock sustains above the 200 DEMA (₹11,874), any minor pullbacks should be viewed as "Buy on Dips" opportunities.
Disclaimer: aliceblueonline.com/legal-documentation/disclaimer/
Trade Like ProTrading is not a shortcut to riches. It requires:
Discipline
Emotional control
Risk management
Continuous learning
Most beginners fail because they treat trading like gambling rather than a skill-based profession.
Key Principles
Long-term perspective
Compounding returns
Diversification
Risk management
Beat Inflation
Inflation reduces the purchasing power of money. Investing helps grow wealth faster than inflation.
Compounding Power
Compounding allows your money to grow exponentially over time.
Example:
If you invest consistently, your returns generate additional returns, creating a snowball effect.
USD/CAD Could Move Towards Strong Resistance AreaUSD/CAD moved with a slight negative bias around 1.3660 during today's trading session.
The market is stuck in an observation phase as investors balance hopes for peace in the Middle East with falling oil prices, while preparing for the release of crucial economic data tonight.
--------------------------------------------------------------------------------------------
✅ Fundamental Dynamics: Geopolitical & Oil Push-and-Pull
Contradictory factors are currently limiting directional movement in this pair:
- Peace Hopes: Optimism regarding the potential for a permanent peace deal between the US and Iran has reduced demand for the US Dollar (USD) as a safe haven, exerting mild downward pressure on USD/CAD.
- Oil Weakening: Conversely, easing geopolitical tensions have actually driven down crude oil prices. As a commodity currency, oil weakness has dragged down the Loonie (CAD), which acts as a support for this pair.
- Dual Data Focus: Tonight at 7:30 PM WIB, the market will receive the US Nonfarm Payrolls (NFP) report and Canadian Labor Data simultaneously. The divergence between these two data points will be a key directional indicator for USD/CAD.
--------------------------------------------------------------------------------------------
✅ Technical Analysis: Bullish Bias Remains
Technically, the market structure suggests that bulls remain in control in the short term:
- Immediate Resistance (1.3708): 38.2% Fibonacci level. A break above this level would open the way to the next psychological targets at 1.3757 (50.0% Fib) and 1.3807 (61.8% Fib).
- Crucial Support (1.3648 - 1.3653): The confluence of the 100-day moving average (SMA) and the 23.6% Fib. This is the "stronghold" that must be held to maintain the bullish structure.
- Distant Downside Target (1.3550): If Canadian data is very strong while the US NFP misses significantly, USD/CAD risks sliding to this structural bottom.
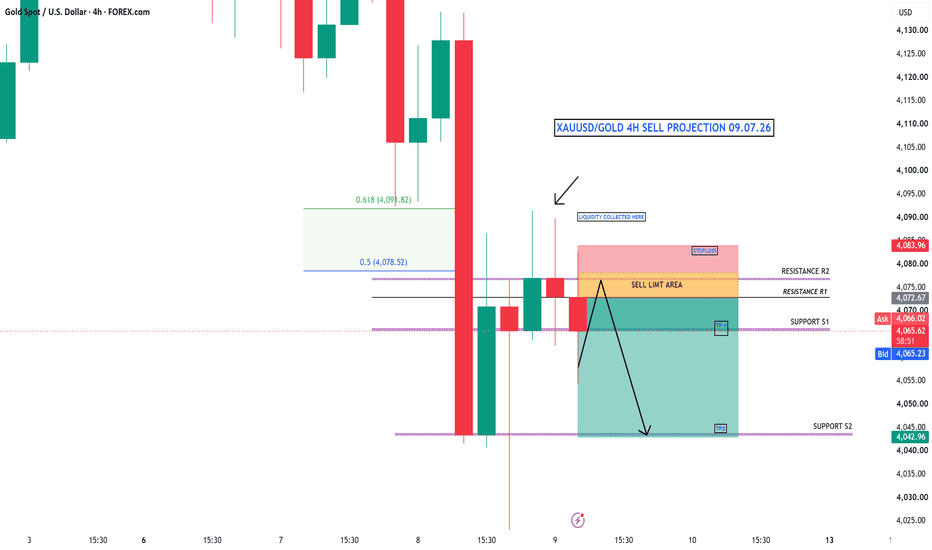
XAUUSD/GOLD 4H SELL LIMIT PROJECTION 08.05.26Gold is currently reacting from a strong resistance zone on the 4H timeframe. After reaching the Resistance R2 area, the market formed a strong bearish engulfing candle, which indicates that buying pressure is weakening and sellers are starting to gain control of the market.
At the moment, price is attempting a retracement toward the Fair Value Gap (FVG) and Resistance R1 zone. This area is considered a potential entry zone for sellers. If the market gives rejection confirmation from this region, the bearish movement may continue further downward.
According to the projection, the first downside target is the Support S1 zone, marked as Take Profit 1. If the market breaks below that support, the next major target could be the Support S2 zone, marked as Take Profit 2.
The stoploss area is placed above the bearish engulfing candle high. If price breaks and sustains above that level, the bearish setup could become invalid.
SJS: Massive Box Consolidation and Explosive Structural Breakout1. The Macro Perspective: The Wide Accumulation Zone
I am taking a LONG bias on S.J.S. Enterprises Limited (SJS) on the daily (1D) timeframe.
When analyzing pure market structure, we want to look for areas where massive amounts of shares are exchanging hands over a prolonged period. Look at the macro structure on this chart. For months, the stock has been trapped in a wide, highly volatile consolidation "box." It has been ping-ponging between a concrete support floor near 1,538.65 and a heavy historical resistance ceiling at 1,851.90. This prolonged sideways chop is the ultimate washing machine—it shakes out impatient retail traders and allows strong-handed institutional buyers to accumulate massive positions without driving the price up prematurely.
2. The Educational Setup: The Power of the Box Breakout
In technical analysis, the longer the base, the higher in space.
The Accumulation Floor: Every time the stock experienced a deep washout toward the 1,538.65 level, buyers aggressively stepped in to defend it. They refused to let the macro structure break down.
The Pressure Cooker: By continuously absorbing supply and testing the 1,851.90 ceiling, the stock stored immense kinetic energy. Right before the breakout, notice how the price formed a sharp V-shaped recovery off the lows, rocketing straight into the resistance line. This showed that buyers were highly motivated and unwilling to wait for another dip.
3. Current Price Action: The Lid Blows Off
Look at the most recent daily candles on the far right. The pressure cooker has finally exploded. Buyers have effortlessly shattered the 1,851.90 macro resistance, printing powerful, consecutive green expansion candles and surging straight toward the 2,000.00 psychological level. By clearing this massive accumulation zone, SJS has officially entered pure price discovery. With historical overhead supply now eliminated, natural selling pressure evaporates.
4. The Trade Plan: Entries, Targets, and Risk Management
Entry Strategy: Momentum is exceptionally strong right now near 1,996.10. Chasing a massive daily expansion candle always carries a higher risk of an immediate intraday drawdown. The highest-probability, lowest-risk entry involves placing limit orders to catch a potential minor structural pullback to retest the 1,850.00 to 1,900.00 breakout zone. Letting that old heavy resistance prove itself as a new, indestructible support floor offers a phenomenal risk-to-reward ratio.
Take Profit (Targets): We can find a measured technical target by taking the height of the consolidation box (roughly 313 points from the 1,538.65 floor to the 1,851.90 ceiling) and adding it to the breakout level. This gives us a primary structural target in the 2,150.00 to 2,165.00 zone. Immediate psychological milestones sit at 2,050.00 and 2,100.00.
Invalidation (Stop Loss): A trade thesis is only valid if the new market structure holds. A hard stop loss should be placed safely below the breakout line and recent swing structure, around the 1,750.00 to 1,780.00 level. A definitive daily close completely back inside the box and below the 1,851.90 line would act as an early warning sign of a failed macro breakout (a "bull trap").
5. Time Horizon:
Because this technical setup is built on a 1-Day chart capturing a massive structural phase transition and momentum breakout, this is a short-to-medium-term swing trade designed to capture the explosive markup phase. Let the trend run!
(XAU/USD) H1 Analysis — Bullish Breakout Testing Resistance
This 1-hour Gold Spot chart shows a strong bullish recovery structure after a prolonged corrective phase. Price is now testing a major resistance zone near 4,741–4,750.
Market Structure
The chart formed a large descending corrective structure from April 26 to May 5.
A clear trend reversal occurred after the higher low near 4,520.
Since May 6, buyers aggressively pushed price upward with strong bullish momentum candles.
Key Technical Zones
Resistance Zone
4,741 – 4,750
Price is currently rejecting this level slightly after touching resistance.
This area acted as a previous swing high and supply zone.
Support Zones
4,673
Important breakout support.
Previous resistance turned support.
4,620 – 4,650
Dynamic support area aligned with the rising green trendline.
4,520
Major swing low and bullish invalidation level.
Trend Analysis
The green ascending trendline indicates a developing bullish trend continuation.
Price remains above:
the moving average (blue line),
ascending structure,
and Supertrend support.
This suggests buyers still control the short-term trend.
Pattern Observation
The chart resembles:
a descending broadening wedge / falling structure breakout,
followed by a strong impulsive rally.
The breakout above 4,673 confirmed bullish continuation.
Momentum & Signals
Multiple “My Long Entry Id” signals appeared during the rally phase.
Short signals near resistance suggest temporary exhaustion rather than confirmed reversal.
Momentum remains bullish unless price closes back below 4,673.
Possible Scenarios
Bullish Scenario
If price breaks and holds above 4,750:
next targets may be:
4,780
4,820
psychological continuation higher.
Bearish Pullback Scenario
If rejection continues from resistance:
expect retracement toward:
4,700
then 4,673 support retest.
As long as support holds, dips may attract buyers.
Overall Bias
Short-term Bias: Bullish
The chart currently favors buyers after a confirmed breakout and strong momentum expansion, but price is now at a critical resistance where profit-taking and volatility are likely.
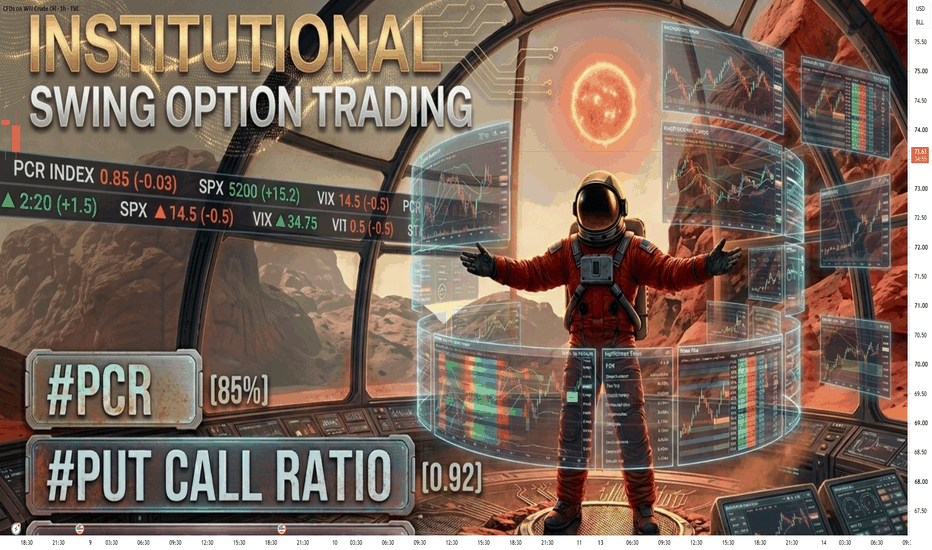
Institution Option Trading Part-3PCR means Put-Call Ratio
It compares how many Put options are traded versus Call options.
Simple formula: Put Volume ÷ Call Volume.
This helps understand market mood.
Institutions use options heavily
Big players like banks, hedge funds, mutual funds often use options for hedging and positioning.
So PCR can give clues about what smart money may be doing.
Shows fear vs confidence
High PCR = More puts than calls = Fear, protection, bearish mood.
Low PCR = More calls than puts = Confidence, bullish mood.
Institutions often buy protection before market falls.
Helps read hidden sentiment
Price may look strong, but if PCR rises sharply, institutions may be hedging quietly.
That means caution is needed.
Useful for contrarian signals
Extreme PCR values can signal crowd panic or overconfidence.
Example:
Very high PCR may mean panic selling near bottom.
Very low PCR may mean greed near top.
Improves entry and exit timing
If price is near support and PCR is high, market may bounce soon.
If price is near resistance and PCR is too low, reversal may happen.
Shows hedging activity
Institutions do not always speculate. They protect portfolios using puts.
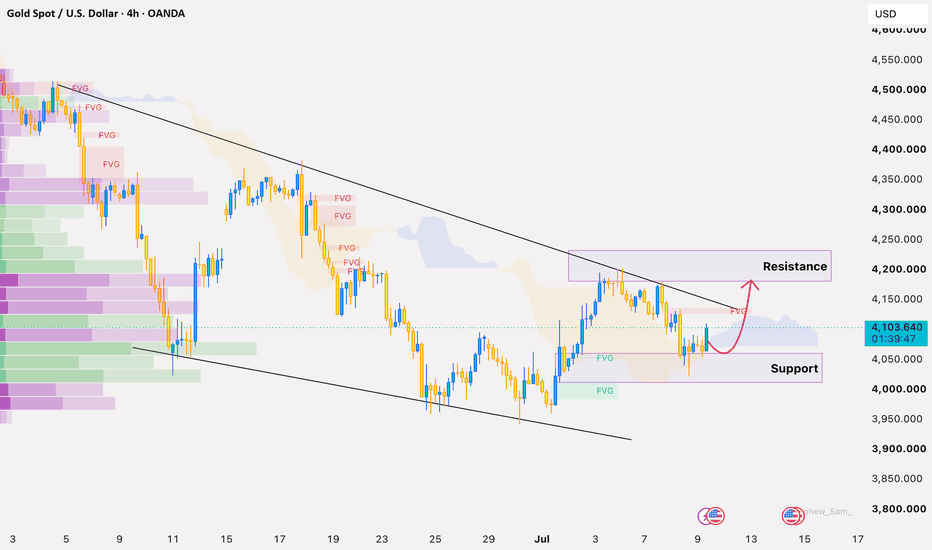
Gold Prices Attempt to Strengthen Amid Dollar WeakeningGold prices (XAU/USD) faced new headwinds in today's trading.
Although diplomatic optimism had lifted prices, Iran's rejection of the draft agreement and stronger-than-expected US employment data have revived the US Dollar's (USD) dominance.
---------------------------------------------------------------------
✅ Geopolitics: Diplomacy Under "High-Intensity" Threat
The situation in the Middle East remains a major source of volatility with contradictory signals:
- ⚡Draft Deadlock: Although Axios reported that a deal was imminent, Iranian state media (ISNA) denied the claim. Tehran reportedly rejected the provisions of the one-page draft submitted by the US, claiming they repeated points previously rejected.
- ⚡Trump's Threat: Amid Iran's review of the memorandum of understanding, President Donald Trump escalated tensions by threatening to bomb Iran "at a much higher level and intensity than before" if a peace deal was not agreed upon soon.
- ⚡Nuclear Factor: Fundamental differences over Iran's nuclear program remain a major stumbling block, making investors doubtful about the near-term achievement of permanent peace, which automatically limits the rally in safe-haven assets like gold.
----------------------------------------------------------------
✅ Macroeconomics: ADP Beats Forecasts
Domestic US economic data adds fuel to the "Higher for Longer" narrative:
- ⚡ADP Surprise: The April private employment report recorded growth of 109,000, well above the previous month's revised 61,000. This indicates that the US labor market remains resilient enough to support tight monetary policy.
- ⚡Interest Rate Speculation: The FedWatch Tool shows that traders are still pricing in the possibility of a rate hike by the end of 2026. This prospect keeps US bond yields attractive and weighs on non-yielding gold.
--------------------------------------------------------
✅ XAU/USD Technical Analysis (Intraday)
Technically, gold is struggling to maintain its recovery momentum:
- ⚡ Critical Resistance ($4,700 - $4,730): This level is a tough barrier. The failure to break through this area amid Trump's latest threats suggests that the market prefers the US dollar as a risk hedge at this time.
- ⚡ Nearest Support ($4,620): If the price closes below this level during the European session, the daily bias will return to bearish with a target of retesting the $4,600 level.
- ⚡ Tonight's Catalyst: The release of Initial Jobless Claims data (7:30 PM WIB) and speeches by FOMC officials will be the main drivers before tomorrow's NFP report.
.XAUUSD/GOLD INTRADY PROJECTION 07.05.26Gold intraday outlook is currently bullish, as the market has already shown a strong upward move from the recent swing low around the 4550 zone. After this impulse, price is now in a healthy pullback phase, which is a normal retracement before the next potential move. In your chart, the key buying area is clearly marked between 4635 (0.5 Fibonacci level) and 4614 (0.618 level), which is a strong demand zone where buyers are expected to step in. If price reacts positively from this zone, we can expect continuation towards the previous highs, with targets around 4725 (day swing high) and further upside towards 4760 resistance. This setup is mainly a buy-on-dip opportunity, not a breakout trade, so patience is important to wait for price to reach the discount zone. However, if the market breaks and closes below the 4610 area, the bullish structure will weaken, and it’s better to avoid buying positions. Overall, the plan is simple: gold is bullish, wait for retracement, enter from support, and target the highs
[MCX] Crude Oil 7th May ExpirySelling Crude 9600CE.
Selling Crude 8300PE.
Note -
One of the best forms of Price Action is to not try to predict at all. Instead of that, ACT on the price. So, this chart tells at "where" to act in "what direction. Unless it triggers, like, let's say the candle doesn't break the level which says "Buy if it breaks", You should not buy at all.
=======
I use shorthands for my trades.
"Positional" - means You can carry these positions and I do not see sharp volatility ahead. (I tally upcoming events and many small kinds of stuff to my own tiny capacity.)
"Intraday" -means You must close this position at any cost by the end of the day.
"Theta" , "Bounce" , "3BB" or "Entropy" - My own systems.
=======
I won't personally follow any rules. If I "think" (It is never gut feel. It is always some reason.) the trade is wrong, I may take reverse trade. I may carry forward an intraday position. What is meant here - You shouldn't follow me because I may miss updating. You should follow the system I share.
=======
Like -
Always follow a stop loss.
In the case of Intraday trades, it is mostly the "Day's High".
In the case of Positional trades, it is mostly the previous swings.
I do not use Stop Loss most of the time. But I manage my risk with options as I do most of the trades using derivatives