Harmonic Patterns
XAUUSD H1: Institutional targets lower liquidity.XAUUSD H1: Institutional Order Flow Targets Lower Liquidity
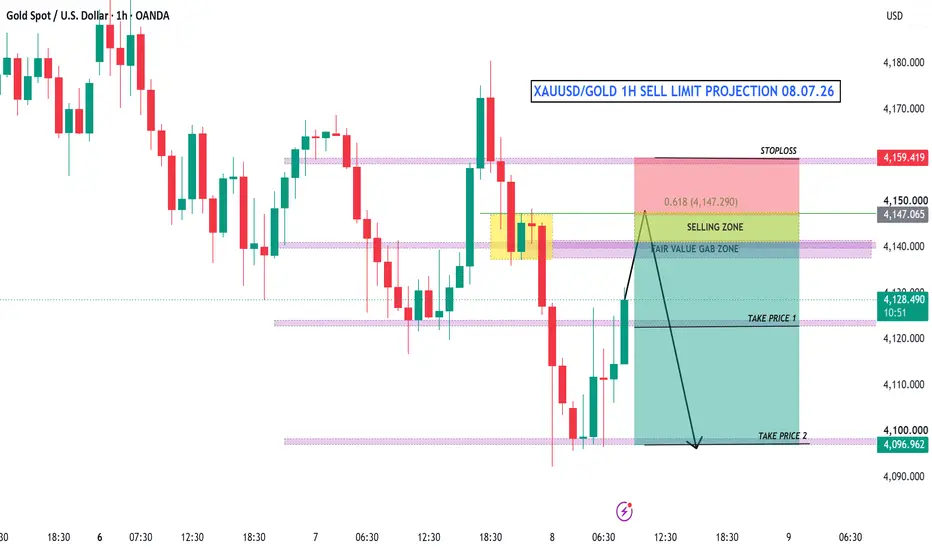
Gold remains heavily bearish on the H1 chart as a dynamic descending trendline continues to suppress price action. Following a recent Market Structure Shift (MSS) and a decisive Break of Structure (BOS) to the downside, the market has left significant unmitigated supply above, keeping the focus strictly on further downside expansion.
Fundamental & Institutional Backdrop
The current order flow backdrop strongly favors a bearish distribution model.
Aggressive breakdowns and the formation of large Fair Value Gaps (FVG) indicate heavy institutional selling pressure. The market is currently in a phase of engineering liquidity—trapping early retail buyers at minor support levels while leaving a trail of buy-stop liquidity above. This combination reduces the probability of a genuine trend reversal and keeps the asset highly vulnerable to continuation drops, especially while the premium supply zones remain completely unmitigated.
Technical Structure on H1
The short-term structure is decisively weak and controlled by bears.
Price is consistently printing lower highs and lower lows, heavily constrained by a descending trendline. The market recently tapped into the 4,519.549 Buy Zone Liquidity, where early buyers are attempting to catch a falling knife, creating a minor resting point but lacking any strong bullish displacement to suggest a shift in control.
The immediate levels to watch on the upside are 4,565.584 and 4,583.426, marked as "Strong Liquidity." This area contains a cluster of equal highs and trendline liquidity, acting as a massive inducement target. The market is likely to sweep this area to hunt stop-losses before the next leg down.
Above that, the ultimate Point of Interest (POI) is the 4,631.745 Sell Zone Order Block (OB). This area represents a premium supply cluster where the OB aligns perfectly with a massive unfilled FVG and the descending trendline, making it the most robust defensive barrier for sellers.
What Order Flow is Suggesting
Order flow strongly leans bearish across the H1 timeframe:
price structure remains firmly capped below the descending trendline
retail buy-side liquidity is actively building at the 4,519.549 support
a corrective pullback is highly probable to sweep the strong liquidity at 4,565.584 – 4,583.426
the massive 4,631.745 Sell Zone OB remains unmitigated and acts as the primary institutional entry point
This keeps the downside scenario dominant unless buyers can print a confirmed structural shift above the main OB.
Trading Scenarios
Scenario 1: Sweep liquidity into Sell Zone OB, then downside resumes
If gold rebounds to sweep the strong liquidity pool (4,565.584 – 4,583.426) and taps into the Sell Zone OB at 4,631.745, sellers are expected to regain full control to drive the price down, aligning with the projected path.
Entry: bearish rejection from 4,631.745 (Sell zone OB)
SL: slightly above the OB zone (e.g., 4,635.000)
TP1: 4,583.426 (First internal liquidity target)
TP2: 4,565.584
TP3: 4,519.549 (Buy zone liquidity)
Scenario 2: Breakdown below Buy zone liquidity (4,519.549)
If price fails to pull back and instead drops to close decisively below the 4,519.549 Buy zone liquidity, gold will continue its aggressive expansion lower.
Entry: confirmed break and close below 4,519.549
SL: above the most recent lower high (broken support)
TP1: 4,500.000 (Psychological round number)
TP2: 4,480.000
Scenario 3: Immediate rebound from Buy zone liquidity
If gold sweeps lower first, tapping the 4,519.549 Buy zone liquidity with a strong bullish reaction, buyers may initiate the corrective pullback to hunt the upper liquidity.
Entry: bullish confirmation from 4,519.549
SL: below the immediate sweep low
TP1: 4,565.584 (Strong liquidity)
TP2: 4,583.426 (Strong liquidity)
TP3: 4,631.745 (Sell zone OB)
Key Levels to Watch
4,631.745 → Primary Sell Zone OB / Major structural resistance
4,583.426 → Strong liquidity / Upper inducement target
4,565.584 → Intermediate liquidity / Trendline sweep target
4,519.549 → Buy zone liquidity / Immediate short-term support
Conclusion
Gold's H1 structure is heavily dictated by institutional sell programs. The market is currently engineering liquidity, trapping buyers at the 4,519.549 zone while leaving obvious inducement levels above. As long as price remains below the dynamic trendline and the critical 4,631.745 Order Block, the overarching order flow remains strictly bearish. For TradingTips members, maintaining a sell-on-rally approach into premium supply zones remains the highest probability strategy.
USD/ACD Potential to Weaken FurtherUSD/CAD moved within a narrow range around 1.3620 during today's Asian session.
The pair is caught between two major forces: surging oil prices, which are strengthening the Loonie (CAD), and a strengthening US Dollar (USD), driven by safe-haven sentiment and expectations of hawkish Federal Reserve policy.
----------------------------------------------------------------------------------------
✅ Fundamental Dynamics: Oil vs. Safe-Haven Sentiment
Contradictory factors are currently keeping the pair in an oscillatory phase:
- ⚡Escalation in the Persian Gulf: Missile and drone attacks on the port of Fujairah (UAE) and the US "Project Freedom" initiative have triggered a surge in crude oil prices. As a commodity currency, the CAD has found significant support, limiting USD/CAD's gains.
- ⚡USD Strength: On the other hand, President Trump's threat to "wipe Iran off the face of the earth" reinforces the USD's status as a primary safe-haven asset. Furthermore, markets are now starting to price in the possibility of a Fed rate hike later in the year, providing a boost to the greenback.
- ⚡Lack of Direction: This combination discourages traders from placing aggressive bets, causing the spot price to become trapped in a sideways pattern.
----------------------------------------------------------------------------------------
✅ Technical Analysis (H4): Selling Pressure Begins to Fade
Technically, the market structure indicates weakening bearish momentum, but a trend reversal has not yet been confirmed:
- ⚡Determination Zone (1.3650): This is a crucial confluence area consisting of the 100-period SMA and the 23.6% Fibonacci Retracement. As long as the price remains below this level, the short-term bias remains mildly bearish.
- ⚡Key Resistance (1.3650): The threshold for a broader bullish recovery.
- ⚡Crucial Support (1.3553): The most recent swing low. A decline below this level would pave the way for a deeper decline towards the 1.3500 area.
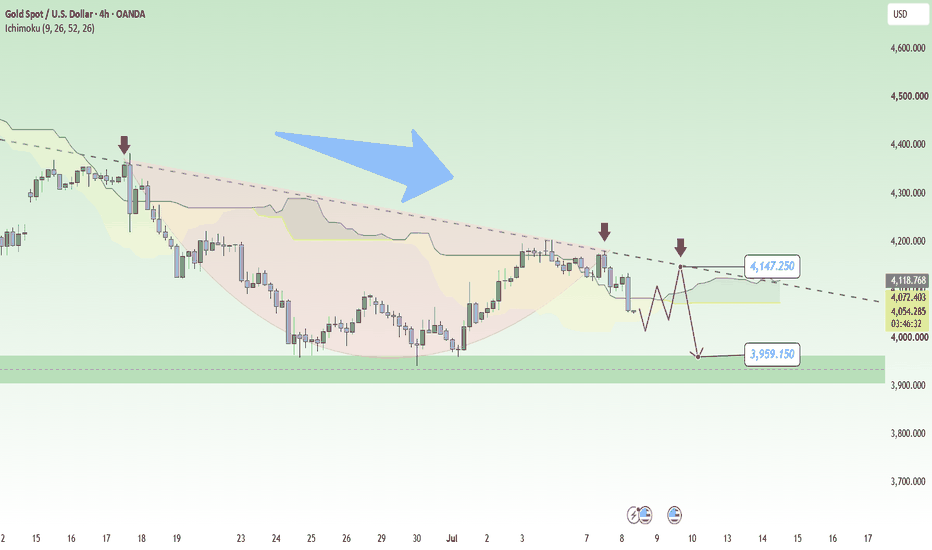
Gold Analysis: Can Sellers Push Price Down to 4,500?Hello dear traders, Selena here!
Looking at the XAUUSD chart right now, I find it quite interesting.
Take a look: price has been trapped within a clear descending channel, forming lower highs and lower lows, respecting both boundaries consistently.
At the moment, price has pushed back toward the midline of the channel — and this is where things get interesting. With bearish momentum showing no real signs of slowing down, the structure suggests that another rejection could be coming soon.
If that rejection happens, the short setup becomes very clear: a move back toward the lower boundary of the channel, with a potential target around 4,500.
Remember, in a channel like this, trading with the trend always has a higher probability than trading against it. Until the channel is broken, sellers remain in control.
Do you agree? Drop your thoughts in the comments. Engaging with the TradingView community is always a great way to improve and grow your trading skills.
XAUUSD: Sell to Win?Do you think Gold prices are likely to decline today? Let’s take a look at the gold market together with Selena!
After a period of gains, XAUUSD has stalled below the psychological level of $4,650, but still lacks the momentum to break above this resistance zone. Evidence shows that Gold has repeatedly declined after reacting to this area twice.
Today, Gold is slightly correcting and is currently trading at $4,608, down 0.13% on the day. It can be seen that there is no significant breakout in either direction, and price remains close to the EMA 34 and 89 zones. Therefore, Gold is more likely to continue consolidating as it is now, fluctuating within the expected range between $4,650 and $4,500.
Outlook: A breakdown below the current support zone could push the price of this metal lower, as the bearish trend remains the primary bias.
And you, do you think XAUUSD will rise or fall? What is your target view?
Option Trading✅Option Premium (How Option Prices Are Decided)
Option Premium = Intrinsic Value + Time Value
1. Intrinsic Value
Represents real, in-the-money value of an option.
Call IV = Spot Price – Strike Price (if positive).
Put IV = Strike Price – Spot Price (if positive).
2. Time Value
Reflects the possibility of the option becoming profitable before expiry.
Higher time value means higher premium.
Time value declines as expiry approaches.
3. Factors Affecting Premium (Option Greeks)
Delta — sensitivity to price movement.
Gamma — rate of change of Delta.
Theta — time decay.
Vega — sensitivity to volatility.
Rho — sensitivity to interest rates.
Part 2 Institutional Trading Vs. Technical AnalysisMarket Participants in Options
Retail Traders — willing to speculate or hedge.
Institutional Traders — hedge large portfolios.
FIIs / DIIs — use options for arbitrage and hedging.
Hedgers — reduce risk through options.
Speculators — capture short-term market direction.
Option Writers — earn consistent premium income.
Market Makers — provide liquidity.
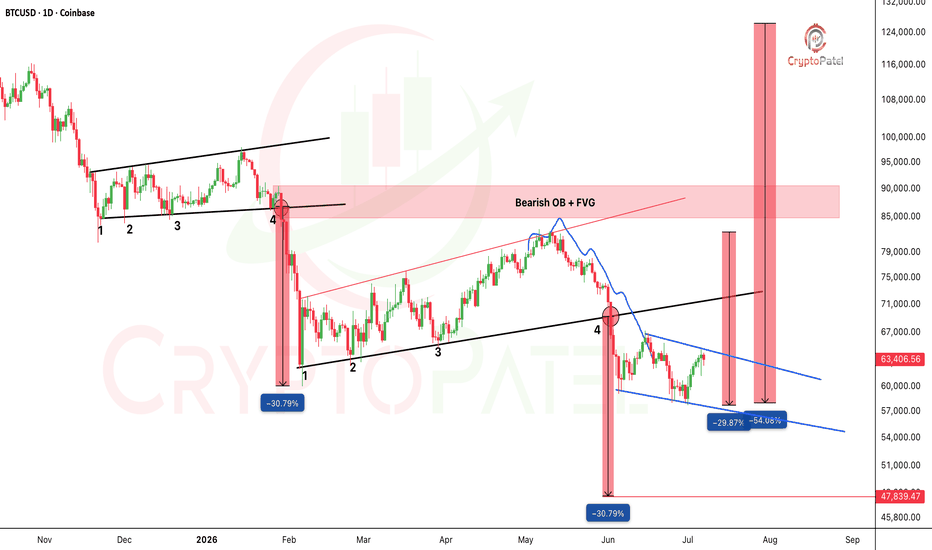
Bitcoin Range View: 78K to 75K Move ExpectedHi Traders, I hope you are doing well.
As today is Saturday, Bitcoin usually moves in a small range because market activity is low. Right now, price is near a strong resistance around 78K after a good upward move.
At this level, price is slowing down, which means sellers can enter here. If Bitcoin is not able to stay above 78K, then we may see a downward move.
As per simple view, price can fall towards the 75K area, which is a previous support zone. So, 78K is acting like a selling area, and 75K is a buying area.
If price stays above 78K and moves sideways, then the range can continue instead of falling. So, it is better to wait for clear confirmation before taking any trade.
This is only for learning purpose. Always manage your risk and avoid trading without proper plan.
NIFTY- Intraday Levels :- 5th May 2026 NIFTY sustain above 24134 above this bullish then 24197/204 above this more bullish then 24223/31/45 then 24310/17/31 above this wait marked on chart.
If NIFTY sustain below 24108 below this bearish then 24080/65/58 then 24002/23981 below this more bearish then below this wait more levels marked on chart
My view :-
"My viewpoint, offered purely for analytical consideration, The trading thesis is: Nifty ( bearish tactical approach: sell on rise) however we can expect both side movements
Watch closely if comes around 23930 .
This analysis is highly speculative and is not guaranteed to be accurate; therefore, the implementation of stringent risk controls is non-negotiable for mitigating trade risk."
Consider some buffer points in above levels.
Please do your due diligence before trading or investment.
**Disclaimer -
I am not a SEBI registered analyst or advisor. I does not represent or endorse the accuracy or reliability of any information, conversation, or content. Stock trading is inherently risky and the users agree to assume complete and full responsibility for the outcomes of all trading decisions that they make, including but not limited to loss of capital. None of these communications should be construed as an offer to buy or sell securities, nor advice to do so. The users understands and acknowledges that there is a very high risk involved in trading securities. By using this information, the user agrees that use of this information is entirely at their own risk.
Thank you.
Nifty Healthcare Index: Massive Multi-Year Breakout to All-Time The Nifty Healthcare Index has just delivered a high-conviction structural breakout on the daily timeframe. After consolidating for nearly 18 months below a major supply zone, the index has decisively cleared its previous peak, signaling the start of a potential multi-quarter bullish cycle for the healthcare sector.
Key Technical Observations:
Major Horizontal Breakout: The index has successfully surged past the critical resistance level at 15,072. This level has acted as a formidable ceiling since late 2024; flipping this into support is a massive bullish milestone.
All-Time High (ATH) Momentum: By trading at record levels, the index is now in "Blue Sky Territory." Without any historical overhead supply to act as resistance, the momentum is expected to accelerate as price discovery takes over.
Exponential Moving Average Support: The price is trending well above its 20, 50, and 100-day EMAs. The shorter-term EMAs are beginning to fan out and slope upwards, providing a strong dynamic cushion for the current rally.
Long-Term Base Completion: The massive rounding structure/base formed over the last year and a half suggests that a significant amount of accumulation has taken place, which could lead to a powerful and sustained upward move.
Technical Setup:
Entry: Current Market Price (15,072) or on a successful retest of the breakout zone between 14,800 - 15,000.
Stop Loss (SL): 14,200 (Placed safely below the recent swing low and the 50-day EMA support).
Targets:
Target 1: 16,500 (Immediate psychological and momentum target)
Target 2: 18,200+ (Based on the measured move of the 18-month consolidation base)
Disclaimer:
This analysis is for educational and informational purposes only. Trading in financial indices involves significant risk. Please conduct your own research or consult with a SEBI-registered financial advisor before making any investment decisions. I am not a SEBI-registered advisor.
This sector breakout is structurally very strong—are you looking to trade the index directly or using this to filter for high-momentum pharma and healthcare stocks?
Swing TradingPositional trading involves holding trades for weeks to months.
Features:
Based on macro trends
Combines technical + fundamental analysis
Lower stress compared to intraday
Scalping
Scalping is ultra-short-term trading where traders make multiple trades in minutes.
Features:
Small profit targets
High frequency
Requires precision
Ideal For:
Advanced traders with fast execution.
Options trading is a type of derivative trading where contracts derive value from an underlying asset like stocks or indices.
Gold Prices Weaken in Early Week TradingGold prices (XAU/USD) started the week on the defensive, holding under pressure but still managing to maintain the psychological level of $4,600.
Tensions in the Strait of Hormuz, which have entered a new phase through the US "Project Freedom" initiative, combined with hawkish signals from Federal Reserve officials, continue to strengthen the dominance of the US Dollar (USD).
----------------------------------------------------------------
✅ Geopolitics: "Project Freedom" vs. IRGC Threat
The risk of physical confrontation in the strategic maritime route reaches a new critical point:
- ⚡Project Freedom: President Donald Trump announced plans to forcibly escort stranded ships through the Strait of Hormuz. This high-risk move aims to break the blockade, but is accompanied by a stern warning of military action if disrupted.
- ⚡Iran's Reaction: Senior Iranian lawmakers and the IRGC responded by calling the US move a violation of the ceasefire. Iran's accusation that the US has failed to fulfill diplomatic agreements increases the risk of a new outbreak of open hostilities.
- ⚡Price Impact: This uncertainty keeps crude oil prices high, which automatically fuels global inflation and puts pressure on non-yielding assets like gold.
---------------------------------------------------------
✅ Monetary: Neel Kashkari & the Threat of Interest Rate Hikes
The Fed's stance after last week's meeting has hardened:
- ⚡Kashkari's Statement: Minneapolis Fed President Neel Kashkari surprisingly raised the possibility of raising interest rates if the Iran conflict continues to exacerbate inflation and damage the economic structure.
- ⚡Hawkish Faction: Given that there were three "dissenters" at the last meeting who favored tighter policy, Kashkari's comments reinforce the market's perception that a dovish pivot is still very far away.
- ⚡USD Dominance: The prospect of "Higher for Longer" (or even higher) interest rates attracts US dollar buyers on every dip, creating a constant barrier to a recovery in gold prices.
---------------------------------------------------------
🎯 Key Levels to Watch 🎯
- ⚡Confluence Resistance ($4,650.47 – $4,655.61): This area is crucial. Buyers need to reclaim this zone to ease selling pressure and open up the opportunity to move towards $4,700.
- ⚡Crucial Support ($4,600): The last line of safety for intraday buyers. Failure to hold this level will expose the price to a sharp decline.
- ⚡Structural Base Target ($4,512.28): The ultimate target for sellers if the $4,600 level is broken with high volume.
- ⚡Distant Resistance ($4,807 – $4,887): A medium-term resistance area that will only be relevant if there is a complete de-escalation in the Middle East.
Gold: Final Sell Sweep → Expansion to HighsGold has been grinding lower, respecting bearish structure and keeping sellers confident. But now price is approaching a key discount zone where liquidity sits thick beneath the surface.
That’s where the game changes.
What stands out:
Price compressing into support → loss of momentum
Equal lows / resting sell-side liquidity just below
No clean continuation despite bearish structure
This is classic pre-reversal behavior.
My narrative:
A final sweep below the current lows to trigger stops → immediate rejection → displacement to the upside.
That move higher isn’t random.
It’s a draw on liquidity resting above the range, including prior highs and inefficiencies left behind.
Exact Entry,SL,TP willbe posted later
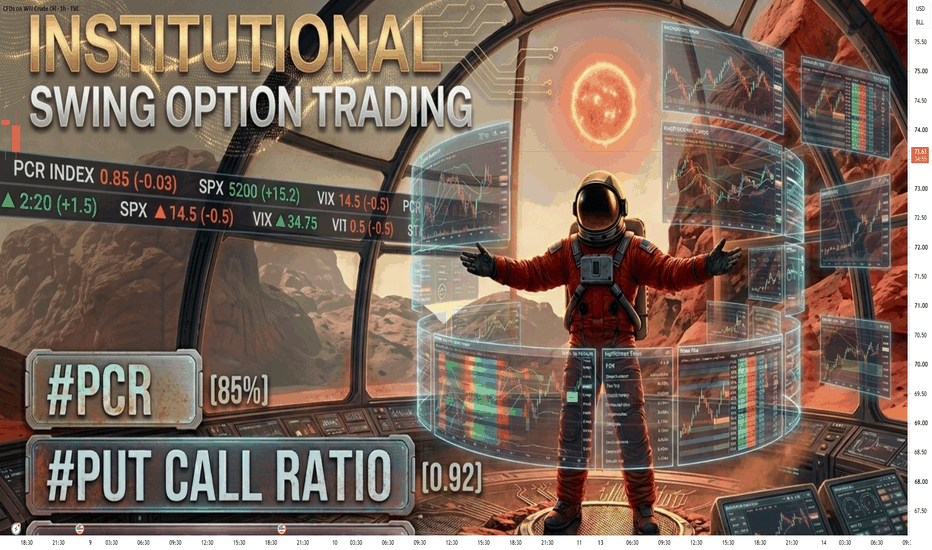
Institution Option Trading Part-1PCR means Put Call Ratio
It tells us how many Put options and Call options people are buying or trading.
Why it matters for institution trading
Big players mostly use options. So PCR helps us understand what big money may be thinking.
If PCR is high
More puts than calls.
Means traders are scared or taking protection.
Sometimes big players expect weakness.
If PCR is low
More calls than puts.
Means confidence in upside.
Sometimes market is bullish.
Why learn this
Price only shows movement.
PCR shows mindset behind movement.
Institutions think different
Retail people chase candles.
Institutions manage risk first.
PCR helps you see that risk activity.
Read Advanced Option ChainInstitutional Option Trading (6 Key Points):
Smart Money Activity – Institutions like banks, hedge funds, and FIIs trade options with large capital, creating strong directional moves in the market.
Option Chain Analysis – They focus on OI buildup, unwinding, and PCR to identify accumulation/distribution zones.
Liquidity Zones – Institutions trade where liquidity is high (ITM/ATM strikes), ensuring easy entry and exit without slippage.
Hedging Strategies – Use advanced strategies like spreads, straddles, and strangles to manage risk instead of naked positions.
Volatility Play (VIX Focus) – Institutional traders trade based on implied volatility expansion and contraction, not just price direction.
Support & Resistance Creation – Major OI levels act as strong support/resistance due to institutional positioning.