Head and Shoulders
ETHUSD at a crucial support Forming Head and shoulder pattern✅ Pattern Forming: Inverse Head & Shoulders (Early Stage)
Look closely:
Left Shoulder → ~2300
Head (lowest point) → ~2180–2200
Right Shoulder → ~2250–2270
Price now pushing upward again
This is a classic bullish reversal structure.
✅ Key Resistance / Neckline Zone
Marked level around:
2380–2400
Price is currently struggling below this.
That is the neckline / supply barrier.
✅ Bullish Structure Confirmation
Breakout Confirmation = 1H Close Above 2400
If ETH closes above 2400 with vol
NIFTY Outlook in WEEKLY Time Frame.💥NIFTY Outlook in WEEKLY Time Frame.
💥In Longer time frame NIFTY Corrected 👉🏼 61.80% of recent big LOW & All time HIGH
⁉️ Is nearing Final correction?
NEXT level to Watch 👉🏼 24337.50 "Left Shoulder of H&S Pattern"
^^^^^^^^^^^^^^^^^^^^^^^^^^^^^^^^^^^^^^^^^^^^^^^^^^^^^^^^^^^^^
Levels to follow for coming Days.
^^^^^^^^^^^^^^^^^^^^^^^^^^^^^^^^^^^^^^^^^^^^^^^^^^^^^^^^^^^^^
⚠️ DISCLAIMER:
The information, views, and ideas shared here are purely for educational and informational purpos
TMPV - Elliott Wave Structure Behind a Head & ShouldersUsing Elliott Wave principles , the advance in Tata Motors Passenger Vehicles can be interpreted as a completed 5-wave impulsive move , after which price has transitioned into a corrective and distributive phase . The emergence of a Head & Shoulder formation aligns well with this wave count, reinforcing the shift in structure . With price holding below the right-shoulder resistance , the neckline remains vulnerable , keeping the broader bias corrective unless a major resistance is dec
Container Corporation of India Ltd – Head & Shoulders in PlayOn the monthly chart, CONCOR is showing a Head & Shoulders formation. The neckline around ₹480–500 is the key level to watch.
A breakdown below the neckline could confirm bearish continuation.
A successful hold above it may simply lead to sideways consolidation instead of a full breakdown.
The neckline is the make-or-break zone for the stock in the coming months.
Disclaimer: This analysis is for educational purposes only and does not constitute investment advice. Please do your
Union Bank of India: Long-Term Head & Shoulders PatternUnion Bank of India has delivered a decisive long-term breakout on the monthly timeframe after completing a classic Inverse Head & Shoulders pattern, marking a major structural shift in trend. The pattern has been in formation for several years, with a well-defined left shoulder, a deep head near the bottoming zone, and a higher right shoulder, clearly reflecting gradual accumulation after prolonged weakness.
The most important technical development is the clean breakout above the neckline resi
CAMS - Descending triangle + Head and Shoulders PatternA clear Head and Shoulders structure has formed over the recent months. The price has just breached the neckline support (horizontal dotted teal line) around the ₹720–₹730 zone.
The recent price action shows a breakdown below the neckline with a red candle, suggesting that the bearish momentum is gaining traction.
Also stock is trading below 200 EMA, which is a strong downward movement signal.
Traders should watch for a potential "retest" of the neckline before the continuation of the downwar
TITAN Inverted Head & Shoulders | Bullish Breakout SetupTITAN has formed a well-structured Inverted Head & Shoulders pattern, signaling a potential bullish trend reversal.
🔹 Breakout confirmed above the neckline
🔹 Neckline tested again after breakout and successfully held as support
🔹 Retests indicate strong buyer presence and acceptance above resistance
🔹 Structure supports continuation towards higher levels
📌 Trade Setup:
Buy Above: immediately
Target (Profit): 🎯 4109
Stop Loss: ❌ 4020
📊 Bias: Bullish as long as price sustains above th
Auropharma at crucial levelAs per the daily chart, the price is forming an inverted head and shoulder pattern. The price should sustain the zone 1250 - 1260 to move up. Today's movement shows, the bulls have the strength to give a movement.
If the price opens above 1230 and shows bullish strength, buy above 1236 with the stop loss of 1224 for the targets 1246, 1258, 1272 and 1286.
If the price has a pullback towards the 1200 zone and shows bullish strength, buy above 1206 with the stop loss of 1196 for the targets 1218, 1
Equitas SFB (D): Strong Bullish Reversal (Turnaround Story)Timeframe: Daily | Scale: Linear
The stock has confirmed a major structural reversal, breaking out of a 4-month base (Inverted Head & Shoulders).
📈 1. The Chart Structure (Inverted H&S)
> The Pattern:
- Left Shoulder: Lows of ₹59.50 (May 2025).
- Head: The panic low of ₹50 (Sep 2025).
- Right Shoulder: The recent higher low at ₹57 (Dec 2025).
> The Neckline Breakout: The resistance at ₹64–₹65 was the "Line in the Sand." Today's close at ₹66.68 confirms the trend change
KOTAK BANK:Likely Huge Inverted Head &Shoulder BreakoutKOTAK BANK :Trading at around 2220
Trading above all its critical Moving Averages viz 10/20/50/100/200 DEMA
Formed Inverted H&S Pattern i weekly chart
As per the pattern equivalent to the depth of the Head &Shoulders if holds anove 2220-40 expect a 50-75 point move towards 2250/2275/2300(For educational purpose only)
Nifty 50 Price Structure Analysis [18/12/2025: Thursday]Top-Down Nifty 50 Price Structure Analysis for 18th of December 2025. The day is Thursday.
(1) Monthly Time Frame:
Red marubozu plus piercing candle feature is observed. No bullish trade till the price starts to trade above 26000. Major support 25700. The view is indecision as trend (bullish or bearish) clarity is missing.
(2) Weekly Time Frame:
The trend for the past 3 weeks is down. But there is no clear trend. The market structure is broken. It is a confusing market. A major resista
Nifty 50 Price Structure Analysis [17/12/2025: Wednesday]Top-Down Nifty 50 Price Structure Analysis for 17th of December 2025. The day is Wednesday.
(1) Monthly Time Frame:
Red piercing candle. Sign of weakness. There is also a sign of trend reversal. Every up move should be doubted. Major resistance is 26000. Minor support is 25800. Major support is 25700. The view is indecision to bearish.
(2) Weekly Time Frame:
It's a 3rd week red candle/ Body is red, plus there is sharp selling pressure from 26100 and 26000. Lower lows and lower highs st
Nifty 50 Price Structure Analysis [10/12/2025: Wednesday]Top-Down Nifty 50 Price Structure Analysis for 10th of December 2025. The day is Wednesday.
(1) Monthly Time Frame:
Red piercing candle. Sign of indecision and trend exhaustion. Major resistance is at level 26000. Major support is at level 25700. The view is indecision to bearish.
(2) Weekly Time Frame:
Red marubozu with weak lower wick. The previous week's candle is also a red hanging man. Today's price gave a breakdown below 3 weeks of consolidation. Signs of trend reversal and previou
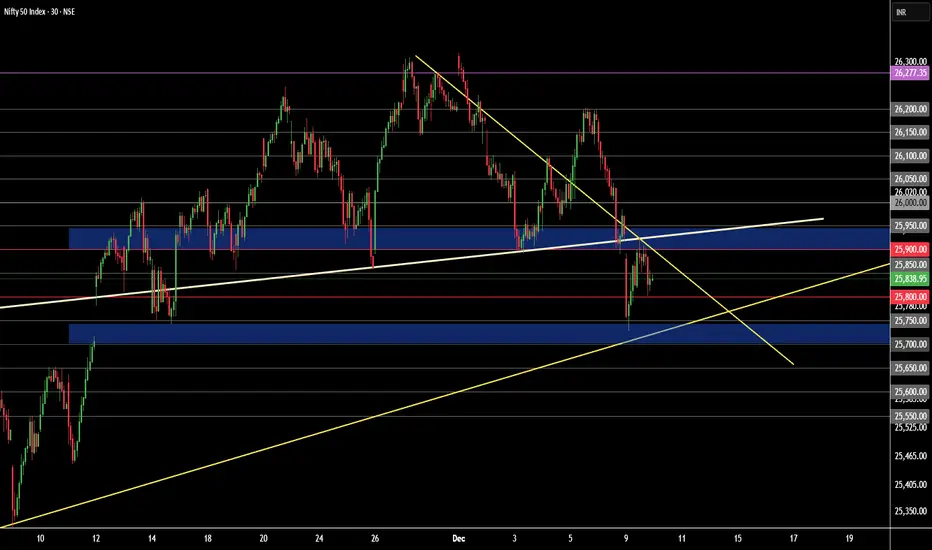
Nifty 50 Forms a Bearish Head & Shoulders PatternThe Nifty 50 index has officially broken below a crucial support zone, completing a classic Head & Shoulders reversal pattern on the 1-hour chart. This bearish structure normally appears at the top of an uptrend and indicates a potential trend reversal — and that’s exactly what the current setup suggests.
Key Technical Highlights
The Left Shoulder, Head, and Right Shoulder are clearly visible.
Nifty attempted multiple bounces from the Neckline support zone (around 25,850–25,900) but faile
Nifty 50 Price Structure Analysis [09/12/2025: Tuesday] Top-Down Nifty 50 price structure analysis for 09th December 2025. The day is Tuesday.
(1) Monthly Time Frame:
Red indecisive candle. Major resistance is at level 26100. Minor support is at level 25900. The view is indecisive to bearish.
(2) Weekly Time Frame:
First day of the week. Today's red candle confirms that last week's red paper umbrella was a hanging man. Clear sign of trend reversal. Major resistance is at level 26100. Minor support is at level 25900. The view is bearish.
(3