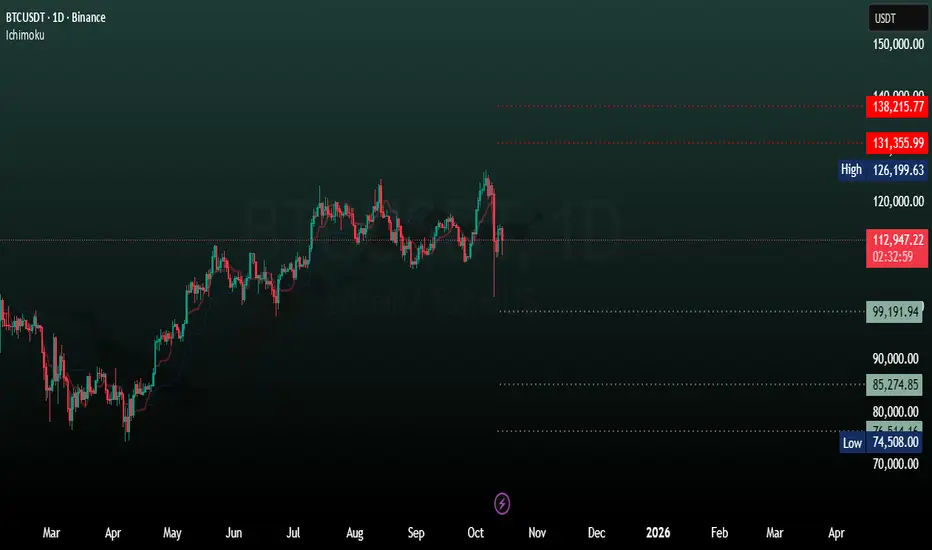
Analysis of the Ichimoku Kumo Cloud📋 Executive Summary
The Ichimoku Kumo Cloud is presented as a critical tool for improving trading outcomes 📈 by providing detailed information on market trends, momentum, and potential reversals. The analysis highlights that the cloud's thickness is a primary indicator of momentum; thin clouds signify a strong trend 💪, while thick clouds indicate weakening momentum 📉 and an impending range-bound market. A thickening cloud, particularly when accompanied by a flat Span B, is a strong signal for the end of a trend 🛑. Furthermore, the characteristics of a "cloud switch," specifically the proximity between the switch and its associated cross, can be used to gauge the strength of a forthcoming trend reversal 🔄.
⚙️ Core Functions of the Ichimoku Kumo Cloud
The Kumo Cloud is an instrument designed to help traders navigate complex market conditions 🧭. Its application addresses several common trading challenges, including:
• 📈 Trend Identification: Determining the current direction of the market.
• ↔️ Range Detection: Identifying when the market is entering a period of consolidation or "range."
• 🔄 Trend Reversal: Pinpointing when a prevailing trend is likely to change direction.
🔍 Interpreting Cloud Dynamics and Market Momentum
The physical characteristics of the Kumo Cloud provide direct insights into the strength and momentum of a market trend.
☁️ Cloud Thickness as a Momentum Indicator
• 🎋 Thin and Shaded Cloud: A cloud that is thin and appears shaded is an indicator of strong momentum within the current trend.
• 🌫️ Thick Cloud: As the cloud thickens, it signifies a decrease in momentum and a weakening of the preceding trend.
🛡️ The Cloud as Support and Resistance
• A thick cloud acts as a more formidable level of support or resistance against price action compared to a thin cloud.
📊 Identifying Range-Bound Markets
The transition from a trending market to a ranging one can be identified by observing specific changes in the Kumo Cloud's structure.
• 🚨 Primary Signal: A progressive thickening of the cloud is a sign of weakness in the prior trend and suggests the onset of a ranging period.
• ✅ Confirmation Signal: When the thickening of the cloud is accompanied by a flattening of Span B, it serves as a strong indication that the trend is concluding and a range is beginning.
• 🔄 Price Behavior: Within a thick cloud, price often consolidates and moves sideways. This "playing" within the range continues until the cloud begins to thin, at which point a clearer directional path for the price is likely to emerge.
🔄 Analyzing Trend Reversals: The Cloud Switch
The "cloud switch" (or twist) is a key event for identifying potential trend reversals. While noted as a more specialized area of analysis, certain principles can be applied to determine the strength of the reversal.
🧩 Elements of a Reversal Analysis
The analysis of a trend reversal involves observing several factors in concert:
• The cloud switch itself.
• The shape of the cloud during the switch.
• The crosses that occur within that specific area.
💪 Gauging the Strength of a Reversal
A crucial rule for determining the power of an impending reversal is the relationship between the cloud switch and the cross.
📏 Proximity of Switch and Cross: Implication for Reversal
Close Together: 💪 Stronger Reversal Trend
Far Apart: 😓 Weaker Reversal Trend
Ichimoku Cloud
TLT: NO ONE is betting on thisI don't call recessions and I'm not calling one now. But I do call charts. And this chart is saying something never seen before in NASDAQ:TLT history but a setup I've seen infrequently but often enough in tickers.
TLT is within the longest bear market to consolidation transition in its history. Six years of downtrend from the 2020 highs into a 2.4-year consolidation between $82.42 and $101.64. That's never happened in this ETF. Not even close.
Look at the daily structure. What jumps out isn't the range — it's the compression. The 60-day range just squeezed to $4.43. That's the tightest it's been during the ENTIRE 2.4-year consolidation. Price is coiling. The longer a consolidation lasts and the tighter it gets, the more violent the move when it breaks.
This isn't my opinion — it's how markets work. Price abhors a consolidation.
And where is price sitting right now? At the 52-week 50% retracement. To the penny. $88.69 level, price at $88.73.
The 2H Spike — My Timing Element
This is how I found the trade. My spike indicator fired on the 2-hour chart right at the 52-week 50% level. For those unfamiliar with how I use spikes: they're not signals to blindly buy. They're attention grabbers. The spike says "something is happening here" and then I look at the structure around it to decide if it's worth a trade.
In this case: spike at 50%, inside the tightest consolidation in history, with IV at 12.7% (near the floor for TLT options). If this thing moves, not only do I benefit from direction — I get a vega kicker as implied volatility expands. The options market is pricing in "nothing will happen." That's exactly when I want to be long options.
If price breaks below the spike next week, I know my timing wasn't perfect. That's the beauty of a defined-risk entry.
2019: What "can" happen
TLT *can* move. The market seems to have forgotten.
Now here's why I care about this consolidation breaking. Pull up TLT in 2019. From June to September, TLT rallied from $121 to $148 — a +22% move in three months. Flight to quality during recession fears + a Fed pivot.
I looked at 22 TLT rallies of 8%+ since 2003. The median rally: +10.9% in 47 days. 73% of them reached +10%. Nearly a third reached +12%.
I'm not predicting a 2019-style move. But I am positioning to be there if it happens. Because after 6 years of bear market and the tightest consolidation in TLT history... if this breaks up, it could be the biggest bond move in years.
The Trade
LEAPS. Jan 2027 $91 Calls. 315 days to expiry. Defined risk — max loss is the premium paid, nothing more. No margin. No stress. Just a position that says: I think bonds can move, nobody else does, and the options are cheap enough that the risk/reward is asymmetric.
If TLT rallies 10% to ~$97.60, these calls are worth roughly 3.7x my entry.
If I'm wrong, I lose the premium and move on.
Price abhors a consolidation. Especially one this long.
The Two Golden Rules for Validating Crossovers1. 🚀 Introduction: Unlocking the Power of Ichimoku Crossovers
Welcome to your study of the Ichimoku Kinko Hyo system. If you've ever looked at a trading chart and felt overwhelmed by the lines and indicators, you're in the right place. ✨ The Ichimoku system's true strength lies in knowing how to read its signals correctly.
This guide is designed to bring you clarity by teaching two simple but powerful "golden rules" 🥇🥇 for identifying high-validity trading signals known as crossovers. By mastering these foundational principles, you can learn to filter out market noise 🔇 and focus on higher-quality opportunities.
Let's begin by exploring the first rule, which focuses on the critical relationship between the price candle 🕯️ and the crossover event itself.
2. 🥇 The First Golden Rule: Match the Candle to the Cross
The first principle for validating a crossover is simple: for a signal to be considered strong 💪, the price candle that forms as the crossover occurs must be moving in the same direction as the crossover. This alignment signifies confirmation ✅ and momentum behind the move. A misaligned candle (e.g., a bearish candle during a bullish crossover) signals indecision ❓ or a potential "false cross" ❌, as the immediate price action contradicts the indicator's signal.
Here's how it works for both scenarios:
📈 Bullish Crossover: A strong bullish (upward) crossover is validated when it is accompanied by a bullish candle (a candle showing price moving up ⬆️). This indicates that buying pressure is present right as the signal occurs, reinforcing the upward momentum.
📉 Bearish Crossover: A strong bearish (downward) crossover is validated when it is accompanied by a bearish candle (a candle showing price moving down ⬇️). This shows that selling pressure is driving the market at the moment of the signal, confirming the potential for a downward move.
This first rule ensures that the market's immediate price action supports the signal. Now, let's add another layer of confirmation with our second golden rule. 🎯
3. 🥈 The Second Golden Rule: The Decisive Kijun-sen Break
It's not enough for the candle to simply match the crossover's direction; how it interacts with a key Ichimoku component—the Kijun-sen (or Base Line) 📍—is critical for validation. This rule adds a level of strictness that helps filter out weak or false signals.
The specific action required is a clean break through the Kijun-sen line. 💥
🔻 For a Bearish Crossover: A bearish candle must definitively break down through the Kijun-sen line. This action demonstrates that sellers have enough force not only to push the price down but also to overcome the significant support/resistance level represented by the Kijun-sen. 🛡️⬇️
🔺 For a Bullish Crossover: Conversely, a bullish candle must definitively break up through the Kijun-sen line. This shows that buyers have strong momentum, decisively pushing the price past this key line of resistance. 🚀⬆️
Now that we have established both rules individually, let's combine them into a simple framework for identifying high-validity crossovers. 🧩
4. 🎯 Your Next Steps
These two rules provide a foundational technique used by Ichimoku traders to filter for higher-quality signals and improve their analysis. By requiring both the candle's direction and its interaction with the Kijun-sen to align with the crossover, you can build greater confidence 💯 in the signals you identify.
The next step is to open up a chart 📊 and begin practicing. Look for past crossovers and see if they meet these two criteria. As you train your eye 👁️, what once seemed complex will become clearer. Save this guide 💾, as its points are golden 🥇 and profitable. 💰
Bitcoin: Begun the relief rally it hasGoing back to my roots and looking at Ichimoku cloud breakouts. I've been looking to the 50% Retracement of the last big move down on INDEX:BTCUSD for a pullback to test it. On the 4-hour timeframe price action has setup a structural breakout that could conquer the recent consolidation.
On the higher timeframe (Daily) view:
In order to fully recover from the bear cycle Bitcoin is presently enduring it has to likewise perform an Ichimoku Cloud breakout on the Daily timeframe. The Daily Ichimoku Cloud breakout is one of the most reliable signals going back through Bitcoin's history for bullish and bearish trends. Above 79k that defines the Daily Resistance is the Volume Profile level of 87.5k.
Trade wisely.
TSEM - Hammer at EMA 50 Confirms Bullish Trend ContinuationTSEM - CURRENT PRICE : 133.58
📈 TSEM – Technical Buy Call (Hammer at EMA 50)
Tower Semiconductor (TSEM) remains in a strong uptrend, with price holding above EMA 200 (long-term bullish) and above EMA 50 (medium-term bullish). The recent hammer candle near EMA 50 signals strong buying interest and rejection of lower prices. Importantly, price has been staying above the Ichimoku Cloud since May 2025, confirming a sustained bullish trend. RSI remains above 50, supporting positive momentum.
According to data from the Moomoo platform, major Wall Street analysts have upgraded the stock, with price targets revised higher to a range of USD 140–180.
ENTRY PRICE : 130.00 - 133.58
FIRST TARGET : 154.00
SECOND TARGET : 170.00
SUPPORT : 114.53 (the low of 04 FEB 2026 candle)
Bitcoin: Weekly Ichimoku Bear Trend ConfirmedThe Bitcoin INDEX:BTCUSD Weekly Bullish trend has officially ended per Ichimoku with both price and Chikou closing outside the cloud on the bearish side.
This is the complete inversion of the trend's start around the same time as the Blackrock Bitcoin ETF NASDAQ:IBIT launch.
Why is this signal important? I have studied and written about the high efficacy of Bitcoin's Daily Ichimoku trend strategy for over a decade. The weekly signal is naturally more infrequent (only 3 cases before) but every single time has been the precursor to bearish trend continuations -43% to -55%:
From the closing weekly price that fired the signal the ETF launch price ~$43k is -44% below. This will be a reasonable place to look for a bottom based on historic signals.
This is also in line with my long standing expectation that the bear cycle will be a -65% Retracement from the All Time High.
AMAZON - EMA 200: Where Institutions Step InAMZN - CURRENT PRICE : 237.70
📈 AMZN — Institutional Support Holds, Momentum Breakout
AMZN continues to trade in a primary uptrend, with EMA 200 acting as a strong institutional accumulation zone. Multiple pullbacks toward the EMA 200 (highlighted in green) were met with immediate buying interest, confirming long-term demand.
Momentum is now turning bullish:
🔥Price has broken back above the Ichimoku Cloud, signaling trend resumption.
🔥RSI is crossing above the 60 level, a classic sign of bullish momentum acceleration.
This setup favors momentum traders looking to enter as the uptrend resumes.
ENTRY PRICE : 235.00 - 237.80
TARGET : 258.00 (All Time High level)
SUPPORT / INVALIDATION : EMA 200
📌 As long as price holds above EMA 200, the bullish structure remains intact.
ETHUSD finds support at Weekly Ichimoku CloudIt appears that ETHUSD, after quite a consolidative year in 2025, has found some support at the weekly Ichimoku Cloud. The Leading (Senkou) Span A appears to be crossing the Leading (Senkou) Span B in the first week of January 2026. That is a more bullish type of cloud support.
So it appears that the sideways chop for the last few weeks might be prices finally stabilizing after a significant -47.13% decline over the past few months. Note that ETH also declined about -66% in the first part of 2025.
It could be that ETH has another correction later in 2026, and its volatility isn't atypical at all.
For now, ETH looks poised to move higher into Q1, either into the bullish Ichimoku Cloud or perhaps even above it towards $3700 - $4000.
Finally, the Lagging Span also found support over the past few weeks at the price candles in July 2025. The Lagging Span tracks current price closes but moves them backward in time 26 periods, and offers some insights about support and resistance levels.
Happy New Year, and as always, trade with a plan and do your own research!
TVTX - Breaks a 10-Year High – A New Chapter BeginsTVTX - CURRENT PRICE : 38.21
TVTX has made a major technical breakout by moving above its 10-year high at $37.04, a level last seen in August 2015. This move places the stock firmly into price discovery, meaning there is no nearby historical resistance overhead. Importantly, the breakout is holding, with the previous resistance now acting as strong support, a key sign of a healthy and sustainable uptrend.
Looking back, the 24 December breakout can be viewed as an ascending triangle breakout, where price consistently made higher lows before finally pushing above resistance. This pattern often signals strong accumulation and continuation rather than a short-term spike. Trend indicators remain supportive, with price trading above the EMA 50 and above the Ichimoku Cloud, both pointing to a well-established bullish trend.
From a price action perspective, the latest candlestick structure has formed a Bullish Harami based on Japanese candlestick analysis , suggesting selling pressure is fading and buyers may be preparing for the next move higher. As long as TVTX continues to hold above the former resistance zone and the EMA 50 on a daily closing basis, pullbacks are considered buy-on-dip opportunities. The next upside targets are $42 followed by $45, while a daily close below the EMA 50 would invalidate the bullish setup and serves as a cut-loss level.
ENTRY PRICE : 38.21
FIRST TARGET : 42.00
SECOND TARGET : 45.00
SUPPORT : EMA 50 (Cutloss if price closed below EMA 50)
Bitcoin Price History RhymesAs I look at the chart for CRYPTO:BTCUSD on the Weekly timeframe with Ichimoku overlayed the similarities to the 2021-2022 cycle top are eerie. Let's break down what I mean:
The key indicator of Ichimoku is price relative to the Kumo Cloud. A trend on the respective timeframe begins when price is above the cloud. I also use Chickou as momentum for confirmation. This means that the current Bull trend of Bitcoin began officially on the Weekly in November 2023.
The inverse to this rule is when price and momentum are on the opposite side of the cloud. The last Bear trend of Bitcoin began officially on the Weekly in May 2022.
So we can see how close Bitcoin is to true Bearish territory; getting below 80k and staying there for a prolonged time.
The other eerie similarity is the double false breakouts or "Spikes." If you learn ONE price action indicator remember the false breakout! There is no more reliable signal of reversal than when price makes a new high/low and then CLOSES back inside the prior range.
Once again this year as in 2021 there were two such signals weeks apart. It means that the market stopped buying at critical moments where breakouts should have occurred if price were to continue. These false breakouts are past being tradeable now but everyone should take note of just how frequent and reliable these instances are.
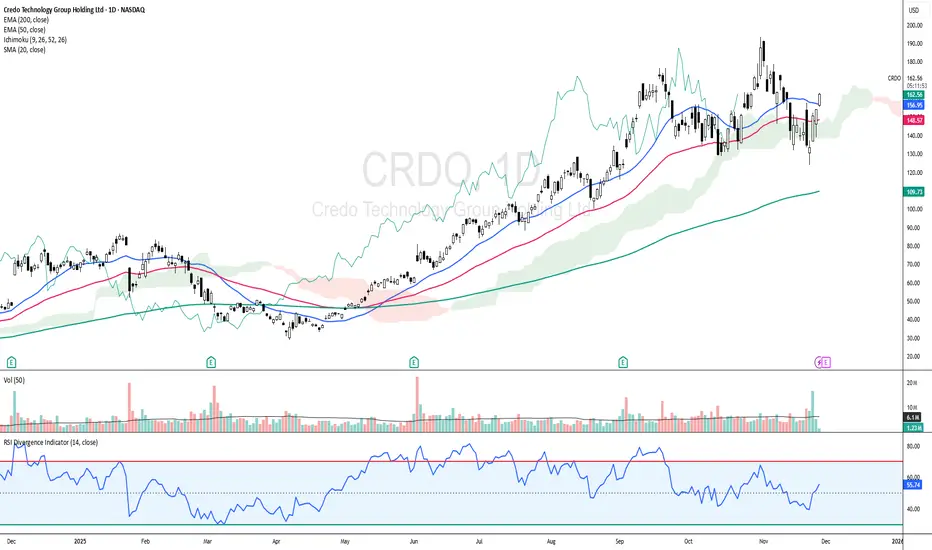
CRDO: Cloud + EMAs Aligning for Upside ContinuationCRDO - CURRENT PRICE : 162.95
CRDO is showing a bullish reversal setup as price rebounds and closes back above the EMA50 while holding firmly above the Ichimoku Cloud , signaling the major trend remains intact. Momentum is improving with RSI rising above 50 and not yet overbought, supported by increasing volume on the recent bullish white candlestick.
Today’s move above the 20-day SMA adds a positive layer to the short-term trend structure. Short term targets are 175.00 and 185.00 while support is 148.00.
ENTRY PRICE : 160.00 - 162.95
FIRST TARGET : 175.00
SECOND TARGET : 1.85
SUPPORT : 148.00
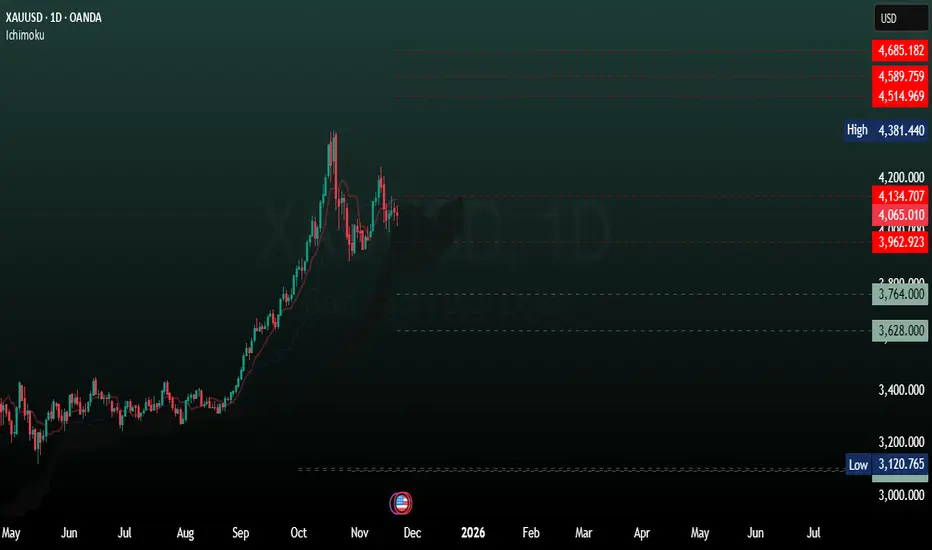
XAUUSD Daily AnalysisBased on ichimoku's data XAUUSD long-term trend is still bulish.
Xauusd is in the short-term downward trend.
if it cannot break through the support level (3962) with ichimoku elements, it will change its direction to resistence levels, but if it can, it will continue to highlighted support levels which are very important for gold and you can consider it as long-term support zones.
Long Term Bitcoin ForecastAlways early, never in doubt
I have already exited my Bitcoin related ( NASDAQ:IBIT Puts) shorts and NASDAQ:MSTR Puts. I felt confident I would be early as that that is my habit. There will undoubtably be a relief rally at some point that I may re-enter. My long term forecast is that the bull phase of the Halvening price cycle has ended and the bear phase has begun. Let's break down each price action component I am watching...
First let's take a step back to learn why we got here.
The false breakout or "Spike" as I call them are one of the most trustworthy signals that I trade. If you study one single element of price action it should be this. When price fails to close above a prior ATH (or below a major low) this is the highest probability of a reversal. Market psychology is on display that traders refused to continue the rally and now many are "trapped". This was the reason for the mass liquidations in October that started this bear trend. Many thought a breakout was in order but the confirmation failed.
One day after the "Trump tweet" the Daily Ichimoku Cloud trend confirmed bearish. This is another indicator of Bitcoin's trend that has been useful for all of Bitcoin's history. It is also what we will evaluate later on the Weekly.
At this point the most important level to watch is the 50% Retracement for the entire bull phase going back to November 2022 low. There are Volume Profile levels to watch but we assume that price will retest the 50% and evaluate what will happen in the Ichimoku Cloud trend context there.
Back in April 2025, when price on the Weekly made a move to the Weekly Ichimoku Cloud, price never hit or got inside the cloud nor did Momentum have a reasonable chance of crossing into bearish. "This time it's different" because if price does test the 50% Retracement it will signal full bearish trend confirmation on the Weekly timeframe.
During the last cycle, the bearish trend ended when the timing element of the Monthly Ichomoku cloud turned upwards. There is a similar timing element on the Monthly now in November 2026.
My fundamental, market psychology based speculation is that the ETF buyers from January 2023 must have their patience tested. That price is around 43k.
TL:DR;
Price will trend bearish down to 43k with the bear phase ending around November 2026.
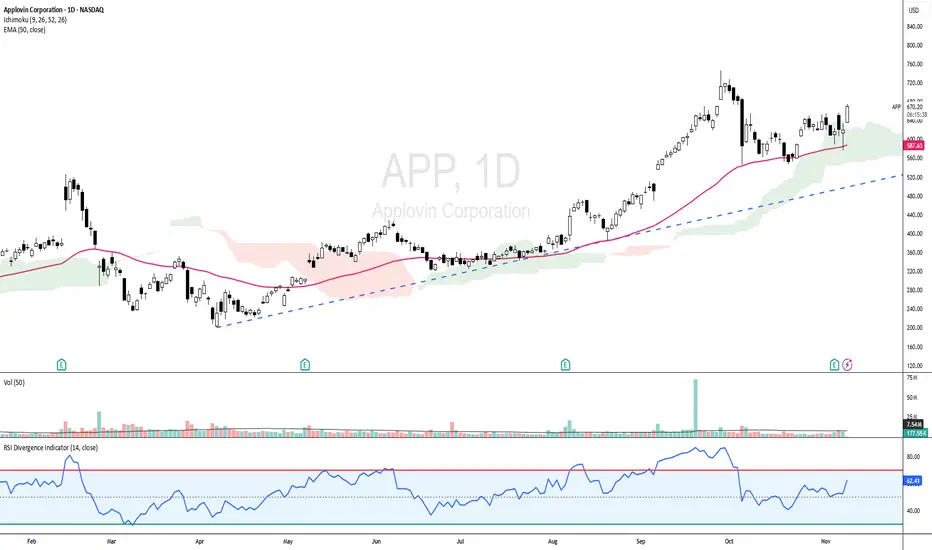
APP - UPTREND STILL INTACT!APP - CURRENT PRICE : 670.00 - 674.00
APP is showing strong bullish momentum as the price trades above the 50-day EMA and ICHIMOKU CLOUD , indicating a sustained uptrend. The RSI is in bullish territory but not yet overbought, indicating room for further upside. With the current setup, the stock has potential to retest its all-time high area if momentum continues.
ENTRY PRICE : 670.00 - 674.00
FIRST TARGET : 727.00
SECOND TARGET : 770.00
SUPPORT : 50-day EMA
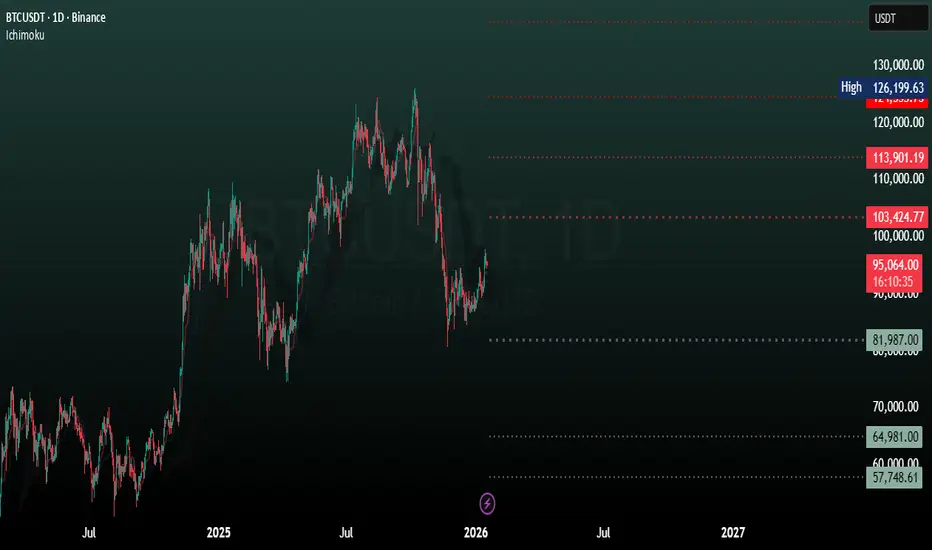
Bitcoin (BTC), End of Cycle Season Based on Cycle DurationBINANCE:BTCUSDT
Bitcoin appears to have already formed its peak within the current bullish cycle and may now be preparing for a correction.
Alternatively, if BTC makes another attempt to reach a new all-time high within October, that period could mark the final peak of this cycle.
Looking at historical data, Bitcoin has shown a repeating pattern —
an uptrend lasting approximately 3 years and 11 months (1,065 days) from the bottom,
followed by a downtrend of about 1 year (365 days) from the peak.
During down cycles, the cycle low has typically formed between the EMA 50 and EMA 100.
Backtesting monthly charts shows that Bitcoin often breaks below the EMA 50, finds support above the EMA 100, and then breaks through the Ichimoku Cloud, signaling the start of a new bullish cycle.
Become an early follower and be part of the journey.🚀
I am Korean and I used Google Translate.
ETH Elliott Wave - WXY Correction Complete soon!This chart analyzes Ethereum (ETHUSD) at the conclusion phase of a major WXY corrective structure, highlighting the technical environment for a new impulsive wave sequence. Price action is assessed using multiple technical indicators:
Elliott Wave Structure: The chart maps a completed 1-2-3-4-5 impulse, followed by W–X–Y corrective waves. The final Y leg approaches the critical Point 4 support, maintaining overall cycle validity and setting the stage for significant trend reversal once completed.
Ichimoku Cloud: ETH price is currently testing the lower bounds of the Ichimoku cloud, reinforcing a major support zone. A close above the cloud would further validate trend reversal; a breakdown would signal extended bearish pressure.
Volume Profile: Recent sessions show a spike in trading volume as price approaches historical support levels, indicating potential capitulation and increased probability of trend exhaustion.
Fibonacci Retracement: Key supports are identified at the 38.2%, 50%, and 61.8% levels, with the 38.2% zone (around $3,600) as a strong candidate for final Y wave completion based on confluence with cloud and momentum indicators.
RSI and Stochastic RSI: Both relative strength oscillators are in oversold territory, consistent with the final stages of a corrective structure. A bullish crossover or RSI divergence would strengthen the reversal thesis.
CVO/OBV: Volume-based momentum indicators confirm heavy participation during the latter stages of the sell-off, validating the probability of a strong bounce once buyers re-enter.
Scenario Outlook:
The analysis anticipates that, upon completion of the WXY correction—ideally above the Point 4 support (roughly $3,350)—Ethereum is set for a new impulsive uptrend as part of the final bull market rally. The setup favors strategic accumulation in the defined support zones, with projected upside targets ranging from previous all-time highs (~$4,950) to extended Fibonacci projections should the market move through a classical 1-2-3-4-5 impulsive wave.
Bitcoin range: 110k defended, 111.9–114k caps the upside__________________________________________________________________________________
Market Overview
__________________________________________________________________________________
BTC is consolidating above 108.7–109.0k after the pullback from ATH, capped under 111.9–114.0k. Short-term momentum is improving while 6H/12H remain corrective.
Momentum: 📈 Neutral-to-slightly bullish above 110k, but capped by 111.9–113.5k; 6H/12H still in a corrective trend.
Key levels:
- Resistances (HTF/MTF) : 111.9–113.5k (W/720 pivots), 114.0k (240 PL→R), 120.0k (W PH).
- Supports (HTF/MTF) : 110.0–110.2k (recent shelf), 108.7–109.0k (720 PL cluster), 107.3k (240 PL).
Volumes: Very high on 2H/1H/30m/15m; normal on 1D → credible rebound, not yet HTF-validated.
Multi-timeframe signals: 1D in NEUTRAL BUY above 108.7k; 12H/6H/4H trending down (sell-the-rips below 111.9–113.5k); STTF (2H/1H) improving on volume.
Risk On / Risk Off Indicator context: SELL (moderate risk-off) → contradicts the intraday bounce, so be cautious until 114.0k is reclaimed.
__________________________________________________________________________________
Trading Playbook
__________________________________________________________________________________
Compressed range: favor opportunistic executions at the edges; wait for confirmed breaks.
Global bias: Neutral-to-slightly long above 110k while 108.7k holds; swing invalidation on 1D close below 108.7k.
Opportunities:
- Defensive buy on 110.0–110.2k retest; target 111.9k then 113.5k if break confirms.
- Tactical sell on rejection at 111.9–113.5k; target 110.0k then 108.8k.
- Breakout buy if 12H/1D close >114.0k; target 117.4k.
Risk zones / invalidations:
- Loss of 108.7k on HTF close invalidates longs, opens 107.3k then 95.3k if weakness extends.
- Acceptance >114.0k invalidates most shorts, exposing 117.4k.
Macro catalysts (Twitter/News):
- Fed leaning to a 25bp cut (Sep 17 FOMC) with a bull steepener → supports dip buys if ISM/Jobs confirm.
- Gold at record (>3,500$/oz), softer USD, Asian equities broadly positive → mild tailwind for risk.
- Policy divergence (ECB dovish, BOJ cautious) + geopolitics → potential capping below 113.5–114.0k.
Action plan:
- Long Plan: Entry 110.0–110.2k / Stop 109.6k / TP1 111.4k, TP2 111.9k, TP3 113.5k (≈1.8–2.5R).
- Short Plan: Entry 112.0–113.0k on rejection / Stop 113.7k / TP1 110.0k, TP2 108.8k, TP3 107.3k (≈1.6–2.2R).
__________________________________________________________________________________
Multi-Timeframe Insights
__________________________________________________________________________________
Overall, timeframes are compressing: HTF resilient, MTF corrective, STTF recovering on strong volumes.
1D: Holding above 108.7–109.0k; acceptance >114.0k would open 117.4k then 120.0k.
12H/6H/4H: Lower highs/lows, favor sell-the-rips below 111.9–113.5k; rejection there likely retests 110.0k then 108.8k.
2H/1H/30m/15m: Strong-volume rebound; as long as 110k holds, a squeeze toward 111.9k then 113.5k is possible; losing 110k points back to 108.8k.
Key confluences: Multi-TF support 108.7–109.0k; ceiling 111.9–113.5k with 114.0k as decision level → compressed structure favors an imminent move.
__________________________________________________________________________________
Macro & On-Chain Drivers
__________________________________________________________________________________
Macro modestly supports dip-buys while background risk-off tempers upside; on-chain is neutral-to-cautious, aligned with the technical range.
Macro events: Markets price Fed cuts with a bull steepener; gold at record (>3,500$/oz), softer USD, Asia broadly green; ECB leaning dovish, BOJ cautious; upcoming US CPI/PMI/ISM and Jobs in focus.
Bitcoin analysis: Ichimoku Tenkan/Kumo as overhead resistance; key pivot 110.4–110.7k; some watch 103–100k on downside; ETFs saw net inflows in August despite -6.5% spot → ongoing institutional demand.
On-chain data: Large transfers (e.g., 7,860 BTC, 6,002 BTC) → potential liquidity/volatility; 6m/CTH cost basis near 107–108.9k as support; STH stress near 113.6k; no broad capitulation (SOPR ~1).
Expected impact: Confluence for a 108.7–113.6/114.0 range; easing bias may help a topside break if volumes persist, otherwise rallies cap below 114.0k.
__________________________________________________________________________________
Key Takeaways
__________________________________________________________________________________
BTC sits between 110k support and 111.9–114.0k resistance, with strong intraday volumes but a risk-off backdrop.
- Trend: neutral-to-slightly bullish above 110k, yet MTF remains corrective.
- Best setup: defensive long at 110.0–110.2k with <109.6k invalidation, or rejection short at 111.9–113.5k.
- Macro: Fed cut path and softer USD support dips, but caution below 114.0k.
Stay nimble: trade the edges and wait for a close >114.0k or <108.7k for direction. ⚠️