
Inside Bar

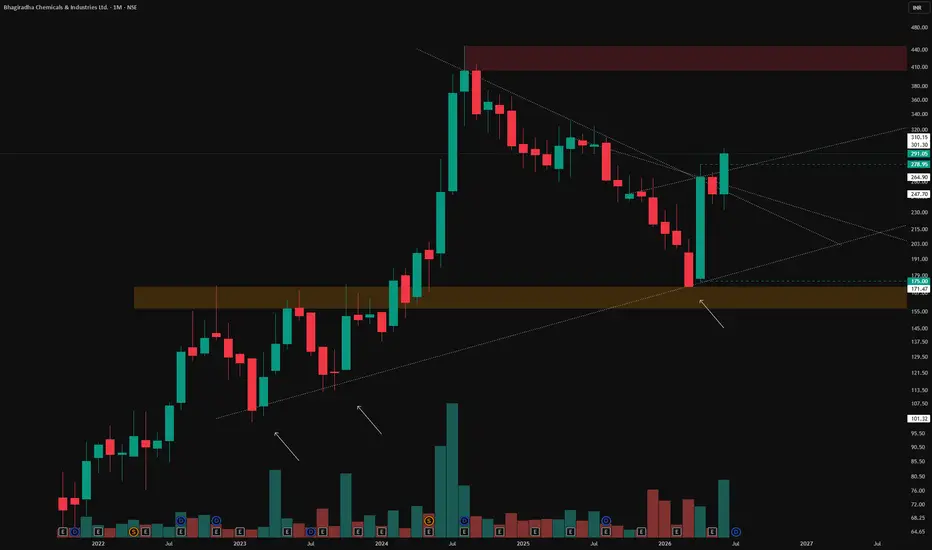
Monthly Structure terms : Trendline, Flip Zone & Mother Candle1. Monthly Timeframe
Each candle on this chart represents one full month of price action. The monthly timeframe filters out daily noise and shows the broader structural trend, making it the most reliable
2. The Trendline (White Line)
This trendline connects three genuine touches on the monthly chart, marked with arrows. Each touch shows price respecting the same rising support, confirming it as a valid, well-tested trendline rather than a randomly drawn line.
3. The Flip Zone (Orange Zone)
 Long
BUY TODAY SELL TOMORROW for 5% - BTST STOCK OPTIONAn explosive breakout pattern is forming on Tata Power Company Limited (TATAPOWER) on the daily time frame. We are looking at a high-probability BTST (Buy Today, Sell Tomorrow) or short-term swing opportunity based on a textbook Inside Bar breakout.
🔍 Technical Breakdown
The Setup: Following a strong directional move, Tata Power compressed into a tight consolidation range, forming multiple Inside Bars contained completely within the high and low of the mother candle (marked by the purple horizo
T

Markets are in a state of confusion - Range bound marketsI make educational content / concept based videos only .
I am only talking about the general trends of the index - no bias - no forecasting .
 Long

#ADANIPOWER – Double Top Danger Zone!📉⚡ #ADANIPOWER 🚨
ADANIPOWER has formed a monthly double top 🔝 near the 179–183 (ATH) zone and is now slipping toward its rising trendline 📉
Price is also trading inside the September monthly candle (182.70–120.00). MCB or sustained close below 120 will signal major weakness ⚠️👇
If selling continues, price may head toward 112.50–124, 92–96 , and the breakout retest supports at 83–87 .
Bulls must defend the trendline to avoid a deeper correction 🛡️🔥
Resistances: 151.20 / 179–183 (


How to Backtest, Create a Strategy and Execute a Trade In this video I have showed a good trade is executed with proper planning and mindset .
Charts Used in this video are older than 3 months . Only for educational content .
 Long

Master Inside Bar Strategy with this Twist ( Wtf edition )Learn how to create a simple strategy and simply backtest it on Trading view .
 Long

Balmer Lawrie cmp 224.11 by Daily Chart viewBalmer Lawrie cmp 224.11 by Daily Chart view
- Support Zone 203 to 215 Price Band
- Resistance Zone 203 to 215 Price Band
- Multiple Bullish Rounding Bottoms around Support Zone
- Both Falling Resistance Trendlines Breakout seems sustained
- Heavy Volumes surge on Friday post close sync with avg traded qty
- Upwards Price momentum has well respected the Rising Support Trendline
- [ b]*Inside Bar made on Friday closure, indicates observing caution either a Breakout or Breakdown*


Flag + W Pattern Combo on Monthly! | #SagCem On Radar🔍 #OnRadar
#SagCem (Sagar Cements Ltd.)
🚩 Flag + W Pattern Combo on Monthly!
📈 Chart Timeframe: Monthly & Quarterly (Educational Observation Only)
📊 Technical Structure Overview:
A rare confluence of bullish patterns spotted:
🚩 #FlagPattern — classic continuation structure
🔻🔻 #WPattern (Double Bottom) — bullish reversal signal
🔼 Both developing inside a long-term #AscendingChannel
🎯 Potential Pattern Projections:
Flag Target: 560+
W Pattern Target: 450+
🛡 Suppo
 Long

Inside Bar Reloaded: 5 Years of Silence Before the Storm?🔍 #OnRadar
#SagarCem (Sagar Cements Ltd.)
Inside Bar Reloaded: 5 Years of Silence Before the Storm?
CMP: 264
📊 Technical Structure (For Educational Purposes Only):
The stock has formed a repeating #InsideBar pattern, a price action setup often observed during consolidation phases.
🔄 Pattern History:
📍 Previously, the stock consolidated for 9 years within a defined Inside Bar range (also called the #MotherBar ) before giving a +240% breakout move .
📍 Currently, it's again
Long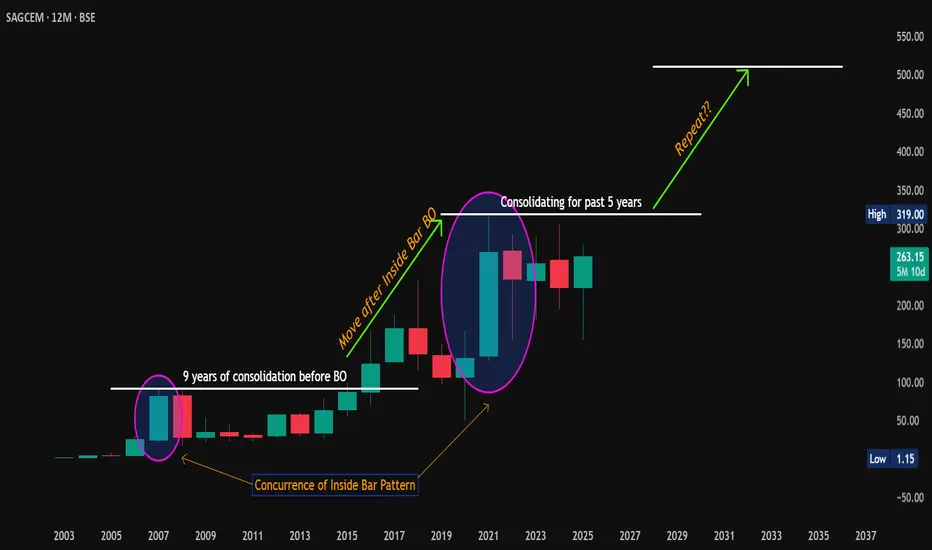
Powergrid - 10% Upmove possible?!!!Chart patterns suggest me the above titled opinion
1. Monthly chart shows a Mother baby candle (feb and march 2025)
2. Weekly chart too shows a good inside bar candle with good volume support and Breakout visible (shown below)
3. In daily time frame, there is an expanding channel pattern... . Higher high formed indicates a bulls edge .
4.Let's wait for the Breakout and enter the trade
5.Target levels mentioned @ chart.
This is just my opinion...not a tip nor advice...
Thank you!!!!
 Long

Inside Bar Ignites a Clean Breakout🟢 Simple Breakout Structure | Supply-Demand Flip
✅ Strong demand zone formed after multiple rejections
🔻 Previous supply zone clearly respected
📉 One active counter-trendline broken
🔍 Breakout of mother candle with an inside bar setup
📈 Volume expansion on breakout
🟠 Also broke a hidden resistance line, adding confluence
🧭 Chart structure remains smooth and clear, respecting zones well
No predictions. Just structure.
 Long

Precision Meets Patience | SAKSOFT Chart WTF🔻 A clean Control Trendline (CT) drawn from the all-time peak (🔺) on the Weekly Time Frame (WTF) shows a long-term price memory resistance finally getting tested.
📏 Overlapping that is a hidden horizontal resistance (⚪ dotted white line), representing the final hurdle before the stock can challenge the supply zone.
🟧 Mother Candle Structure: A powerful consolidation candle has now been broken with strength, giving us structure + intent in one move.
🔊 Volume speaks! We’ve seen two separate clu
 Long

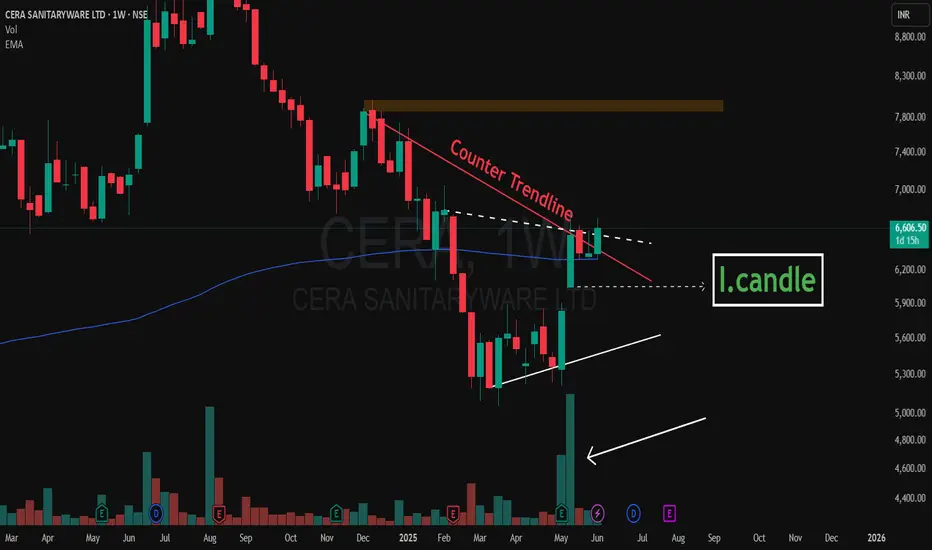
Inside Bars After High Volume – CERA Setting Up Near Key CT📌 Timeframe: Weekly (WTF)
📌 Type: Technical Observation / Swing Structure
📌 Concept: Counter Trendline Breakout Setup
CERA is currently navigating a highly constructive zone from a swing trading lens. Here's what's developing technically:
🔹 Higher Low Formation:
The stock has established a higher low structure, with the white internal trendline offering visible support across recent weeks. Interestingly, this aligns perfectly with the 200-period EMA on the weekly timeframe, enhancing its signi
 Long
2 Candlestick Patterns That Actually Work — when used right !Intro:
Most traders learn candlestick patterns from cheat sheets —
Engulfing, doji, hammer, shooting star…
But not all patterns are created equal.
The key isn’t memorizing names — it’s understanding which ones hold real weight when used with structure.
Here are 2 powerful candlestick patterns that can shift the game — if you know when to trust them.
⸻
1. The Rejection Wick with Body Close Inside Structure (a.k.a. Rejection Candle)
What It Looks Like:
• A long wick that pierces above/below
 Education

ADANIENT - Bulls getting ready to bump up ?????!!!Y essss!!! !
Chart patterns inculcating me the above titled opinion.
1. Monthly timeframe shows the symmetrical triangle pattern from 2020 till now, now the stock at support line(chart image shown below)
2. Weekly time frame shows us the INSIDE BAR candlestick pattern(mother baby pattern) with good volumes....with the low umtested till now.(made the low of 2025 on 22 nov 2024)
3. Daily time frame shows the Breakout attempt out of the 11 month old trendline.
4. Now, with the result
Long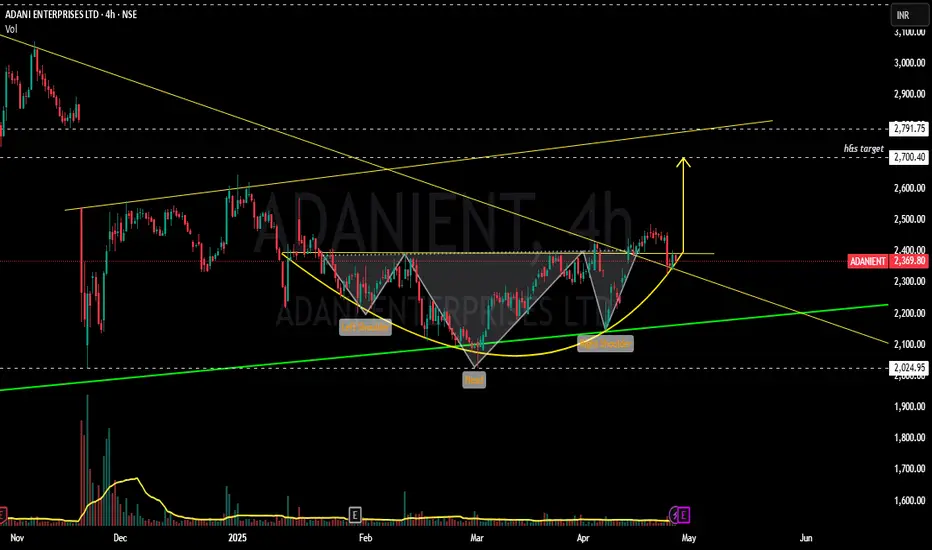
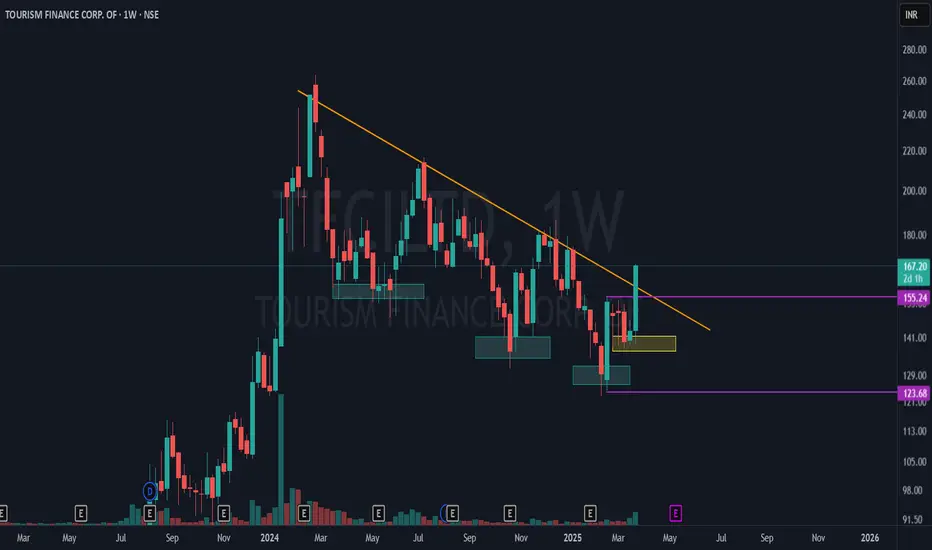
Tourism Finance Corp - Major Breakout in Progress!TFCI is showing a significant market structure shift on the weekly time frame (WTF) with strong confluence of technical signals! 📊
🔹 Lower Lows to Higher Low Transition:
Blue boxes indicate a series of lower lows, reflecting a prior downtrend.
The yellow box highlights a higher low, signaling a potential trend reversal!
🔹 Mother Candle Breakout:
The purple lines mark the high and low of the mother bar (key range).
Price is now breaking out from the upper side of the mother candle, confirming b
 Long
#SRF - Potential STAGE 1 Break Out (Multi Year Consolidation)📊 Script: SRF
Key highlights: 💡⚡
📈 STAGE 1 - Accumulation formation in Weekly chart.
📈 Price gave a good up move, then went Side Ways
📈 Multi year Price consolidation
📈 Multiple Inside Bars formed in Daily chart
📈 Enter on BO when spike in Volume is seen
📈 MACD Cross Over
📈 One can go for Swing Trade.
BUY ONLY ABOVE 2700 DCB
⏱️ C.M.P 📑💰- 2583
🟢 Target 🎯🏆 – NA%
⚠️ Stoploss ☠️🚫 – NA%
⚠️ Important: Always Exit the trade before any Event.
⚠️ Important: Always maintain your Risk & Reward Ratio.
 Long

2 Breakout trades for 25 Nov Markets I make educational content videos for swing / positional trading
 Long

3 Amazing swing trading ideas for 21 Nov Markets I make educational content videos for swing / positional trading
 Long

2 Amazing swing trading ideas for 17 October Markets I daily make educational content videos for swing / positional trading
 Long

 Long

Inside bar rises the bar Can go long above the high of the candle
safe traders can exit at the mentioned target
Stoploss can be little down at the previous swing low but its for high capital traders
 Long

bullish candle at the major supportGo long to capture some upward movement as inside candle appeared at
support line
 Long
