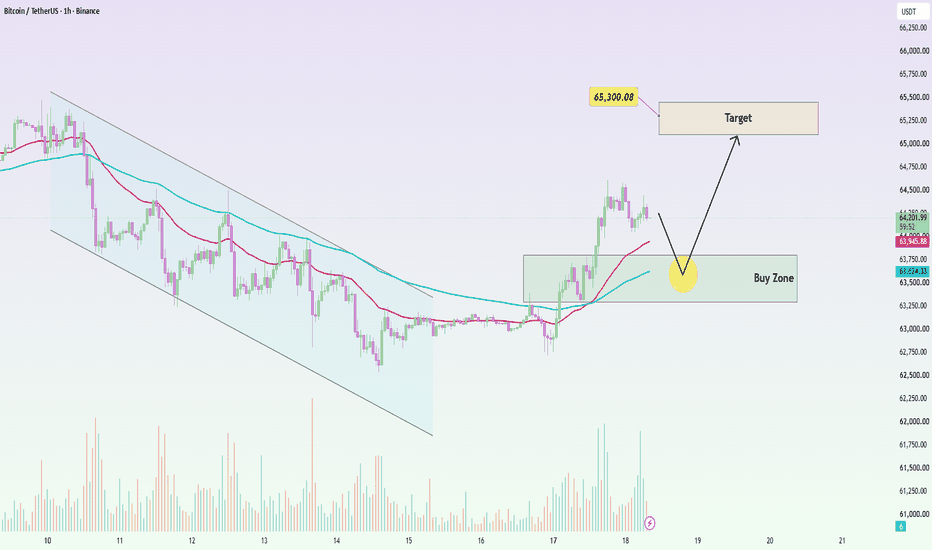
BTCUSDT: Buy Zone Holds, $65.3K Back FocusBTCUSDT is trading around $64,170, holding above the $63,250–$63,750 buy zone after breaking out of the previous descending channel.
The macro backdrop is slightly supportive. Expectations for a September Fed hike have fallen to around 35%, while the US Dollar remains weak.
Technically, price has reclaimed both short-term EMAs and is now consolidating above them. If the buy zone continues to hold, I favor another bullish push toward $65,000–$65,300.
A clear break below $63,250 would weaken th
M-pattern
XAUUSD: Holds Remains in SightXAUUSD is trading around $4,399, consolidating after the latest push toward $4,440. Price is now testing the $4,360–$4,390 support area, where EMA89 is also providing additional support.
The macro backdrop is mixed: fading September Fed-hike expectations and a soft US Dollar remain supportive for Gold, while rising Treasury yields are currently limiting upside momentum.
Technically, the bullish structure remains intact as long as buyers defend this support zone. If price holds and buying press
BSE Ltd. (1W) - Make or Break at Major Channel SupportOverview:
Looking at the Weekly (1W) timeframe for BSE Ltd. (NSE: BSE), the stock has been respecting a very well-defined, long-term ascending parallel channel. After a strong impulsive move to the upside that tested the upper boundary of this channel near the 4,400 - 4,500 levels, the stock has entered a corrective phase.
Technical Observations:
The Ascending Channel: The broader trend remains bullish as long as the price stays within this upward-sloping channel. Both the upper resistance li
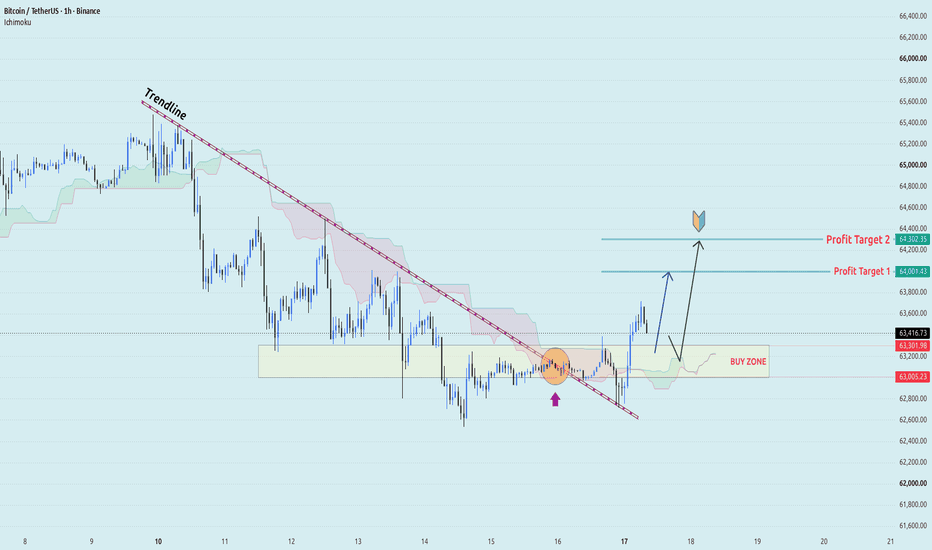
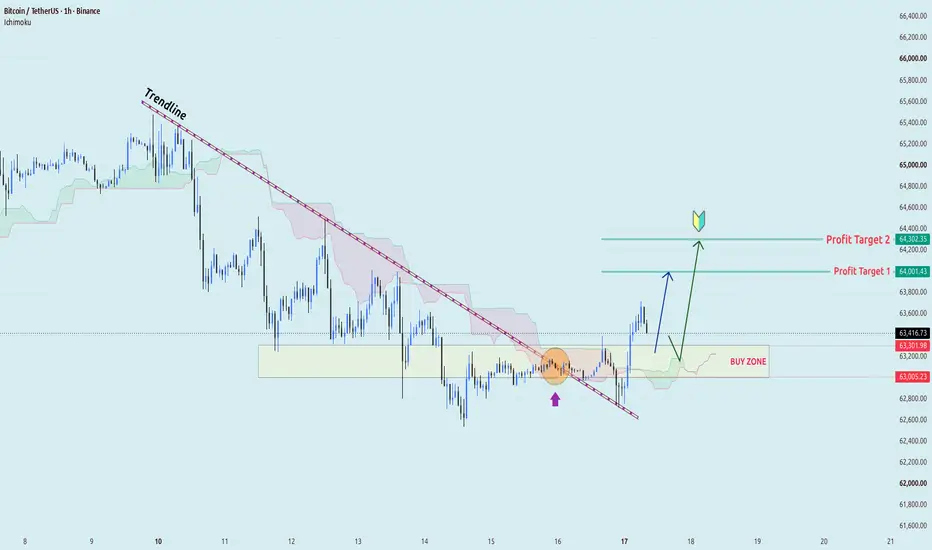
BTC/USDT - Breakout Trendline, 64K Becomes TargetHi traders, do you think this breakout is clean enough for BTC to continue its upward movement?
BTCUSDT has just broken above the short-term downtrend line and is currently holding around the 63,000–63,300 range. This is the area I want to watch most if the price retests.
If buyers continue to defend this area and the price stays above the Ichimoku cloud, I still favor a further upward pull:
🎯 Target 1: 64,000
🎯 Target 2: 64,300
Today's macroeconomic environment also provides slight suppo
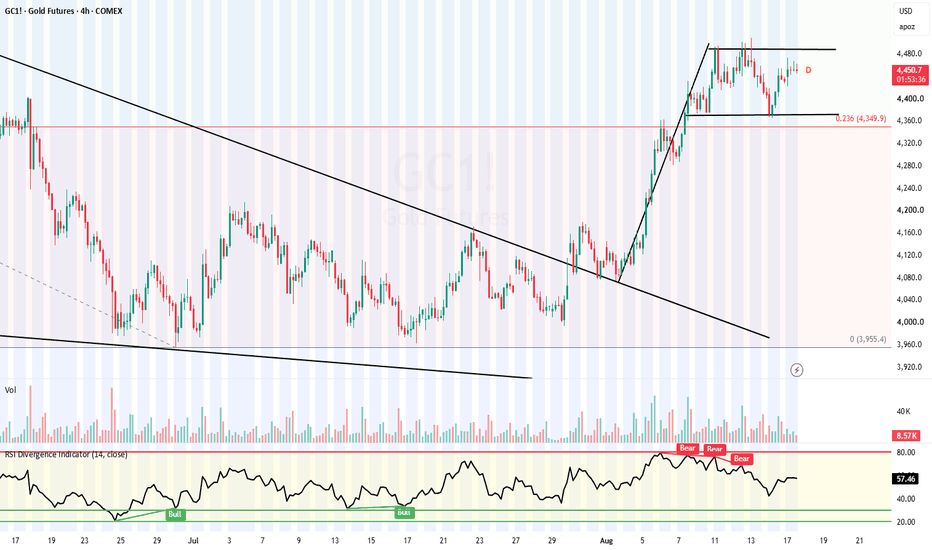
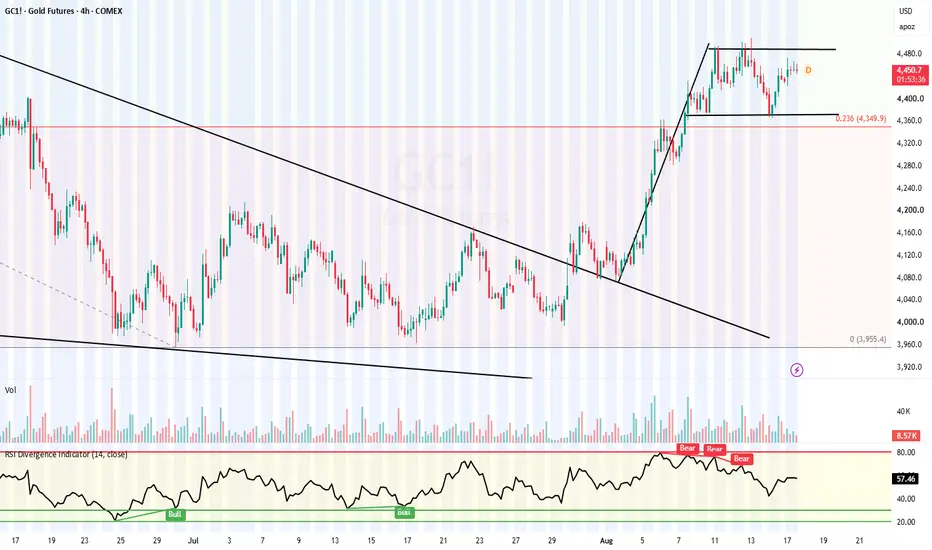
GOLD COMEX: Bullish Flag Pattern | Breakout Above $4490GOLD COMEX TECHNICAL ANALYSIS: BULLISH FLAG PATTERN | $4,370 SUPPORT & $4,490 BREAKOUT
GOLD COMEX — SHORT-TERM TECHNICAL VIEW
After the breakout from the Falling Wedge Pattern , Gold COMEX Futures witnessed a strong upward rally.
As discussed in our previous analysis, the 0.236 Fibonacci retracement level around $4,350 acted as an important support zone.
Previous Analysis:
CURRENT SETUP — 17 AUGUST 2026
On the 4-Hour Chart , Gold COMEX has formed a Bullish Flag Pattern follow
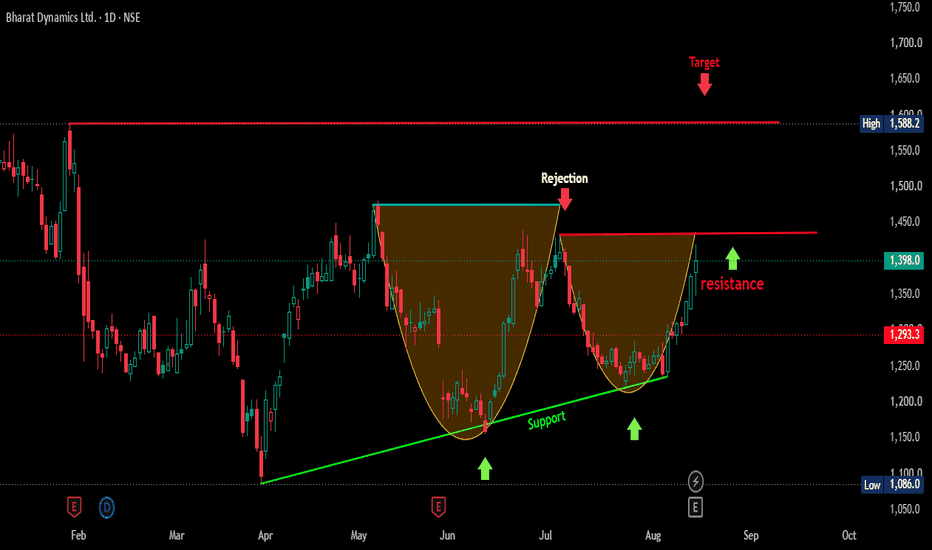
BDL Bullish Double Rounded Base | Breakout Setup(1D)BDL (Bharat Dynamics Limited)
Setup Type: Bullish Continuation / Breakout Setup
Technical Analysis & Chart Structure
Ascending Support Trendline (Higher Lows):
BDL has been respecting an upward-sloping trendline (highlighted in green), with buyers consistently stepping in at higher support levels (indicated by the green arrows).
This structure reflects steady accumulation and underlying bullish momentum.
Rounded Bottom Base Formati
BTCUSDT: Sell Zone, Price Under PressureBitcoin is currently trading around $63,600–$63,650, down approximately 0.35% for the day, having touched a low of $63,204.
Macroeconomic factors continue to favor a bearish scenario as the market awaits US CPI data. The DXY has edged up to around 99.9, while investor opinion remains split on whether the Fed will hold rates steady or hike them in September.
On the 2-hour (H2) chart, BTCUSDT has broken down from its rising channel and remains below the EMA34 and EMA89. The $64,000–$64,500 USDT
Hindustan Aeronautics Limited (HAL) Forming Inverse H&STurning our attention to the daily charts, we have a highly compelling technical setup developing in Hindustan Aeronautics Limited, commonly known as HAL.
As we can see on the daily timeframe, the stock has formed a textbook Inverted Head and Shoulders pattern. For our viewers tuning in, this is a classic technical indicator that typically signals a strong bullish reversal after a downtrend.
Let's break down the key components of this chart:
The Left Shoulder: The stock experienced an initial
Bank Nifty Daily Chart Analysis: Ascending Triangle Formation
Pattern Overview
On the daily (1D) timeframe, the Bank Nifty index is currently consolidating within a classic Ascending Triangle pattern. This is generally considered a bullish continuation pattern, indicating a potential upward breakout after a period of consolidation.
Key Technical Observations:
Horizontal Resistance (Top Line): The upper trendline highlights a clear and stubborn resistance zone. The price has tested this ceiling multiple times but has faced consistent selling pressure, c
Beneath the Surface: Flip Zones, Supply, and PatternsThis post is educational and observational in nature based on historical price action. It is not a forecast or a trading recommendation
Flip Zone (White zone)
A resistance zone that, once broken and sustained above, converted into support. This shift in character is what defines a flip zone, a level whose role changes from holding price down to holding price up.
Counter Trendline (White line)
A trendline drawn against the direction of the primary trend, used to track corrective or pullbac
NBCC BAT going to be BUTTERFLYHere this chart is expaining itself The pattern on the right is a Bullish Harmonic / AB=CD Continuation Pattern developing off the ₹80 bottom:
Initial Rebound to B: Following the reversal at ₹80, the price rallied to form peak B near ₹115.
Strong Resistance ("strong res"): The blue horizontal line at ₹115 acts as a major resistance zone that the price must clear to sustain momentum.
Higher Low at C: Price pulled back from ₹115 to form Point C around ₹90, bouncing off the 0.618 Fibonacci retr
How Monthly Structure Shapes Weekly Behavior🟢 This post is educational and observational in nature based on historical price action across multiple timeframes. It is not a forecast or a trading recommendation.
📈 Higher Timeframe
A higher timeframe refers to a chart view that compresses more time into each candle, such as monthly or weekly charts compared to daily or hourly ones. Higher timeframes tend to filter out short term noise and reveal the broader structural context a stock is trading within.
📏 Monthly Trendline
Marked in gree
The Flip Zone That Fueled a Flag and PoleChapter One: The Wall
Long before anything else happened on this chart, this zone was a wall. Every single time price rallied into it on the monthly timeframe, it got turned away. Sellers showed up like clockwork, supply absorbed demand, and price retreated.
Chapter Two: The Break
Then came the move that changed everything. Buyers finally had the strength to push through. But a breakout alone doesn't confirm a flip, it's what happens after that matters. Price came back down, tested that same
2 Top Class Bullish Patterns Explained Every chart tells a story, you just have to know where to look. Marked in white dotted lines above are two patterns that often show up right before a strong Bullish Patterns out of the world of Patterns and Lines, This Post is non Forecasting and Non Biased in Nature, Purely educational .
1. The Comeback Arc : Inverse Head & Shoulders
Picture the sellers pushing price down, then down again,deeper this time, into the "head." It looks like the bears are winning. But then something shifts. The
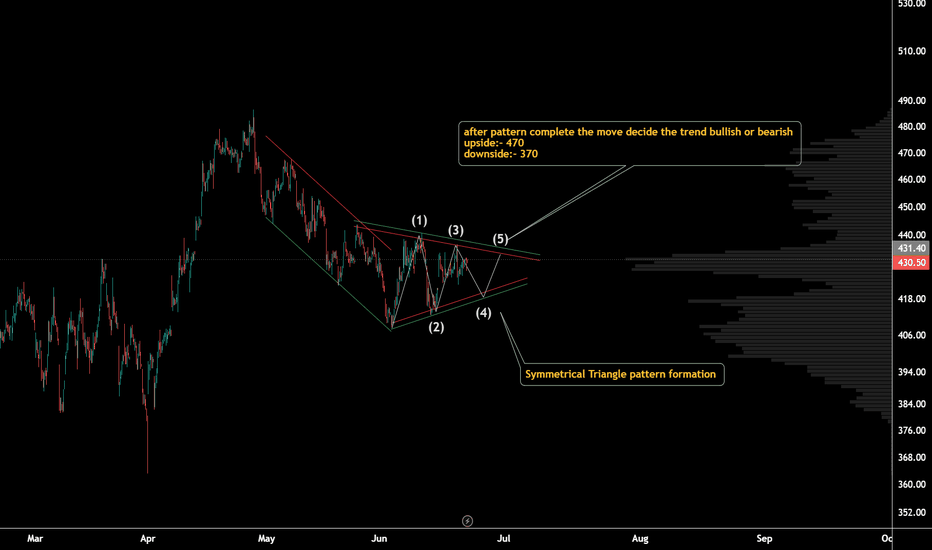
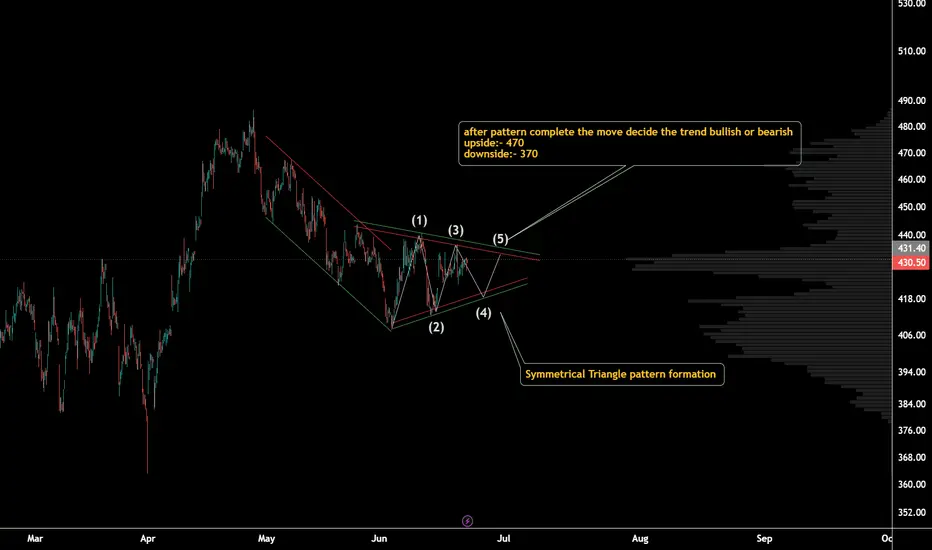
PFC: One Breakout Could Change EverythingTechnical Analysis: Symmetrical Triangle at a Critical Juncture
The stock is currently forming a Symmetrical Triangle, a classic continuation/indecision pattern that often precedes a significant breakout.
As price continues to compress between the converging trendlines, the next decisive move is likely to define the medium-term trend.
Key Levels to Watch:
Bullish Breakout: Sustained move above 420 could confirm bullish momentum and open the door for further upside.
Bearish Breakdown: A dec
Fair Value Gaps and Flag Patterns 📌 What Is a Fair Value Gap (FVG)?
A Fair Value Gap is one of those concepts that sounds complex but is beautifully simple once you see it.
When price moves so fast and so aggressively in one direction that it skips over a zone without proper two-sided trading, meaning buyers and sellers never truly met at those prices, it leaves behind an imbalance. That imbalance is called a Fair Value Gap.
A Bullish Fair Value Gap specifically forms during a strong upward move. It appears as a visible gap
What is the Importance of a Base Formation ? Technical Terms Explained :
Descending Triangle A bearish chart pattern normally but when made after a one sided move it can be a great overall bullish pattern, formed when price makes a series of lower highs while support remains flat. This means buyers are weakening — they can't push price higher each time, but sellers are consistently stepping in at lower levels unless the CT of this Pattern gets a Break which changes the Wind.
Counter Trendline
A trendline drawn against the dominant m
When the Chart Speaks Louder Than the News — A Monthly StructurePrice action on the monthly timeframe has a way of telling stories that shorter timeframes simply cannot.
This chart presents a classic Broadening Formation — a pattern defined by progressively lower lows and higher highs, creating an expanding range over time. The two boundary lines, one descending and one ascending, visually capture this expansion in volatility and indecision at a macro level. This structure reflects a market in disagreement, where neither buyers nor sellers have been able
From Shape Fall to V-Shape RecoveryFibonacci retracement drawn from the 0 to 100 level, anchored across the full swing range of the initial move. After that first impulsive leg up, the market entered a consolidation phase — a period where price moved sideways, digesting the prior move.
That consolidation eventually broke down. The market sliced through the 50% level, then failed to hold the 61.8% Golden Ratio, and finally breached the 70.6% mark as well. At that point, the structure had confirmed a fully bearish breakdown by eve
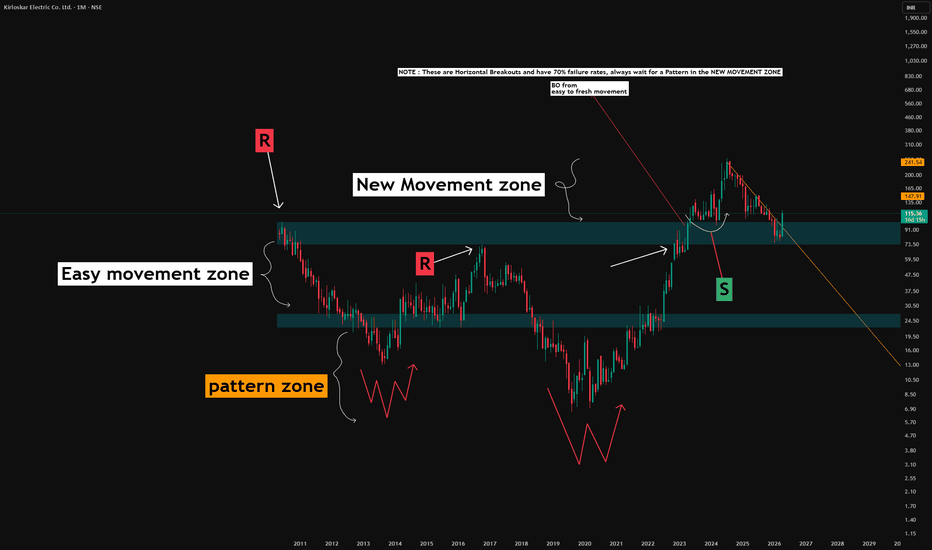
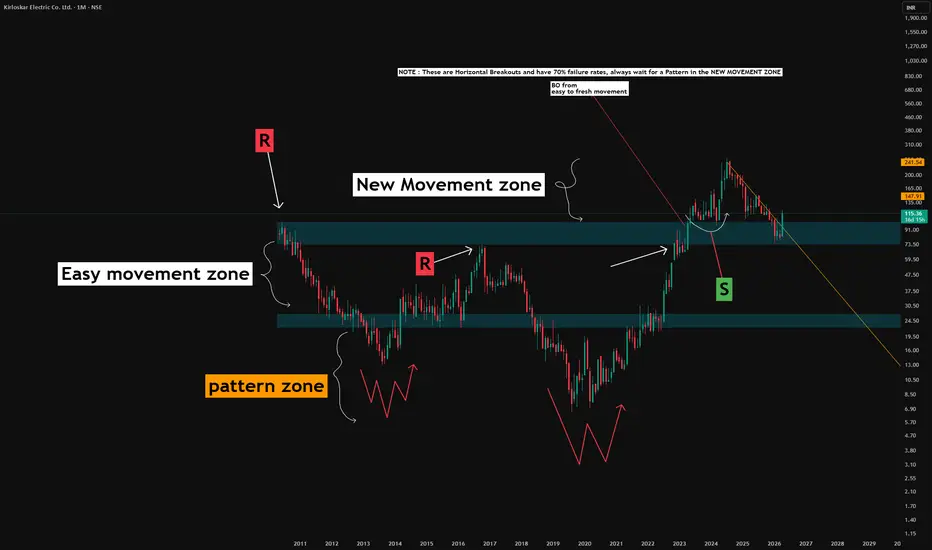
Three-Zone Framework: Know how to Read Market Structure( Guide )📊 Understanding the Three-Zone Framework | Structure Over Speculation
Markets don't move randomly — they move in structure. This chart breaks down a three-zone framework designed to help traders read price action more systematically, without relying on predictions or bias.
📌 Zone 1 — The Pattern Zone (Base of the Chart)
This is where price tends to spend considerable time building foundational structure. Classic patterns like Inverse Head & Shoulders or Double Bottoms are commonly observed he
INFY 1 Week Time Frame 📊 Current Context
As of recent sessions, the stock is trading around ~₹1,280‑1,295 on NSE.
📈 Weekly Timeframe Levels (Indicative)
🛑 Resistance Zones (Upside)
~₹1,330 – ₹1,340 – key short‑term resistance area
~₹1,350 – ₹1,360 / ₹1,370–₹1,380 – longer weekly supply zone (prior swing rejection region)
A sustained weekly close above ~₹1,330 / ₹1,350 would be the first step to weaken the bearish bias.
🟢 Support Zones (Downside)
~₹1,270 – ₹1,280 – immediate weekly support (around recent price area)
NZD/USD remains in bearish controlNZD/USD is struggling to recover from a four-day low around 0.5845.
✅ Fundamental Factors: USD Dominance & Antipodean Sentiment
NZD/USD's current movement is dictated by geopolitical dynamics and interest rate expectations:
- ⚡Safe-Haven USD: The escalation of conflict in the Middle East (day 10 of the US-Israel-Iran war) continues to push investors toward the US dollar. The Dollar Index (DXY) has now reached its highest level since November 2025.
- ⚡Energy Crisis & Inflation: Surging crude
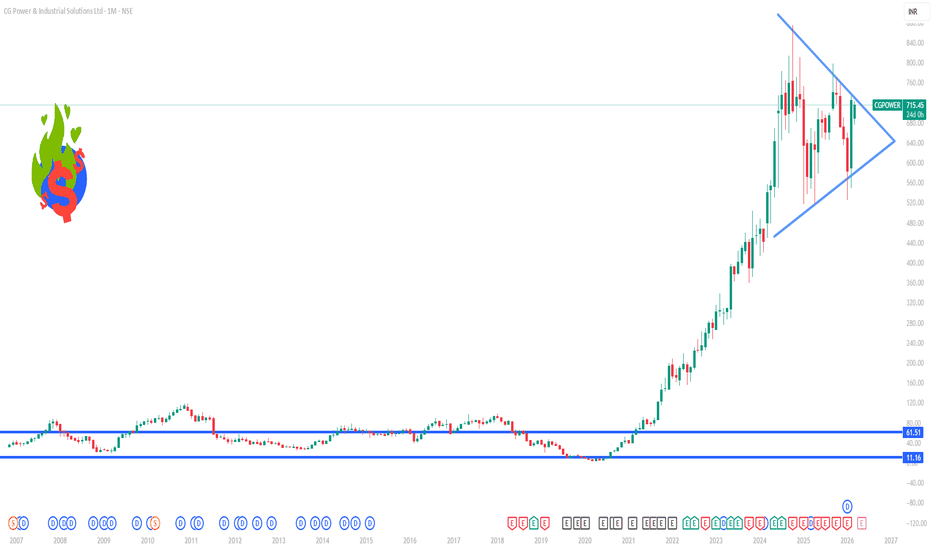
CGPOWER 1 Month Time Frame 📌 Current Price (Approx. Close on Mar 6, 2026)
~₹715–₹720 per share on the NSE/BSE at the last market close.
📊 1‑Month Price Range (Late Jan – Early Mar 2026)
Based on recent daily price history:
Highest in last month: ~₹733.70
Lowest in last month: ~₹676–₹680 (several sessions dipped near these levels)
Typical trading zone: ₹690 – ₹725
Daily data examples from February–March:
26 Feb 2026: ~₹726.75 high (intraday)
02 Mar 2026: ~₹719.20 high
04 Mar 2026: ~₹702.00–₹676.40 range for that
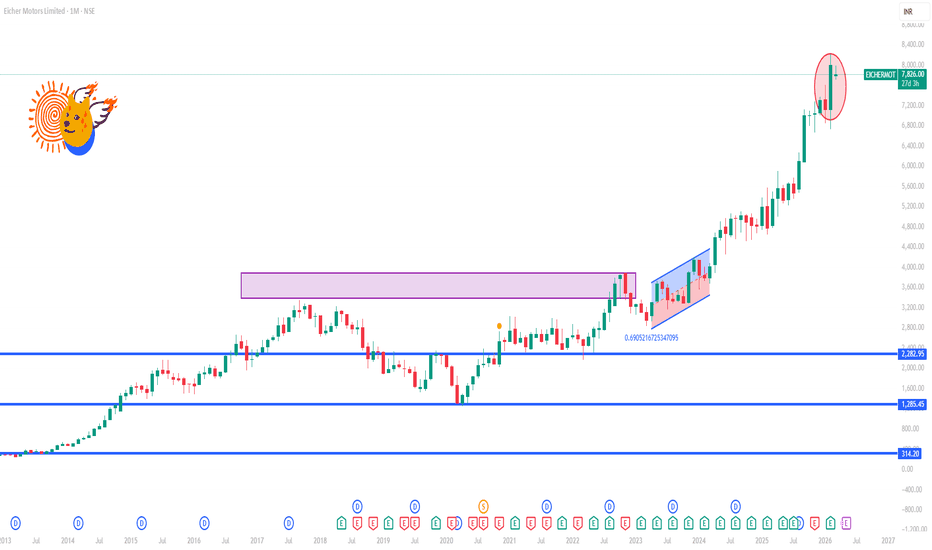
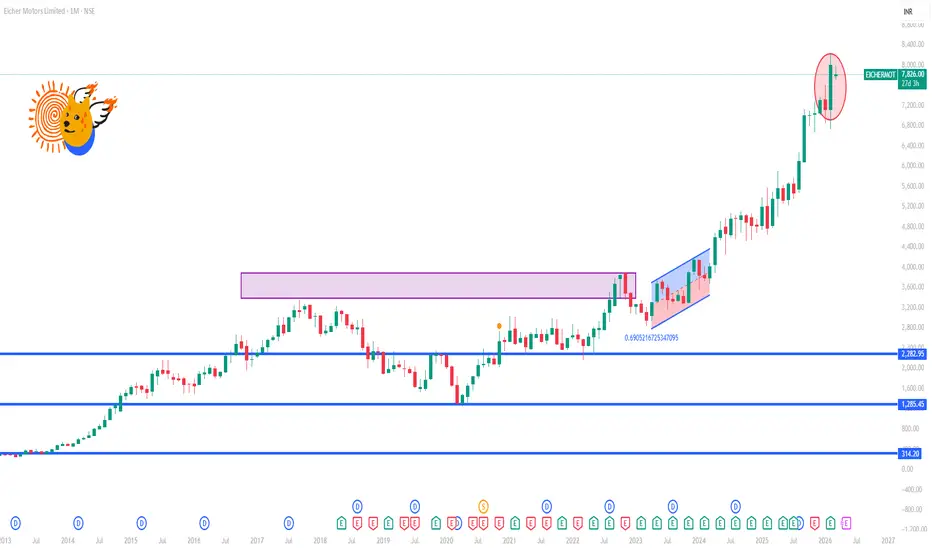
EICHERMOT 1 Month Time Frame 📌 Latest Price Snapshot (approx)
₹7,820 – ₹7,850 (current trading zone showing recent volatility & downside pressure).
1‑Month trend: ~+9–11% gain, but short‑term weakness seen due to market volatility.
📊 1‑Month Key Levels
🛑 Resistance (Upside Barriers)
These are levels where short‑term supply/selling pressure may appear:
₹7,976 – ₹8,000 — Immediate resistance (pivot‑based).
₹8,100 – ₹8,127 — Next resistance zone (~breakout region).
₹8,250 – ₹8,318 — Higher resistance / trend channel upp