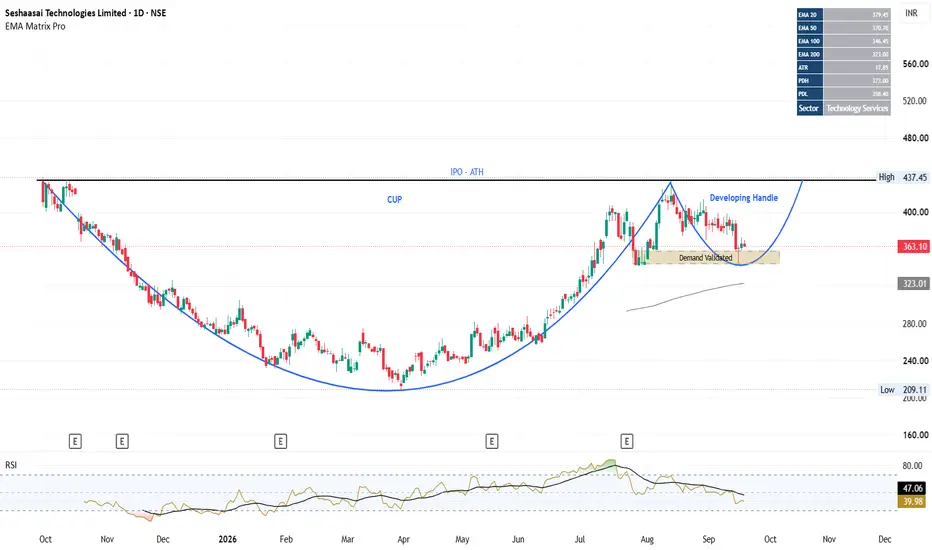
STYL : Cup & Handle Taking Shape — Demand Zone HoldsSeshaasai Technologies Ltd. NSE:STYL is developing an interesting Cup & Handle structure on the daily chart, with the handle currently testing an important demand/confluence area.
Key Observations :
1. Cup formation: After the post-listing decline, price formed a broad base and recovered toward the IPO/major high zone around ₹433–437, completing the larger cup structure.
2. Supply reaction: The first attempt near the previous high was rejected, followed by another pullback. This indicates that the ₹433–437 area remains the major supply/resistance zone.
3. Handle development: The subsequent decline has so far held the ₹343–358 demand zone, which is close to the lower portion of the developing handle.
4. EMA confluence: The demand area is supported by the 100 EMA around ₹346.5, while the 50 EMA around ₹370.8 is currently acting as an intermediate dynamic level.
5. Momentum: RSI has cooled from the previous overbought region and is now around the neutral zone. This gives the handle room to develop without the stock remaining excessively extended.
Trade Plan:
Trigger:
A sustained move above ₹394 and RSI above 50 can be treated as a confirmation of the developing handle breakout / short-term structure reversal.
Upside levels:
₹437–438: Major resistance / previous high
Above ₹437–438: price discovery becomes possible, subject to breakout strength and volume.
Invalidation:
A decisive breakdown below the ₹343–358 demand zone, particularly a daily close below the lower boundary, would weaken the current Cup & Handle thesis.
Risk management:
Rather than entering solely because price is inside the demand zone, the cleaner setup is to wait for price confirmation above ₹394, preferably accompanied by expanding volume. Position size should be calculated according to the predefined risk per trade.
Important technical distinction:
₹394 does not validate the demand zone itself. It validates the handle/recovery structure. The demand-zone thesis is already supported by the reaction from ₹343–358; ₹394 is the potential confirmation trigger.
------------------------------------------------------------------------------------------------------------
Disclaimer: This is a personal technical-market observation for educational/informational purposes and is not investment advice. I am not a SEBI-registered investment adviser/research analyst. Please conduct your own research and manage risk according to your individual circumstances.  Long
Long
 Long
Long
NIFTY — POTENTIAL BULLISH REVERSAL SETUPNIFTY is showing an interesting technical structure that could indicate a shift from bearish momentum toward a potential bullish reversal.
The setup is based on two key technical observations across different timeframes:
🔹 15-Minute: 30 EMA & 50 EMA crossover + price reaction from the EMA zone
🔹 1-Hour: Prominent Doji formation following a sustained bearish move
The combination of these signals makes the current price action worth monitoring for confirmation of a possible upside move.
🔥 1. 15-MINUTE — EMA CROSSOVER SIGNAL :
On the 15-minute timeframe, the 30 EMA and 50 EMA have crossed, suggesting that short-term momentum may be undergoing a transition.
More importantly, NIFTY is showing a reaction around this EMA zone rather than continuing to accelerate lower.
The 30 EMA and 50 EMA can act as dynamic support/resistance during trending conditions. Therefore, if price continues to hold above this zone, it could indicate that buyers are gradually gaining control.
📌 What to watch:
Price sustaining above the 30/50 EMA zone
Bullish candles forming after the EMA reaction
Increasing buying momentum
Breakout above the recent intraday swing high
A sustained move above the EMA structure would provide stronger confirmation of the bullish thesis.
🕯️ 2. 1-HOUR — PROMINENT DOJI AFTER BEARISH MOMENTUM :
The second and potentially important component of this setup is visible on the 1-hour timeframe.
After a period of bearish momentum, a prominent Doji candle has formed.
A Doji represents a period where the opening and closing prices are relatively close, reflecting indecision between buyers and sellers.
When such a candle appears after an extended directional move, it can indicate that the prevailing momentum is losing strength.
🎯3. TARGET: 23,450
If the bullish reversal gets confirmed and NIFTY sustains the upward momentum, 23,450 can be considered a potential upside target.
Key Setup: 15M EMA crossover + EMA reaction + 1H Doji → potential bullish reversal toward 23,450 .
 Long
Long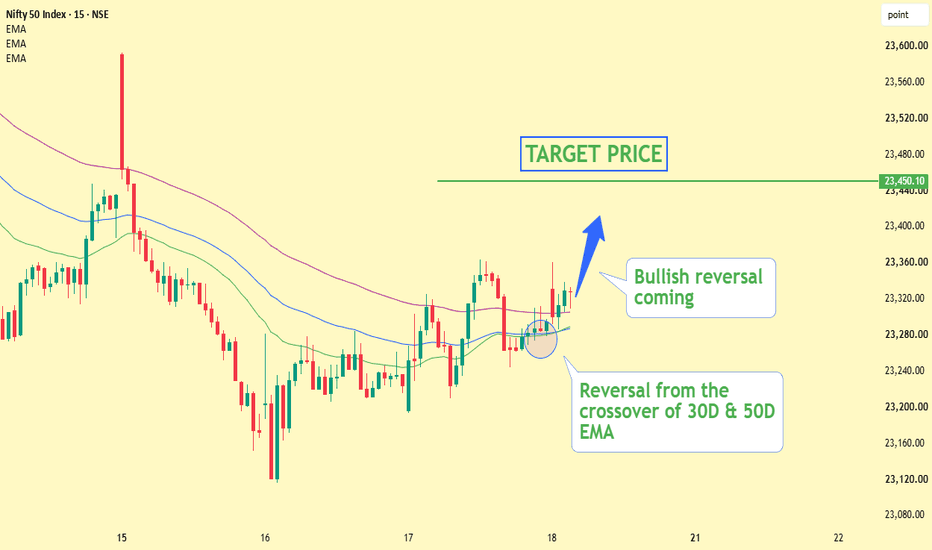
Nifty 50 : Trendline Support Holding, 50 EMA Still the Big TestOverview
Quick weekend look at the bigger picture on Nifty. On the weekly chart, two things stand out right now: a rising trendline support that's been holding nicely, and a resistance zone around the Weekly 50 EMA that price keeps trying (and failing) to clear.
What's Happening
Since the March low, Nifty has been climbing steadily along a rising trendline, currently sitting under the price. That trendline has done its job well so far — every dip toward it has found buyers.
At the same time, price has made a few attempts to break above the Weekly 50 EMA (currently at 24,378) and the resistance zone around 24,601–24,989, but hasn't managed a clean breakout yet. You can see two clear rejection points marked on the chart where price pushed into this zone and got pushed back.
There's also a support zone around 23,817 that's been tested four times now and has held each time — that's a pretty reliable level at this point.
Key Levels
Resistance Zone: 24,378 (Weekly 50 EMA) to 24,601–24,989
Support Zone (tested 4 times): 23,817
Trendline Support: rising, currently well below price, adding a longer-term floor
The Bigger Picture
Right now, Nifty is stuck between a well-tested support below and a resistance zone that keeps rejecting it above. Until one of these gives way clearly, we're likely to keep seeing this back-and-forth kind of price action.
What Would Change the Picture
A clean weekly close above 24,601 would be a good sign buyers are finally taking control of the bigger trend
A break below 23,817, especially with the trendline support also giving way, would be the first real sign this uptrend structure is in trouble
Beginner's Lesson
When a stock or index keeps failing at the same zone multiple times, it doesn't mean it will never break through — it just means buyers haven't found enough strength yet. The more times a level gets tested without breaking, the more important it becomes when it eventually does break, in either direction.
Conclusion
Nifty remains range-bound between strong support below and a tough resistance zone above. No clear signal yet either way — just watching how these two boundaries play out over the coming weeks.
For educational purposes only. Not financial advice. NIFTY Weekly View — Doji at Resistance Signals IndecisionOverview
Nifty closed the week at 24,570.65, up 187 points or 0.77%. But the real story isn't the small gain, it's the shape of this week's candle. Nifty printed a doji right at the resistance zone, open and close almost identical, after tagging a high of 24,774.30. That's a classic sign of hesitation at a decision point, and it comes exactly where we expected the market to be tested.
Follow-up on Last Week's View
Last week we flagged Nifty right at the descending resistance line, needing a close above 24,989 to confirm a breakout. That breakout hasn't happened. Instead of pushing through or falling back, the market has paused, this week's doji shows neither buyers nor sellers could take control near resistance. A Rising Wedge has also taken shape over the last few weeks, adding to the case that momentum is thinning out even as price inches higher.
What a Doji at Resistance Usually Means
A doji by itself isn't a signal, it's a pause button. But a doji forming right at a well-tested resistance zone, after a multi-week rally, carries more weight than a random doji in the middle of a range. It tells us sellers showed up during the week (note the rejection from the 24,774 high) but buyers didn't fully give up either (close held above last week's level). The next 1-2 candles after a doji like this usually confirm which side wins.
Key Levels
Resistance Zone: 24,601.70–24,989.35
Weekly 50 EMA Support: 24,363.25
Support 1: 23,817.80
Support 2 (Trendline): 23,611.00
Major Support: 23,070.15
Weekly 200 EMA: 22,278.36 (long-term trend remains up)
Scenarios
If next week closes above 24,774 (this week's high), it would suggest buyers won the indecision battle, opening the path toward 24,989 and a possible wedge breakout.
If next week closes below 24,363 (the Weekly 50 EMA), it would suggest sellers are gaining control, and Nifty could slide back toward the rising trendline support near 23,817–23,611.
Beginner's Lesson
A doji candle forms when a session's open and close are almost the same, no matter how much price moved up or down during the week, buyers and sellers ended up roughly even. On its own, a doji just means "indecision." But when it shows up at an important resistance or support zone, especially after a strong trending move, traders pay closer attention, because it often marks the point where the trend either pauses briefly or reverses. The key is to wait for the next candle to confirm the direction rather than assuming what happens next.
Conclusion
Nifty's doji at resistance this week is the clearest sign yet that the market is at a genuine crossroads. The falling trendline and wedge resistance near 24,989 remain the level to beat. Until price breaks decisively either way, this is a "wait and watch" zone, but the setup for a bigger move is clearly building.
This is for educational purposes only and not investment advice. Please do your own research or consult a financial advisor before making any trading decisions. NIFTY : Key Fibonacci Levels & Trading Plan for TomorrowNIFTY closed at 23,431.50, continuing the recent weakness from the upper portion of the rising-wedge structure. Tomorrow, the reaction around the key Fibonacci levels will be important.
Key Fibonacci Levels
38.2% — 23,784.25
50% — 23,478.45
61.8% — 23,172.60
The 50% Fibonacci level at 23,478 is the immediate decision zone, while 61.8% at 23,172 is the next major downside reference.
🟢 Bullish Scenario — Confirmation Required
Do not chase the first move.
If NIFTY reclaims 23,478–23,500 and gets a 15-minute candle close above this zone, then:
Target 1 - 23,550–23,600
Target 2 - 23,750–23,784
Invalidation: Sustained move back below 23,478 after the breakout.
🔴 Bearish Scenario — Confirmation Required
If NIFTY fails to reclaim 23,478 and gives a 15-minute candle close below 23,400, bearish momentum can continue.
Target 1 - 23,350–23,300
Target 2 - 23,200–23,172
A decisive break below 23,172 (61.8% Fib) can open the next downside zone toward 23,070.
Invalidation: Sustained reclaim above 23,478.
⚡ Trading Plan
BUY only after confirmation: 15-min close above 23,478–23,500
SELL only after confirmation: 15-min close below 23,400
Avoid the middle: If price remains trapped between these levels, wait for confirmation.
The 50% Fibonacci level at 23,478 is the key battle zone for tomorrow. Let price confirm the direction before taking a position.
Educational market structure and trading plan for discussion only. Not investment advice.  Long
Long
 Long
Long
 Short
Short
 Long
Long
RELIANCE — 5-Year Trendline Meets Falling WedgeOverview
Reliance Industries is trading at 1,322.0, up 1.50%, testing a major confluence zone where a 5-year rising trendline support meets the lower boundary of a shorter-term falling wedge. This dual support test makes the current zone an important one to watch for a potential reversal.
Long-Term Chart
Pattern Explanation
On the long-term view, Reliance has respected a rising trendline support stretching back 5 years, currently near 1,257. Zooming into the daily chart, price has been declining from the recent high of 1,611.8 inside a falling wedge, a pattern that typically resolves bullishly once broken to the upside. The wedge's lower boundary is now converging almost exactly with this long-term trendline, creating a strong support confluence. Price recently tested this zone directly (marked as the "5-Year Trendline Support Test") and has bounced from it.
Trade Setup
Entry: Buy on strength above current levels (1,320+), ideally with a close above the wedge's upper trendline or in dip if comesdown towards 1280-1300 zone
Stop Loss / Invalidation: Below 1,249.8 (recent low, below the trendline confluence)
Target 1: 1,356 (200 EMA zone)
Target 2: 1,450 (wedge resistance / prior consolidation zone)
Key Levels
5-Year Trendline Support: ~1,257
Falling Wedge Support: ~1,250–1,275
Invalidation: Below 1,249.8
Target 1: 1,356
Target 2: 1,450
Deeper Support (if trendline breaks): 1,155.6
Beginner's Lesson
When a short-term pattern (like this falling wedge) lines up with a much longer-term structural level (a 5-year trendline), it creates a stronger case than either signal alone. Long-term trendlines that have held for years carry extra weight because they represent a level respected across many different market cycles, not just recent price action. Seeing a bullish reversal pattern form right at such a level is the kind of confluence traders pay close attention to.
Conclusion
Reliance is testing an important long-term support zone, reinforced by a shorter-term falling wedge pattern. A bounce from here with strength would support a bullish case toward 1,356 and 1,450. A break below 1,250, and especially below the 5-year trendline, would invalidate this setup and open the door to a deeper decline toward 1,155.
This is for educational purposes only and not investment advice. Please do your own research or consult a financial advisor before making any trading decisions.  Long
Long
BTCUSD Multi-Timeframe Analysis (4H & 12H)Trend Build-Up to $95.1K Target
—————
Bitcoin ($80,968.5) is exhibiting a clean multi-timeframe trend expansion. By pairing 4-hour dynamic moving average alignment with a 12-hour measured move pattern, the technical structure points toward a direct continuation toward the $95,176.0 take-profit target.
4-Hour Dynamic Trend Confluence
* Bullish Moving Average Stack: Price is trading well above all key moving averages: EMA 20 H/L band (~$78,692.7), EMA 50 (~$77,833.0), and SMA 200 (~$70,140.5).
* Dynamic Support Defense: The continuous holding above the EMA 20 H/L band confirms high buyer demand, preventing deep pullbacks and propelling the current breakout above $80,000.
12-Hour Measured Move Projection & Estimated Timeline
* Impulse Leg Height: The initial macro impulse leg established a +15,747.0 point expansion from the ~$64,200 base up to the ~$80,000 swing high.
* Measured Target (TP1): Projecting this full 15,747-point height from the local breakout anchor (~$79,429) sets the primary upside target (TP1) at $95,176.0.
* Target Timeline: The original 15.7k-point expansion took roughly 6 days to materialize. Assuming similar momentum velocity during this second impulse leg, the target window is projected between September 8 – September 12, 2026.
Key Technical Levels
| Technical Zone | Price / Range | Confluence / Significance |
|---|---|---|
| Current Price | $80,968.5 | Active 4H candle breaking upper consolidation |
| Immediate Support | ~$78,692.7 | 4H EMA 20 H/L Band |
| Secondary Support | ~$77,833.0 | 4H EMA 50 Trendline |
| Macro Invalidation | ~$70,140.5 | 4H SMA 200 (Long-term structural floor) |
| Primary Target (TP1) | $95,176.0 | 12H Measured Move Completion (+15,747 points) |
Do you expect BTC to sprint straight to $95.1K on this cycle, or will we see one more retest of the 4H EMA 20 ($78.6K) first? Share your thoughts below!
NIFTY Sellers Take Control After the Doji, Testing the 50 (W)EMAOverview
Nifty closed the week at 24,366, down 204.65 points or 0.83%. This follows directly from last week's doji at resistance, and the answer to "which side wins" has come in: sellers took control this week, with price rejecting from a high of 24,620.95 and closing near the Weekly 50 EMA (24,358.08).
Follow-up on Last Week's View
Last week we flagged a doji forming right at the resistance zone (24,601–24,989), a classic sign of indecision after a multi-week rally, with the next 1-2 candles expected to confirm direction. That confirmation has now arrived. Price failed to clear last week's high (24,774.30), and this week's red candle closed well below it, right on top of the Weekly 50 EMA. The Rising Wedge structure we've been tracking remains intact, and this week's price action leans toward the bearish resolution of that pattern.
Pattern Explanation
Nifty is now sitting almost exactly on the Weekly 50 EMA (24,358), a genuine make-or-break zone. Below this, the rising trendline support and Support 1 (23,817.80) are the next levels in line. The falling wedge resistance line above continues to cap every rally attempt, reinforcing the cautious read from last week.
Key Levels
Resistance Zone: 24,601.70–24,989.35
Weekly 50 EMA (current test zone): 24,358.08
Support 1: 23,817.80
Support 2 (Trendline): 23,611.00
Major Support: 23,070.15
Weekly 200 EMA: 22,291.99 (long-term trend remains up)
Scenarios
If Nifty closes next week below the 50 EMA (24,358), it would confirm sellers are in control, and price could slide toward the rising trendline support and 23,817–23,611 zone.
If Nifty reclaims 24,620 (this week's high) with strength, it would suggest the pullback was shallow, and buyers could make another attempt at the 24,774–24,989 resistance zone.
Beginner's Lesson
A doji at resistance is a warning sign, not a guarantee, and this week is a good example of why we wait for the next candle rather than acting on the doji alone. Once the follow-through candle closes clearly in one direction, especially a strong red candle like this week's, it adds real weight to the case that sellers have taken the upper hand, at least for now. The 50 EMA test that follows is the next confirmation point to watch.
Conclusion
Nifty's doji hesitation resolved bearish this week, with price now testing the Weekly 50 EMA directly. A close below this zone would tilt the bias toward the rising trendline support near 23,817–23,611. A recovery back above 24,620 would keep the broader uptrend structure alive. This remains a level-to-level market, with the current test at the 50 EMA the key thing to watch into next week.
This is for educational purposes only and not investment advice. Please do your own research or consult a financial advisor before making any trading decisions. NIFTY Weekly View — Weekly Support Holds at 24,025Overview
Nifty closed the week at 24,252.00, down 114 points or 0.47%, extending last week's bearish follow-through. Price dipped to test Weekly Support near 24,025 and closed well above it by week's end.
Follow-up on Last Week's View
Last week we flagged sellers taking control after the doji at resistance, with price testing the Weekly 50 EMA (24,358) as the key level. That test resolved bearish, price closed below the 50 EMA this week, confirming sellers had the upper hand. This week, that follow-through carried price down to test the next major support level.
Pattern Explanation
This week's low of 24,025.65 tested the Weekly Support level (24,025) almost exactly, and price recovered to close at 24,252, well above the low. The Rising Wedge structure we've been tracking remains intact, with the falling dotted resistance line above continuing to cap rallies. Resistance 1 (24,360, near the Weekly 50 EMA) and Resistance 2 (24,601.70) remain the levels to reclaim for any bullish case to build. The rising Trendline Support below is also gradually approaching current price levels and will be an important zone to watch in the coming weeks.
Key Levels
Resistance 2: 24,601.70
Resistance 1 / Weekly 50 EMA: 24,360 / 24,353.66
Weekly Support: 24,025
Support 2: 23,818.00
Support 3 (Trendline): 23,611.00
Major Support: 23,070.15
Scenarios
Bullish: If Nifty holds above Weekly Support (24,025) and reclaims 24,360 (Resistance 1 / 50 EMA) with strength, it would suggest the pullback is done, opening the door for another attempt at 24,601 and the wedge resistance above.
Bearish: If Nifty comes back down and closes below 24,025, it would be a meaningful break, and price could slide toward Support 2 (23,818) and Support 3 (23,611).
Beginner's Lesson
A well-established support level, like the one tested this week, often holds on its first few tests, especially if it's been respected before. Price dipping into a support zone and closing back above it by the end of the week is a healthy sign, it shows buyers stepped in exactly where expected. Watching whether this level continues to hold on future tests, especially as other levels like trendlines converge nearby, gives a clearer picture of how strong the support really is.
Conclusion
Nifty tested and held Weekly Support at 24,025 this week. Holding this zone with a reclaim of 24,360 would favor buyers again. A future close below 24,025 would tilt the bias bearish toward 23,818 and 23,611. This remains a level-to-level market, with this week's successful support test being an encouraging sign for the bulls, at least for now.
This is for educational purposes only and not investment advice. Please do your own research or consult a financial advisor before making any trading decisions. NIFTY - Rejected at Resistance 1, Wedge Structure TightensOverview
Nifty closed the week at 24,175.65, down 76.35 points or 0.31%. After last week's bounce off Weekly Support (24,025), price pushed back up to test Resistance 1 (24,360) but got rejected, closing the week back below both Resistance 1 and the Weekly 50 EMA.
Follow-up on Last Week's View
Last week we flagged Weekly Support holding at 24,025, with a reclaim of Resistance 1 (24,360) needed for buyers to regain control. That attempt happened this week, price touched a high of 24,378.60, brushing right against Resistance 1, but couldn't sustain above it, closing the week lower instead. This keeps the broader Rising Wedge structure very much in play.
Pattern Explanation
The Rising Wedge continues to tighten, with the falling dotted resistance line above and the rising trendline support below converging closer together each week. This week's rejection right at Resistance 1 (24,360) and the Weekly 50 EMA (24,348.77) reinforces this as a genuine decision zone. Below, Weekly Support (24,025) held again on the pullback, and the rising trendline is now approaching this same region, keeping the confluence setup we've been watching relevant for the coming weeks.
Key Levels
Resistance 2: 24,601.70
Resistance 1 / Weekly 50 EMA: 24,360 / 24,348.77
Weekly Support: 24,025
Support 2: 23,818.00
Support 3 (Trendline): 23,611.00
Major Support: 23,070.15
Scenarios
Bullish: If Nifty closes above 24,360 (Resistance 1) with strength next week, it would suggest buyers are finally clearing this repeated rejection zone, opening the path toward Resistance 2 (24,601) and a possible wedge breakout.
Bearish: If Nifty slips back below Weekly Support (24,025), especially with the rising trendline converging nearby, it would strengthen the case for the Rising Wedge resolving to the downside, with Support 2 (23,818) and Support 3 (23,611) as the next levels.
Beginner's Lesson
A rejection at the same resistance level more than once tells us something important, buyers are trying, but sellers keep showing up at that exact price. The more times a level gets tested and rejected without breaking, the more significant that level becomes, and often, the eventual breakout (or breakdown) tends to be sharper once it finally happens. This is exactly why the 24,360 zone deserves close attention going into next week.
Conclusion
Nifty tested and got rejected from Resistance 1 (24,360) this week, keeping the Rising Wedge structure intact and increasingly compressed. A clean close above 24,360 would tilt the bias bullish toward 24,601. A slip below Weekly Support (24,025) would tilt it bearish toward 23,818 and 23,611. With the wedge tightening, a decisive move in either direction looks closer than it has in recent weeks.
This is for educational purposes only and not investment advice. Please do your own research or consult a financial advisor before making any trading decisions.  Long
Long
 Long
Long
 Long
Long