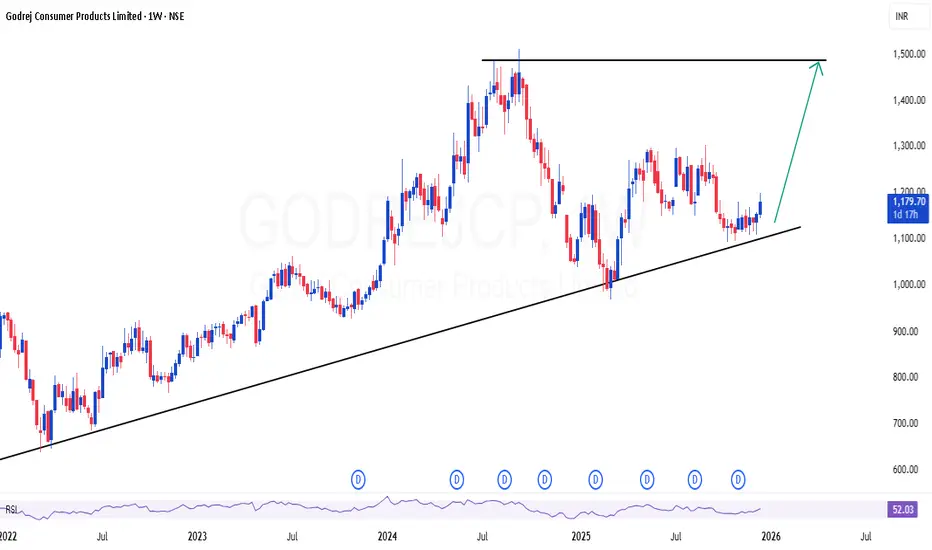
GODREJCP | Looks good for reversalGODREJCP | Looks good for reversal Relatively a safe large cap betby srikartiram6
NIFTY 50 – Change Structure Break AlertPrice structure shifting from Higher High–Higher Low Lower High–Lower Low 50 EMA and SMA Crossover candle formed Stay patient, avoid emotional trades, and trade only on confirmation. ⚠ DISCLAIMER I am not a SEBI-registered analyst. This trading plan is for educational purposes only and should not be treated as investment advice. Always conduct your own analysis and follow strict risk management.Shortby StockEngineering24
Hindalco looking bewildered. Plan to trade either side.Hindalco is forming a double top formation on the weekly charts, showing some weakness in the stock as the market is more time in recoverying the fall of one week. The stock has been in a good up trend and has reached 850 levels forming a base around 560-600 level zone i.e. Approx 30-35% return in 9 months. Since June 2022, Hindalco has not taken out the previous low and recent gave the break out of the previous ATH and retested it. Major trend for the stock is still bullish and there is a pby TheMamboMomentum0
What coming for Nifty weekly Expiry??Today nifty clearly was supported by the 20 EMA on the daily charts while it tested its 60 minutes 200 EMA. Though both the moving averages has given support to the index on intraday basis. Still a fall is being seen in the market as the index closed 225 points lower. Head & Shoulder pattern formation on the charts is there which seem to take support from the neckline. If the market remains beaarish and tend to breach the lower levels a clear support is around 25700-50 levels. While a rising Shortby TheMamboMomentum1
#Bajaj Finance Limited - BUY - Technical Analysis#Bajaj Finance Limited - #Technical Analysis Price: 1,048.00 #Swing Trading Setup Pattern: #Range #breakout with #consolidation above breakout zone. #Triangle/Box pattern breakout with target hit. Currently forming double bottom pattern. Key Technical Points: 1. Range breakout & consolidating above breakout area 2. EMA's sorted & aligned - price trading above all EMAs 3. Triangle/Box pattern breakout - target achieved, now forming double bottom 4. Classic divergence in recent bounce area coLongby earnwhileulearn7
Authum Investment & Infrastructure- Next Swing Low PointAuthum Investment & Infrastructure is close to 200 days EMA and consolidating for next run. A dip below 2500 would be good price to watch and enter trade again. by Jassi250522
ABCAPITAL Trendline Breakout followed by Good RallyIn weekly chart of ABCAPITAL there was RSI Divergence in first quarter of Year 2025. It made a Trendline Breakout in second week of March 2025 And gave entry above breakout candle weekly close at 163.6 and then with a risk of 9% it gave one sided returns of Risk:Reward of 1:13 Curent Return at 120% It retested resistance level of 243.7 which corresponded 21-EMA in july 2025 and again gave return of 45% from the resistance level It is again forming a Bearish RSI Divergence. But bullish trend is Longby wahniwal4
ICICI Bank — 200-DMA Rejection Keeps the Downtrend IntactMarket Context ICICI Bank continues to trade inside a broad descending channel that has governed price since the 1500 peak. Every counter-trend rally has been corrective so far, and the recent recovery has shown the same character — overlapping candles, choppy subdivisions, and clear respect for channel resistance. Key Technical Drivers 1. Rejection at the 200-DMA The rally stalled exactly at the 200-Day Moving Average. This is the same zone where price lost momentum earlier, reinforcing tShortby WaveXplorer2
EURUSD – Retesting Demand Zone for Potential Upside ReversalPrice has tapped into a well-defined HTF demand zone after a controlled selloff. The latest wick into the zone suggests absorption and potential willingness to push higher. If the zone continues to hold, I’m expecting bullish orderflow to kick in, leading to a structure shift and an upward continuation toward the next liquidity pool. Bullish Path: • Sweep into HTF demand • Hold above the blue line (micro support) • Shift in structure • Continuation toward upside inefficiencies ⚠️ ENTRY CONDITLongby YCGH_Capital47
NIfty Hourly Strong SupportHello Friends, Nifty Spot at 26050-60 having support of EMA100 along with trendline support and RSI oversold in hourly ......Overall Momentum is Bullish this is good DIP expceting 26400,26500,26700+ in coming few sessions Longby finvestalgo6
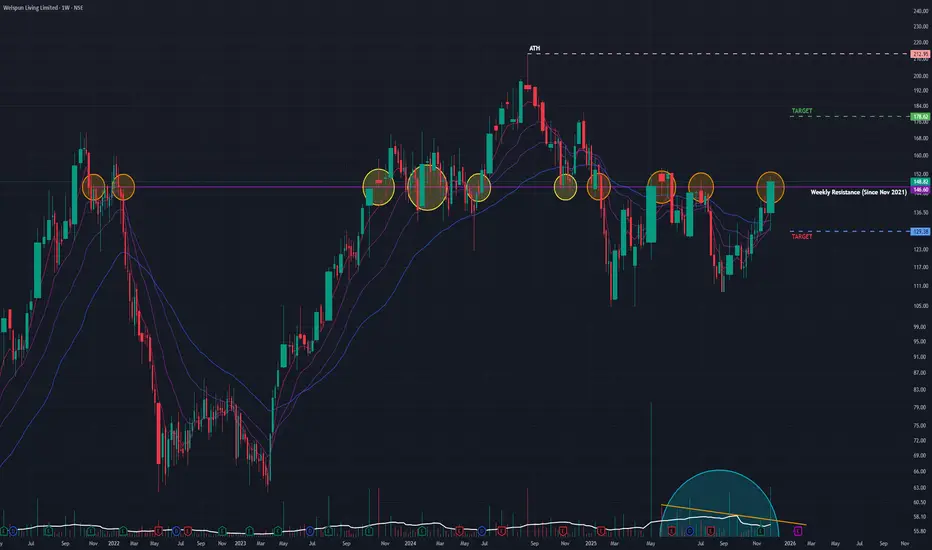
Welspun Living (W): Strongly Bullish, Policy-Driven BreakoutTimeframe: Weekly | Scale: Logarithmic The stock has confirmed a major structural breakout from a 9-month consolidation. This move is backed by the highest volume in months and a significant government policy shift favoring the textile sector. 🚀 1. The Fundamental Catalyst (The "Why") The massive volume surge (88M+) is a direct reaction to a convergence of positive news: - New Labour Codes (Nov 21, 2025): The government's proposed new labour codes that allow more flexibility for textile Longby Learn_with_Pth0mas1
SILVER MIC LONG TRADEWith Silver on up trend and breaking a pivot. The marked levels in chart are good opportunities for taking 1:2 R:R The demand zone formed is also in line with 50/ 21 moving average on daily. #safer trades #take proper position size as per risk managementLongby the_sailor_trader31
IIFL Finance LimitedPrice is breaking out above a long consolidation range, but the move is short term overextended, so both upside continuation and a pullback retest are likely scenarios rather than a one way move. This is educational analysis, not personalized financial advice; position sizing and risk must match your own plan. Trend and structure • The chart shows IIFL Finance Limited breaking out above a broad sideways range, with current price near the upper boundary of that rectangle zone around the 570–580 aLongby NK-PK1
Motherson (W): Strongly Bullish, Post-Bonus Breakout(Timeframe: Weekly | Scale: Logarithmic) The stock has confirmed a major structural breakout, emerging from a 7-month consolidation phase. This move is supported by a "Higher Low" structure, rising volume, and recent analyst optimism. 📈 1. The Structural Context (The Turnaround) - The Adjustment (Context): It is important to note that the price levels (ATH ~₹144) reflect the 1:2 Bonus Issue that occurred in July 2025. The stock is now recovering from the post-bonus correction. - The CLongby Learn_with_Pth0mas7
Kirloskar Oil Engines - Swing TradeKirloskar Oil Engines Limited - Technical Analysis Report Current Market Price: 1,005.70 MARKET BIAS: BULLISH RECOVERY IN PROGRESS Kirloskar Oil Engines is currently trading at 1,005.70, showing signs of bottoming out after a significant correction from its all-time highs of ₹1,450+. The stock is now forming a potential reversal pattern. KEY TECHNICAL OBSERVATIONS: 1. Major Support Zone - HOLDING STRONG ✅ The stock has found solid support in the 900-950 zone, which coincides with: - Multiple Longby earnwhileulearnUpdated 3
Gravita Triangle Breakout 1DGravita is attempting to breakout after forming a triangle pattern on 1D timeframe with high volumes. The stock is also trading above 200ema. Enter after bullish confirmation. Longby Khwaish7
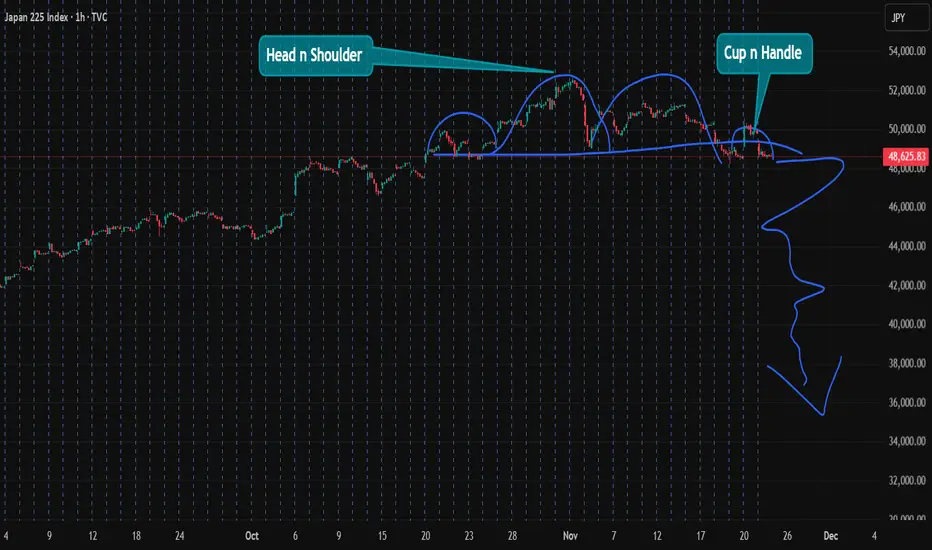
Cup n handle & head n shoulders 1HTVC:NI225 1H shows negative pattern and price action. ready for break down please do your own research before taking any trade. i am not financial advisor risk is real stay practical please feel free to ask any questions Shortby Jatin1093
Tata Consumer Products Ltd – Inverted Head & Shoulders Breakout (Long-term Reversal Structure Forming) Tata Consumer is currently attempting a breakout from a long-term neckline zone around ₹1,170–₹1,200 after forming a large Inverted Head & Shoulders pattern on the weekly timeframe. The right shoulder has built a strong base above the 20W & 50W EMA, confirming renewed demand. Volume has gradually increased over the past weeks during the breakout attempt — a bullish sign. A strong weekly close above ₹1,200 could activate the full pattern and open space towLongby yatharthshah232
Man Industries (W): Bullish, Turnaround with Volatility(Timeframe: Weekly | Scale: Logarithmic) The stock is in a confirmed structural uptrend (Higher Lows) following a year-long correction. It is currently battling a critical multi-year resistance zone, backed by strong fundamental news and rising volume. 📈 1. The Structural Turnaround (The "Big Picture") - The Cycle: Trend analysis: - Consolidation: Jan 2024 – July 2024. - The Peak (ATH): The stock hit a major high in July 2024 - The Correction: A downtrend followed, bottoming outLongby Learn_with_Pth0mas4
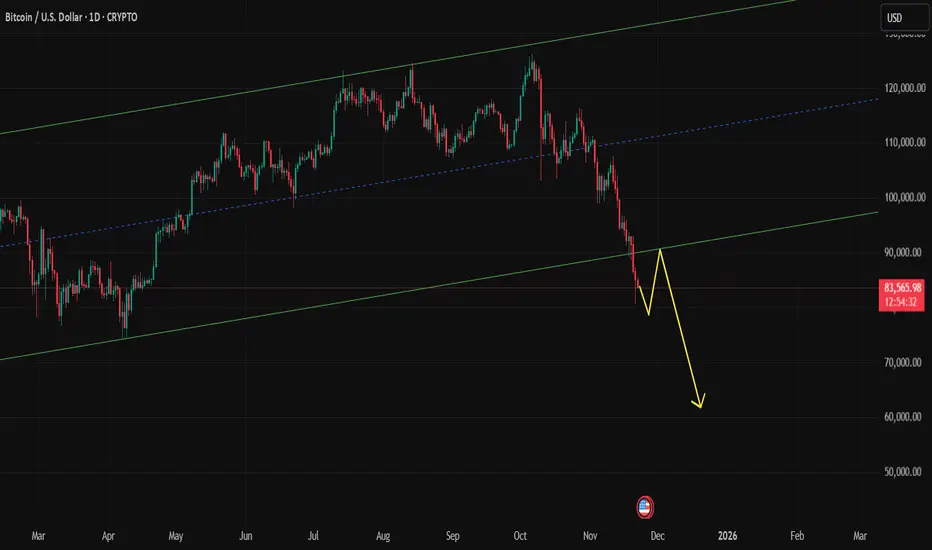
BITCOIN NEED BREATHE CRYPTO:BTCUSD BTC need take relief of selling because selling is continuously happened so one little bounce is possible and that bounce works as retest of channel breakdown. Reverse Scenario: Formation of any bottom pattern V shape recovery Long consolidation after with volume brake out. All chances is possible but there are low possibility 🧠 Always DYOR (Do Your Own Research) ⚖️ This is not financial advice or suggestion 👉 “Risk Is Real 💸 Stay Practical🚀” 💬 Please feel free to ask anyLongby Jatin1090
Higher highs and below SMA( Weekly high > 1 week ago high AND ( Latest Close < SMA(Latest Close, 50) OR Latest Close < SMA(Latest Close, 200) ) )by vpretheshmccian11
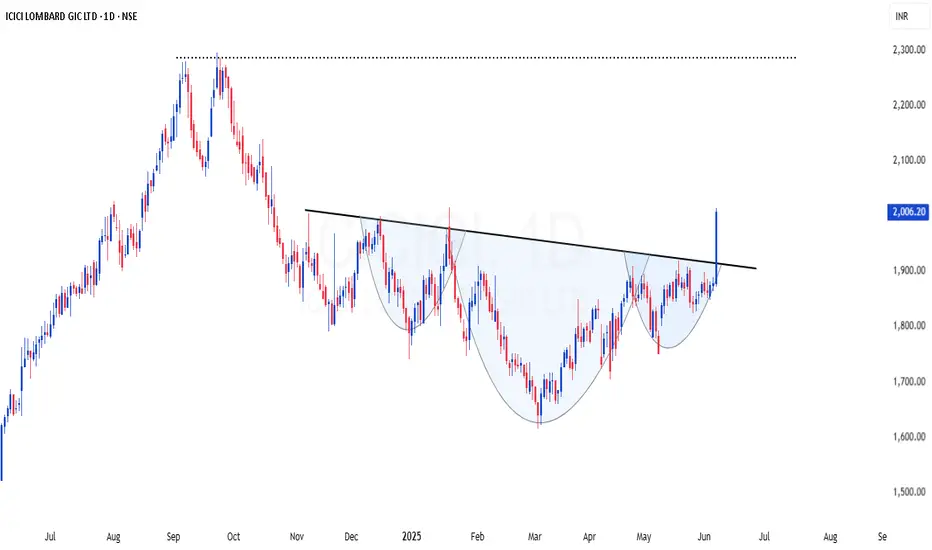
ICICIGI | High probable INHS setup - Looks good for 20-40%ICICIGI | High probable INHS setup - Looks good for 20-40% CMP : 2006 (Dip : 1930) SL : 1800 The stock has confirmed a classic inverted Head & Shoulders pattern on the daily chart, signaling a strong trend reversal. ✅ Breakout above neckline with decent volume, adding conviction to the move. 🎯 Immediate Target: 2300 🎯 Second Target (as per Fibonacci extension): 2700 📉 Pattern: Inverted H&S 📈 Volume: Supporting the breakout 📊 Bias: Bullish This could be an excellent area of value for swing tby srikartiramUpdated 7
GODREJPROP | Nice breakout with volume, looks good for 40-45% GODREJPROP | Nice breakout with volume, looks good for 40-45% CMP : 2467 (Dip : 2300) SL : 2100 Target : 3400 Longby srikartiramUpdated 9
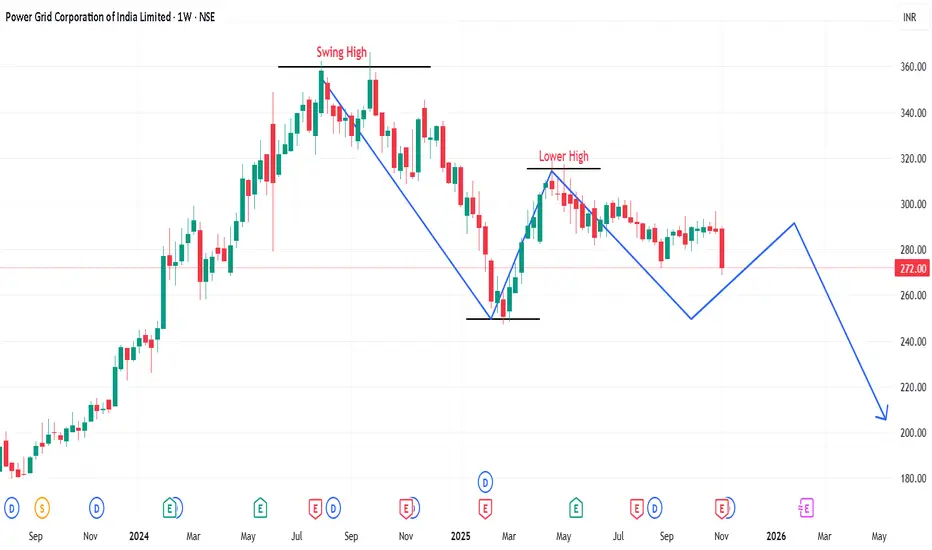
Will Powergrid showing sign of exiting it??Power Grid has been trading in a range for a while and it is showing sign of some weakness. Major Trend - Down Trend As there is a BoS of the previous market cycle. Minor Trend - Sideway to range bound. The market tends to retest the swing low in the coming month. Stock has taken a strong resistance from 20 & 50 EMAs. Weekly close is below 100 EMA. If the stock follow through the downside movement, entry for a sell trade is there with a 1:2 R:R ratio. Entry :- 270 Stop Loss :- 279 Target :Shortby TheMamboMomentumUpdated 0

 Short
 Short
 Long

 Long
 Short

 LongLong
 Long
 Long
 Long
 Long
 Long
 Long
 Short
 Long
 Long
 Long


 Long
 Short