EMA Downtrend, Waiting for Fibonacci Sell EntryFundamental Analysis
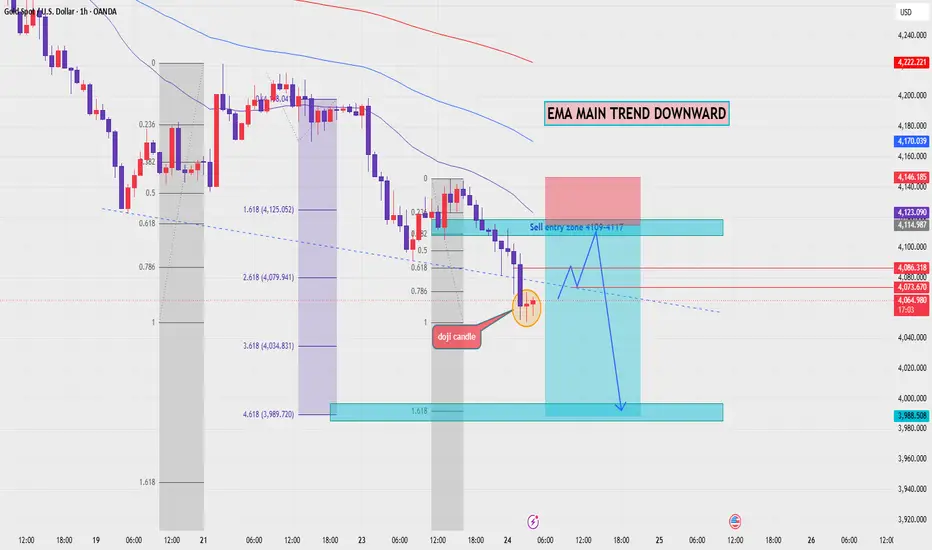
Gold remains under bearish pressure as price continues to trade below the main EMA structure. Traders are still watching USD momentum, Treasury yields, and upcoming U.S. macro data.
For now, the technical structure still favours sellers while recovery attempts remain weak below the EMA resistance zone.
Technical Analysis
On the 1H chart, XAUUSD is trading below EMA 34, EMA 89, and EMA 200. The EMA structure is still pointing downward, confirming that the main trend remai
Moving Averages
Wheels India (WHEELS)Monitoring the ongoing correction following a strong impulsive advance from the January lows.
Price is now approaching a technically important Top-bottom support zone, making the current structure worth tracking over the coming sessions.
The quality of the next reaction should provide useful information regarding the strength of the prevailing trend and the maturity of the correction.
Disclaimer: Views shared are for educational purposes only and do not constitute investment advice.
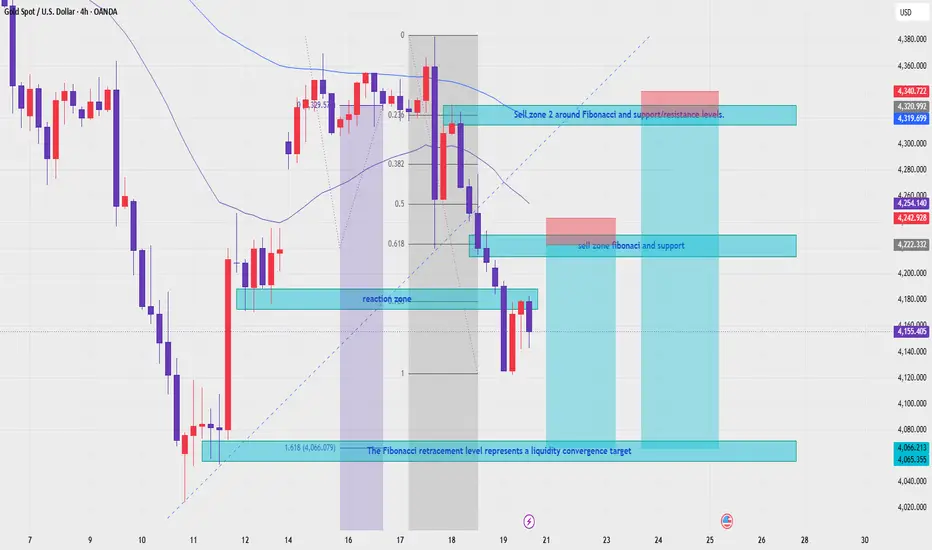
XAUUSD H4 — EMA Bearish TrendXAUUSD — EMA Bearish Trend, Two Sell Zones Toward Fibonacci Liquidity Target
Fundamental Analysis
Gold remains under bearish pressure as price continues to trade below the main EMA structure. The market is still watching USD strength, Treasury yields, and upcoming U.S. data, which may create volatility around key Fibonacci and liquidity zones.
For next week, the main view remains bearish while recovery attempts stay below the EMA resistance area.
Technical Analysis
On the 4H chart, XAUUSD i
XAUUSD — EMA Consolidation Before Bearish Continuation
Fundamental Analysis
Gold remains under short-term pressure as traders continue to watch USD momentum, Treasury yields, and upcoming U.S. macro data.
For now, the recovery has not confirmed a bullish reversal. Price is still reacting around the EMA area, so the current move may be only a short-term consolidation before sellers attempt another push lower.
Technical Analysis
On the 2H chart, XAUUSD is trading around 4,304 after a strong rejection from the upper value range. Price is now cons
GBPUSD — Sell From EMA Value Zone & Fibonacci Levels
Fundamental Analysis
GBPUSD remains under short-term pressure as traders continue to watch USD strength, U.K. data, and upcoming macro events.
For now, the recovery has not confirmed a bullish reversal. Price is still trading below the key EMA resistance area, so pullbacks into value may continue to offer sell opportunities.
Technical Analysis
On the 2H chart, GBPUSD is trading around 1.3323 after a sharp bearish move from the upper range. Price is currently reacting near the strong suppor
EURUSD — EMA Bearish Trend, Sell From Value Zone
Fundamental Analysis
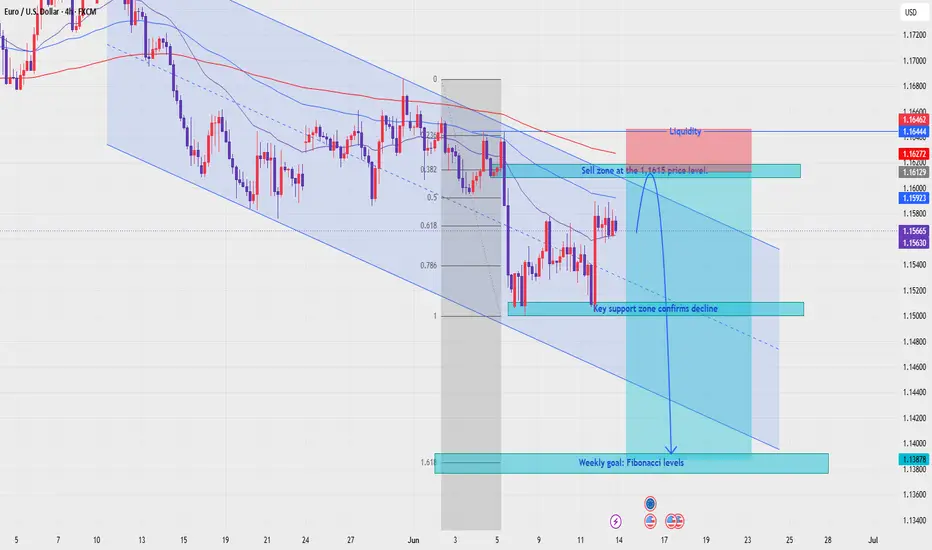
EURUSD remains under pressure as the market continues to watch USD momentum, Fed expectations, and upcoming U.S. macro data. If the dollar stays supported, recovery attempts on EURUSD may remain limited.
For next week, the main focus is whether price can retest the value zone above before continuing lower in line with the EMA trend.
Technical Analysis
On the 4H chart, EURUSD is still trading inside a descending channel. EMA 34, EMA 89, and EMA 200 remain above price, sh
Time to Buy TCS? DCF valuation Check.Hey Folks,
I'like to have your attention on the tech giant Tata Consultancy Services Ltd.
After taking a huge correction over past year.
I am observing the price has finally landed in a very comforting support zone. 0.78 level according to my fib retracement placement. and hanging ~200 points above the price-action based support level.
I am Considering fib support with more weightage, with price trailing well below 50EMA as well.
So if not a trend reversal i am looking for the price to ta
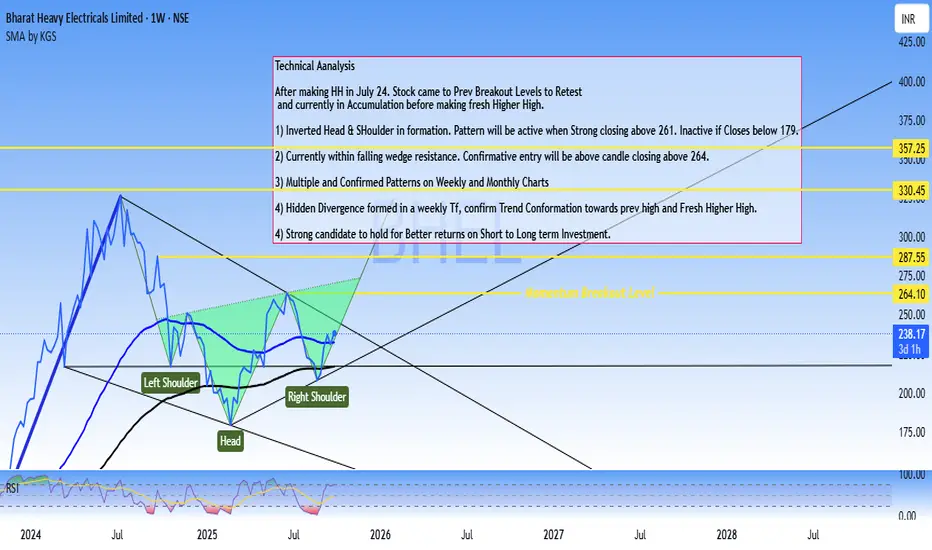
Investment Stock Analysis - BHEL Strong BuyTechnical Aanalysis
After making HH in July 24. Stock came to Prev Breakout Levels to Retest
and currently in Accumulation before making fresh Higher High.
1) Inverted Head & SHoulder in formation. Pattern will be active when Strong closing above 261. Inactive if Closes below 179.
2) Currently within falling wedge resistance. Confirmative entry will be above candle closing above 264.
3) Multiple and Confirmed Patterns on Weekly and Monthly Charts
4) Hidden Divergence formed in a weekly Tf,
XAUUSD — EMA Bearish Trend, Sell From Fibonacci Value Zone
Fundamental Analysis
Gold remains under bearish pressure as the market focuses on key USD events this week, including the Federal Funds Rate, FOMC Economic Projections, FOMC Statement, and the FOMC Press Conference.
These events may create strong volatility for XAUUSD. If the Fed tone supports USD strength or keeps rate expectations tight, gold may continue to face selling pressure on recovery attempts.
Technical Analysis
On the 4H chart, XAUUSD is still moving inside a descending channel. EM
XAUUSD — Sell Below EMA Trend From Liquidity Resistance
Fundamental Analysis
Gold remains under pressure as the market continues to watch USD strength, Treasury yields, and upcoming U.S. data. The current structure still favours sellers while price trades below the main EMA resistance.
For now, any recovery should be treated as a technical pullback unless gold can reclaim the key resistance zone with strong confirmation.
Technical Analysis
On the 1H chart, XAUUSD is still trading below EMA 34, EMA 89, and EMA 200. This shows that the short-term
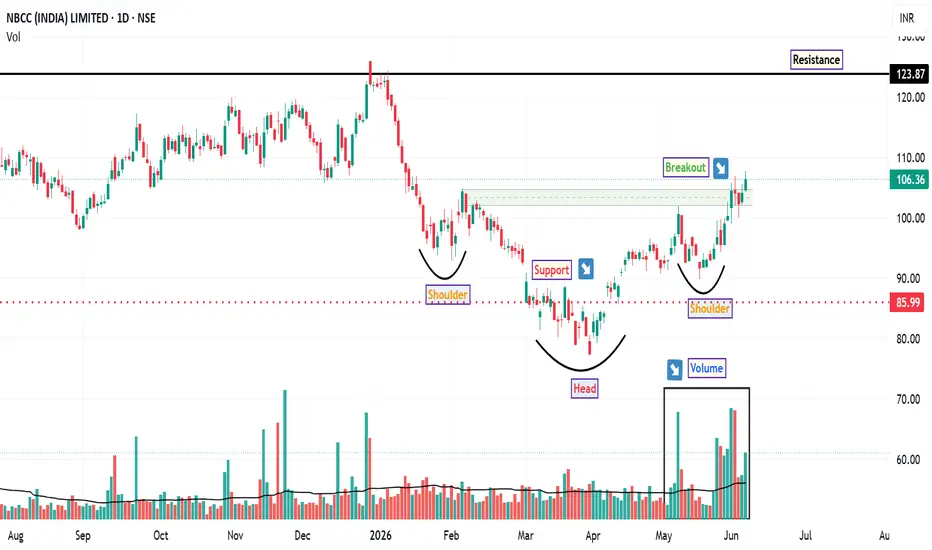
NBCC: Pattern Breakout and Key LevelsThe stock of NBCC appears to be showing signs of improving strength on the daily chart, supported by a combination of price structure, volume confirmation, and momentum indicators. Recent chart behaviour suggests the possibility of a constructive trend development after the formation of a noteworthy reversal pattern.
On the daily timeframe, the stock has formed an inverted head and shoulders pattern. Price has moved above the neckline zone which is also equilibrium level and the breakout has
Aye Finance – Fresh IPO Momentum BreakoutNSE:AYE
Aye Finance has shown a strong breakout from its recent consolidation zone with a sharp price move and strong volume participation. The stock closed near ₹164 with around 10% gain, supported by a visible liquidity rush and elevated relative volume.
Momentum indicators are improving. RSI is in bullish territory, MACD is turning positive with histogram expansion, and relative strength is also improving. Price is trading above key short-term moving averages, indicating trend continuation
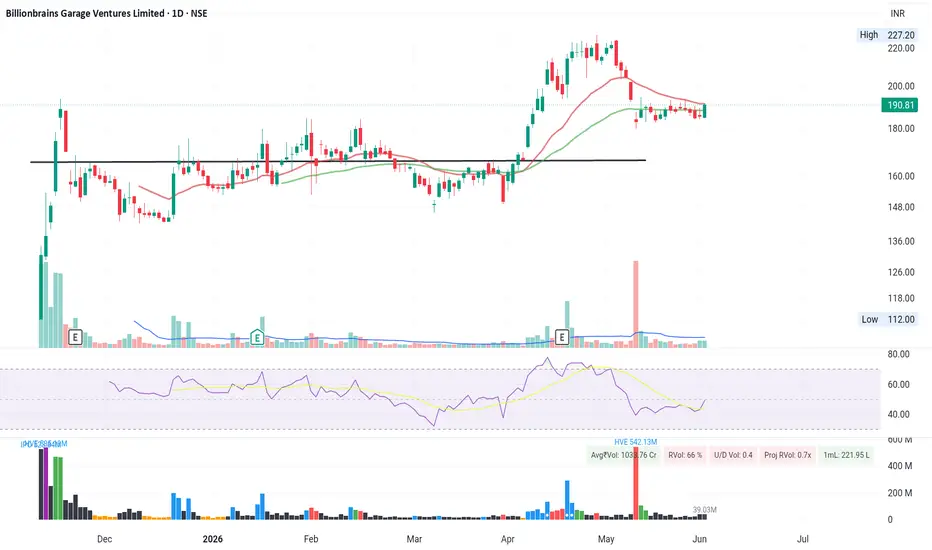
Billionbrains Garage Ventures: Post-Breakout Consolidation Near NSE:GROWW
Billionbrains Garage Ventures Ltd — Daily Chart Observation
Billionbrains Garage Ventures had a strong breakout move from the ₹160–₹165 base zone and rallied sharply toward the ₹220+ area. After the breakout, the stock has corrected and is now consolidating around ₹185–₹195.
Current observations:
Price is holding near the short-term moving average zone and has shown a bounce from the recent consolidation area. RSI is recovering from the lower range, indicating early momentum i
Navin Fluorine International LimitedThe stock is in a strong bullish (upward) trend.
Trendline Support: The price is climbing sharply along an upward trendline. It is currently testing this line as a support level.
Moving Averages: The stock is trading well above its 50, 150, and 200-day Simple Moving Averages. Because the shorter-term average (50 SMA) is above the longer-term ones, it confirms a healthy, long-term uptrend.
RSI Indicator: The RSI is at 63.31, showing positive upward momentum without being unsustainably overboug
10 day avg delivery vol more than 500%SUDARSHAN CHEMICALS:
10-day average delivery volume has increased by more than 500%, indicating strong accumulation. The weekly candle has broken above the 200DMA, 50 DMA and 20 DMA and is sustaining above the Supertrend.
Historically, whenever the Supertrend turns green, the stock has delivered strong rallies. With rising delivery volumes and bullish price structure, the stock looks ready for a potential breakout move.
NSE Union Bank Enters High-Probability Reversal ZoneUnion Bank of India remains inside a long-term ascending channel on the 4-hour timeframe, showing that the broader trend structure is still positive despite the recent correction.
The price is now trading near an important Fibonacci retracement support zone between 0.5 and 0.382 . Interestingly, the previous bullish cycle also respected the same Fibonacci region before continuing higher, suggesting a possible historical price reaction pattern.
At the same time, the stock is approaching the
ATH Breakout - KTK Bank - karnataka bank🏛️ KTKBANK (1M & 1D): The Language of Multi-Timeframe Alignment
When you look at a dual-frame setup like this, you realize charts don’t just show prices—they tell a story of accumulation, minor corrections, and powerful technical traps.
**Karnataka Bank Limited (KTKBANK)** is printing a classic high-probability setup where the macro monthly trend perfectly validates an aggressive intraday/daily breakout attempt.
🔍 Deciphering the Blueprint:
1. The Macro Picture (Monthly Timeframe - Left)
*
Swing Analysis - Balaji Amines
## 📈 BALAMINES (1M): Major Trend Reversal & Breakout Confirmed!
**Balaji Amines Limited** is flashing a massive bullish signal on the monthly (1M) timeframe. After a prolonged corrective phase from its 2021 highs, the stock has completed a textbook multi-year rounding structure/falling wedge and is breaking out from a critical juncture.
### 🔍 Key Technical Observations:
* **The Breakout Point:** The stock has forcefully breached the downward trendline that has capped prices for years. It is
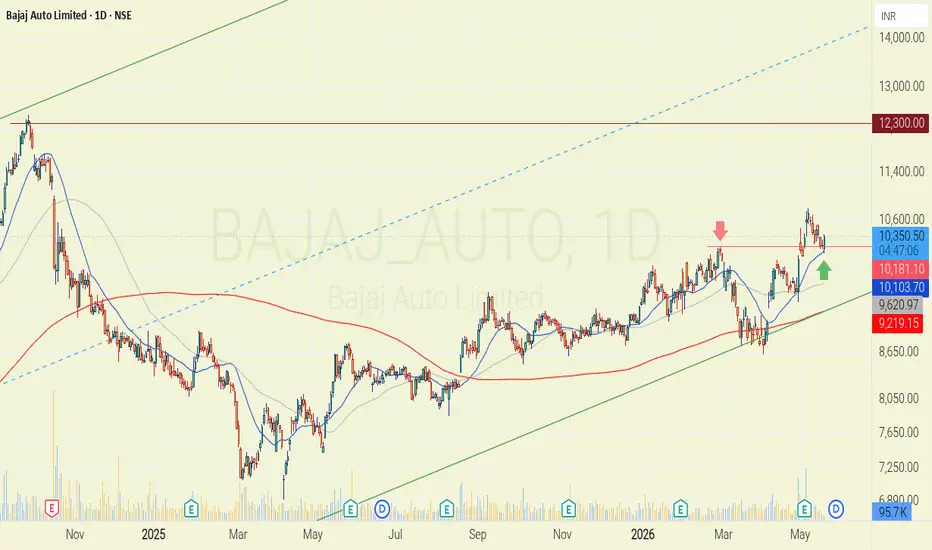
Bajaj Auto resistance to supportThere is confluence of 2 very good setups.
1. Earlier resistance of 10180 is now acting as support.
2. 10180 is also a 20D SMA.
A good low risk high reward swing trace is possible which can play out in few weeks.
Likely target of ATH can be considered.
SL below 10100 would be good.
RVNL might move UpsideWith market stabilizing , we might see sector rotation and a potential move in railways sector. These are the technical reason/logic to support it.
1) Higher High and higher low formation indicating UPSIDE momentum
2) Trading above 50 & 20 EMA
3) Gap Cover Pending
4) Volume increased in recent days
5) Higher TF in weekly Pole & flag pattern formation
6) Favorable Risk Reward
(Note: I am neither responsible for anyone's profit or loss nor I'm a sebi registered RA, this only for educational pu