0/0, 1/0, 0/1 Explained: MARAL Liquidity Conditions Liquidity Isn’t an Entry — It’s a Test (XAUUSD Case Study)
This XAUUSD chart is a textbook example of why most traders misunderstand liquidity in live markets.
Price moved strongly higher over multiple sessions, creating a clear bullish structure. Many traders see this and immediately think:
“Trend is up → buy pullbacks.”
That assumption is exactly where execution errors begin.
What This Chart Actually Shows (Objectively)
Strong directional move
Price advanced cleanly from the 4700s into the 5100s.
Momentum expansion is obvious.
Structure remains intact.
Price now stalling near prior highs
The market is no longer impulsive.
Candles compress.
Wicks increase.
Range tightens
This is no longer a trend-entry environment.
This is a liquidity decision zone.
Liquidity Reality on This Chart
Liquidity is not something you predict.
It is something price either takes or doesn’t take.
On this chart:
Buy-side liquidity sits above recent highs.
Sell-side liquidity sits below recent higher lows.
At the current price:
Buy-side liquidity is not yet clearly accepted.
Sell-side liquidity is not yet clearly taken.
Meaning:
Price is between liquidity pools.
This is the most dangerous zone for live trading.
Why the “Middle” Is Where Accounts Get Damaged
When price is between liquidity pools:
Risk-to-reward becomes asymmetric.
Breakouts lack confirmation.
Reversals lack fuel.
Entries become emotional, not structural.
Most losing trades happen here, not at extremes.
This is why MARAL treats the middle as a WAIT zone, not an opportunity.
What MARAL Waits for on This Chart
MARAL does not ask:
“Is gold bullish?”
It asks:
“Has liquidity been resolved in a way that permits execution?”
There are only two valid next steps:
1) Buy-Side Liquidity Taken + Acceptance
Price takes the highs.
Holds above them.
Builds acceptance (not just a wick).
Only then does continuation become executable.
2) Buy-Side Liquidity Taken + Rejection
Price takes the highs.
Fails to hold.
Closes back into range.
Only then does mean reversion or pullback logic activate.
Until one of these happens, MARAL stays inactive.
Why This Protects Live Traders
Without liquidity rules, traders:
Buy into resistance.
Sell into support.
Chase candles.
Tighten stops randomly.
Overtrade ranges.
With liquidity rules:
Trades are earned, not guessed.
Entries happen after information, not before.
Risk is defined by structure, not emotion.
MARAL’s job is not to find more trades.
It is to block bad ones.
Key Takeaway from This XAUUSD Chart
This chart is not saying “buy” or “sell.”
It is saying:
“Wait until liquidity makes the decision for you.”
Liquidity tells you where stops were hit.
Execution permission comes from what price does after that.
Until then:
No prediction.
No anticipation.
No forced entries.
MARAL Liquidity Conditions (0/1) — Execution Rules
In MARAL, liquidity isn’t “concept.” It’s a binary event gate. 0.00 = not triggered. 1.00 = triggered.
Reference pools:
PDH = Prev Day High → Buy-side liquidity
PDL = Prev Day Low → Sell-side liquidity
1) 0.00 / 0.00 → “NO LIQUIDITY EVENT” Price is between pools:
Candle High < PDH
Candle Low > PDL
✅ Meaning: No sweep happened. You’re in the middle zone. MARAL prefers WAIT / reduce size / demand extra confirmation.
2) 1.00 / 0.00 → “BUY-SIDE SWEEP EVENT” Triggered when price tags / wicks above PDH (or a defined swing high).
✅ Meaning: stops above highs were likely harvested. Next decision is NOT “buy.” Next decision is “accept or reject above PDH.”
3) 0.00 / 1.00 → “SELL-SIDE SWEEP EVENT” Triggered when price tags / wicks below PDL (or a defined swing low).
✅ Meaning: stops below lows were likely harvested. Next decision is NOT “sell.” Next decision is “accept or reject below PDL.”
4) 1.00 / 1.00 → “DUAL SWEEP / RANGE LIQUIDITY” Both sides got taken in the same session/window:
A push above highs AND a push below lows
✅ Meaning: stop-hunt environment / expansion trap risk. MARAL demands structure reclaim + volatility control before any entry.
Post-sweep MARAL decision gates (the real edge)
After any sweep (Buy-side or Sell-side), MARAL waits for one of two outcomes:
A) Acceptance (Continuation permitted)
Price holds beyond the swept level
Follow-through candles confirm
✅ Interpretation: the sweep was breakout fuel, not a trap.
B) Rejection (Reversal / pullback permitted)
Price wicks beyond the level then closes back inside
Reclaim confirms
✅ Interpretation: the sweep was liquidity grab, not real continuation.
Golden rule
Liquidity flag = “where stops got hit.” Entry permission = “what price did AFTER stops got hit.”
MARAL Liquidity: How It Helps Live Trading (Not Theory)
Most traders know liquidity.
They still lose live — because they trade it too early or in the middle.
MARAL turns liquidity into execution gates so you don’t “guess.”
You wait for the event, then trade the reaction.
1) MARAL converts liquidity into a binary live signal (0/1)
Liquidity becomes usable when it’s measurable:
Buy-side Liquidity (High) = stops above highs (PDH / swing highs)
Sell-side Liquidity (Low) = stops below lows (PDL / swing lows)
0.00 = not triggered on this bar/window
1.00 = triggered on this bar/window
This is huge live, because it kills imagination:
“Did price actually take the pool, yes or no?”
2) 0/0 is NOT “nothing” — it’s a warning
Buy = 0.00 and Sell = 0.00
means: price is between pools.
Live meaning:
you are in mid-range
RR becomes random
both directions can wick you out
How it helps traders:
MARAL stops you from trading the worst zone where most retail accounts get chopped.
3) 1/0 or 0/1 tells you: “Liquidity event just happened”
When you see:
1/0 → buy-side liquidity taken (stops above highs hit)
0/1 → sell-side liquidity taken (stops below lows hit)
Live meaning:
the market just did its “stop run”
now the real question is acceptance vs rejection
How it helps traders:
You stop entering into the sweep.
You wait for what price does after the sweep.
4) The real edge is post-sweep behavior (MARAL live rule)
After a liquidity grab, MARAL expects only 2 outcomes:
A) Acceptance (continuation allowed)
price holds beyond the swept level
follow-through candles confirm
✅ Meaning: sweep acted as fuel
B) Rejection (reversal/pullback allowed)
wick beyond level then closes back inside
reclaim confirms
✅ Meaning: sweep was a trap collection
How it helps traders:
This is how you avoid the #1 mistake:
“I bought the wick.” / “I sold the wick.”
5) 1/1 is a live “danger mode”
Both sides taken (in same session/window) = stop-hunt environment.
Live meaning:
range expansion
fakeouts increase
structure becomes unreliable
How it helps traders:
MARAL forces extra confirmation or reduces trade frequency.
You stop treating volatility as opportunity when it’s actually noise risk.
MARAL Liquidity Summary (Live Trading)
Liquidity is not a setup. It’s a test.
0/0 → middle zone → WAIT
1/0 or 0/1 → sweep happened → trade only after acceptance/rejection
1/1 → stop-hunt regime → high confirmation needed.
Final Note
This analysis is educational, focused on execution behavior, not signals or financial advice.
Use it to improve decision quality, not to chase outcomes.
#Trading #Liquidity #SMC #PriceAction #RiskManagement #Forex #Crypto #XAUUSD #NAS100 #ICT #Liquidity #Engineering  Education
 Long
Long
 Short
Short
 Short
Short
 Short
Short
Chapter 18 — The Reversal TrapWhy trying to catch tops & bottoms destroys accounts
Most accounts don’t blow up from “bad strategy.”
They blow up from one addictive behavior: forcing a reversal when the market has not granted reversal permission.
A reversal is not a candle pattern.
A reversal is a regime change — structure, participation, and liquidity behavior must all rotate together.
1) The trap: “It fell a lot, so it must bounce”
After a strong impulsive move, your brain starts doing dangerous math:
“It already dumped, downside is limited.”
“This is a discount.”
“I’ll catch the bottom with a tight SL.”
“Just one bounce and I’m back.”
That thinking is not analysis.
That is recovery psychology wearing a technical mask.
And the market punishes it because in a real downtrend, bounces are often just liquidation relief, not reversal.
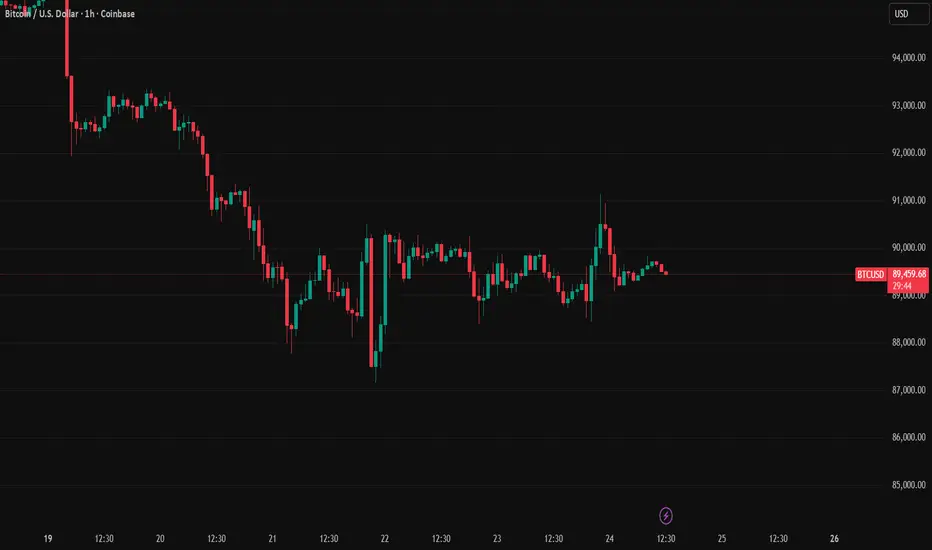
2) What this chart is actually saying (not what you want it to say)
Look at the execution readouts on the BTCUSD 1H chart:
Context Board (right):
Direction: Bearish
H1 / H4 / Daily: Bearish
Momentum: BEAR
Liquidity Context: LOW
Long Score: 10 (No-Trade)
LTF Exec: WEAK
Qualification Gate (top):
SETUP: WAIT
LIQUIDITY: LOW
ENTRY PERMISSION: SKIP
EDC (bottom-right):
SETUP: WAIT
ENTRY PERMISSION: SKIP
LIQUIDITY: LOW
ACTION STATE: HOLD
This is not a “find the bottom” environment.
This is the system telling you: the market is not offering clean participation, and long attempts are structurally unsupported.
3) Why reversals fail here (the mechanics)
In bearish conditions with low liquidity:
Price bounces easily (because thin liquidity lets it lift)
Traders confuse bounce with reversal and enter early
The next sell wave hits (often a liquidity sweep / reloading)
Price drops back into the range
Your “tight SL” becomes a guaranteed stop-out machine
You re-enter to “get it right” → the real damage begins
The trap is not one loss.
The trap is repeat exposure inside a non-permission regime.
4) The hidden killer: “Bottom hunting” creates the worst R:R in reality
On paper, catching bottoms looks like high reward.
In practice, it produces:
Low hit-rate entries
Chop + wick environment
Stop clusters hunted repeatedly
Emotional re-entry loops
Over-leverage temptation (“If I nail this bottom, it’s huge”)
So even if you’re “right” once, the account is often already damaged by the attempts.
5) The professional rule: reversals are earned, not predicted
A valid reversal is when the market proves three things:
A) Structure shift
Break of the bearish sequence (lower highs / lower lows)
A reclaim that holds, not just taps
B) Liquidity behavior changes
Sweeps stop occurring “against you”
Liquidity stops being LOW; participation becomes consistent
C) Participation confirms
Momentum stops bleeding
Follow-through appears after the shift, not before it
Until these are aligned, a “reversal” is just a pullback inside continuation.
6) The Reversal Permission Checklist (use this before touching tops/bottoms)
A reversal attempt is only rational when most of these are true:
HTF context is neutralizing (bearish pressure reducing, not accelerating)
Liquidity is not LOW (no thin, stop-hunt conditions)
Momentum stops being BEAR-dominant (chop resolves into directional intent)
Long side stops showing “No-Trade” quality
Entry permission is not SKIP
LTF execution is not WEAK (execution conditions matter as much as direction)
If the dashboard says WAIT / SKIP / LOW, your job is not to be clever.
Your job is to protect capital and wait for permission.
7) The clean takeaway
Tops & bottoms are where ego trades.
Professionals don’t “guess” turning points — they trade after the market proves it has turned.
If you want longevity:
Stop trying to be first.
Start trying to be right with permission.
Catching a reversal is not a skill.
Avoiding the reversal trap is the skill.
#BTC #BTCUSD #Bitcoin #CryptoTrading #TradingPsychology #RiskManagement #Execution #NoTradeZone #MarketStructure #Liquidity #StopLossDiscipline #Overtrading #FOMO #ReversalTrap #TrendFollowing #CapitalPreservation #TradeManagement #PriceAction #Volatility #Discipline
Educational content only. Not financial advice. Markets involve risk; use your own risk management and decision process.  Education
Long 
 Long
Long
 Education
Chapter 16 — Risk Is Decided Before Entry Why entry timing matters more than stop placement (Chart-Based Case Study: XAUUSD 4H)
This chart is the perfect example of a mistake many traders repeat:
They see bullish context and assume risk is “solved” by placing a stop.
But MARAL is showing something more professional:
The direction can be bullish while the execution environment is still high-risk.
That gap is where most losses are born.
1) What the chart proves: “Bullish context” is not “safe entry”
On your Context Board:
Direction: Bullish
H4 Context: Bullish
Daily Context: Bullish
Structure: Bull Struct
Momentum: Neutral
Trend Strength: ADX ~29 (decent)
A basic trader reads this and says:
“Okay, long is correct.”
But MARAL adds the missing layer:
Execution conditions (the part that creates real risk)
Market Phase: RANGE (Management Desk)
Score Trend: Deteriorating
MTF Status: MIXED
Liquidity Context: LOW
LTF Execution: AVOID
ECI: 53 (No-Trade)
Risk Mod: NEGATIVE (CAP notes: LOW LIQ | DIV NEG)
Post-entry tracker even flags: Action = EXIT
This is the core lesson:
Your chart can be bullish and still be a bad place to enter.
2) The mistake: thinking stop placement can “fix” a bad entry
Your chart is in a range regime after a bullish push.
That means the market is often doing rotation, not clean continuation.
In rotation, price commonly:
hunts liquidity above/below recent candles,
tests levels repeatedly,
breaks small structure and reclaims,
creates false confirmations.
So what happens if you enter early?
Your stop-loss is forced to defend you against:
repeated wicks,
chop,
divergence behavior,
low-liquidity “snap” candles.
That is why MARAL shows No-Trade even when HTF is bullish.
Because risk isn’t the stop distance.
Risk is the probability of being wrong before the move actually starts.
3) The professional risk metric is MAE, not SL
Look at your Post-Entry Stress box:
Direction: Long
MAE (ATR): ~0.60
MFE (ATR): ~0.06
Risk State: MED
Action: EXIT
That ratio is the story:
Price is willing to move against the entry far more than it is willing to reward it.
This is exactly what “risk decided before entry” means:
If you enter in mixed + low liquidity + range rotation,
your MAE becomes structurally high.
You can choose any stop you want—
but the market condition already decided that you will be stressed first.
4) Why “LOW LIQ + DIV NEG” is a risk amplifier
Your ECI CAP notes show: LOW LIQ | DIV NEG
That combination is dangerous because:
Low liquidity increases slippage and snap moves
Negative divergence warns that upside participation is weakening
In a range, weakening participation often precedes another sweep
So even with bullish structure, the market can still do:
one more downside sweep,
then continue up later.
If you enter before the sweep/reclaim, you fund the drawdown.
5) MARAL rule: Entry permission is the first stop-loss
This chart shows why MARAL exists:
When execution reads:
RANGE + MIXED + LOW LIQ + Deteriorating score trend + ECI No-Trade
The best risk control is not:
“wider stop”
“stronger mindset”
“trust the bias”
The best risk control is:
Delay entry until the market proves permission.
Because the cleanest wins are not the best predictions.
They are the best-timed permissions.
6) The takeaway (the whole chapter in one line)
Stop-loss is not where risk begins.
It is where risk becomes visible.
Risk was decided the moment you entered a mixed, low-liquidity range regime.
And the board warned you before the entry ever needed management.
Educational note: This is not financial advice. This is an execution and risk-qualification case study based on the attached chart and MARAL board states.
 Short
Short
Short 
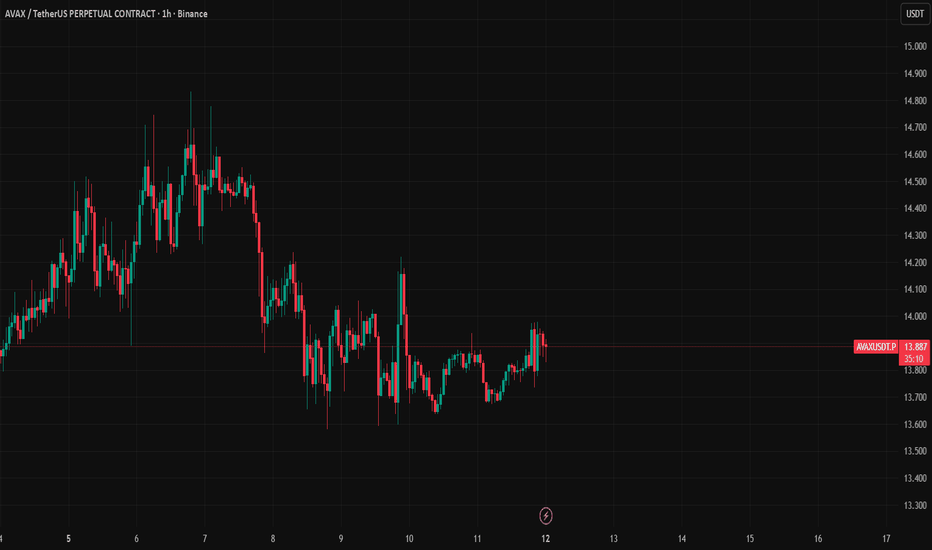
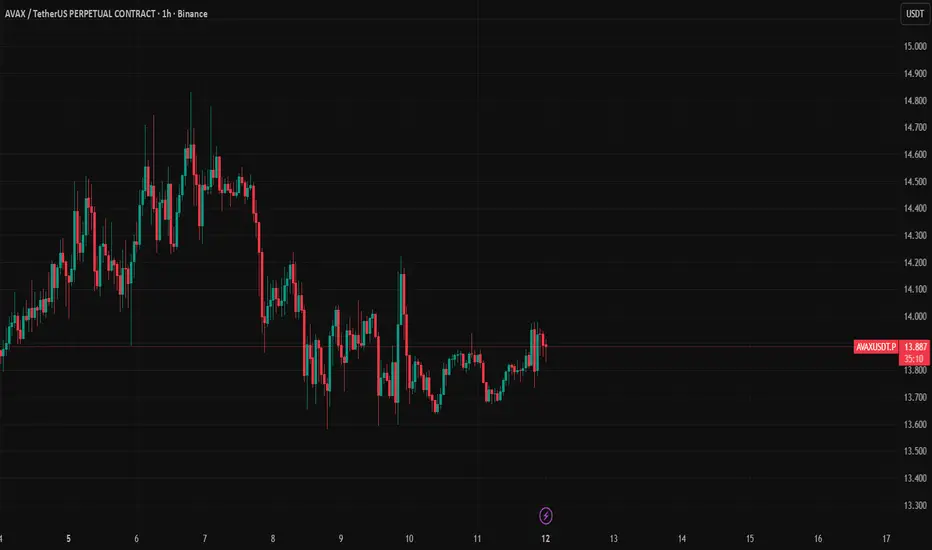
Chapter 15 — Confirmation AddictionHow waiting for “more confirmation” creates late entries (and worse trades)
(AVAXUSDT.P — 1H chart reference attached)
Most traders don’t lose because they’re “wrong.”
They lose because they enter after the move has already paid the early participants.
That behavior has a name: Confirmation Addiction.
It sounds responsible (“I’m waiting to be sure”).
In reality, it’s often fear disguised as discipline — and it produces the same outcome again and again:
✅ you feel safe
❌ you enter late
❌ your stop gets wider
❌ your R:R collapses
❌ you get chopped or stopped on the first pullback
What “Confirmation Addiction” looks like on this chart
On your panel, the market is MTF ALIGNED bullish, but not trending cleanly:
H1/H4 Context: Bullish
Daily Context: Neutral
Market Phase: RANGE
ADX ~14.7 (weak trend)
Participation: Weak
Risk Mod: Negative (divergence / internal weakness)
This combination is the perfect trap for late entries:
In a range, price repeatedly does this:
forms a base
pushes up a bit
pulls back and tests
pushes again
then fakes / retests / compresses
A confirmation-addicted trader keeps stacking requirements:
“Let it break the high”
“Wait for candle close”
“Wait for retest”
“Wait for another close”
“Wait for one more push”
By the time all of that happens, you are buying after the best location is gone — usually near the top of the internal range, right before a pullback.
Why “more confirmation” is mathematically worse
Each extra confirmation usually means one of two things:
1) You pay with distance
Your entry moves farther from the invalidation point → your stop must widen → position size shrinks → your upside becomes limited.
2) You pay with timing
The market has already done the displacement. Now you’re entering when mean reversion and pullback probability is highest.
So “more confirmation” often improves emotional comfort but damages:
location
R:R
trade longevity
drawdown tolerance
The real truth
Confirmation is not the edge. Location is the edge.
Confirmation should only answer:
“Is entry permitted here?”
Not: “Can I remove all uncertainty?”
Because uncertainty never disappears — it just gets more expensive.
MARAL Solution: Replace “More Confirmation” with “Entry Permission”
On this chart, you already have the correct framework showing you the truth:
MTF aligned bullish = direction permission exists
Range phase + weak ADX = breakout-chasing is dangerous
Risk mod negative = don’t over-trust pushes; demand clean reaction
Supportive LTF exec = allow precise entries only at good location
So the fix is simple and brutal:
Rule 1 — Define the Earliest Valid Entry (EVE)
Your entry is valid when you have:
HTF permission (aligned bias)
location (discount / range low / protected structure)
reaction (rejection or displacement + micro shift)
Anything beyond that is not “smart.”
It’s often late.
Rule 2 — Use a Two-Step Entry, not a “Perfect Entry”
In range + weak trend environments:
Step A: Probe entry at best location with tight invalidation
Step B: Add only if the move proves itself (structure + continuation)
This keeps you early without being reckless.
Rule 3 — Confirmation should control size, not timing
If you want “extra confirmation,” fine — but don’t delay the entry.
Instead:
Enter with smaller size at EVE
Scale only when the market pays you (acceptance + continuation)
That’s how professionals stay early and controlled.
How to spot Confirmation Addiction in real time (self-audit)
If you catch yourself saying any of these, you’re in it:
“Let me wait for one more candle…”
“I’ll enter after the breakout is confirmed…”
“I missed the first move, I’ll take the next one…” (next one = worst location)
“I need the market to prove it” (translation: I want certainty)
Execution takeaway for this AVAX setup
With MTF bullish but range + weak ADX, your best money is usually made by:
entering at the range base / discount with tight invalidation
not chasing the last confirmation candle near the highs
Trend permission ≠ trend conditions.
That’s why “aligned” can still chop you if you enter late.
A late entry is not a safer entry — it’s a more expensive entry.
Trade uncertainty with rules, not with delay.
(Educational only — not financial advice.)
#Execution #TradingMindset #DayTrading #SwingTrading #CryptoTrading #FuturesTrading #BreakoutTraps #RangeTrading #RRMindset #PositionSizing #TradeManagement #Edge  Education