Chapter 18 — The Reversal TrapWhy trying to catch tops & bottoms destroys accounts
Most accounts don’t blow up from “bad strategy.”
They blow up from one addictive behavior: forcing a reversal when the market has not granted reversal permission.
A reversal is not a candle pattern.
A reversal is a regime change — structure, participation, and liquidity behavior must all rotate together.
1) The trap: “It fell a lot, so it must bounce”
After a strong impulsive move, your brain starts doing dangerous math:
“It already dumped,
Multiple Time Frame Analysis
NIFTY is weak below 25500!As analysed in our previous posts, NIFTY is currently trading at a no trade zone which could lead to immense volatility. Moreover it is also trading below 25500 which could lead to bearishness so unless and until it breaks either side, every rise can be sold so plan your trades accordingly and keep watching.
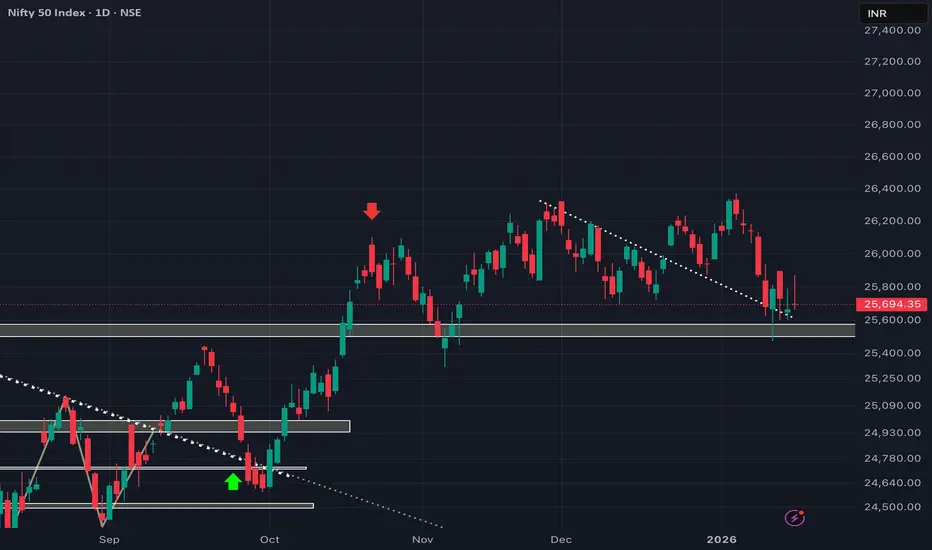
REVERSAL from our demand zone but stilll weak!As we can see NIFTY got rejected and did tried reversing but failed at now NIFTY isn trading at a no trade zone as supply and demand zones are closer that could lead to immense volatility hence one can scalp if appears on demand or supply zones and should not look for any positional trades for here.
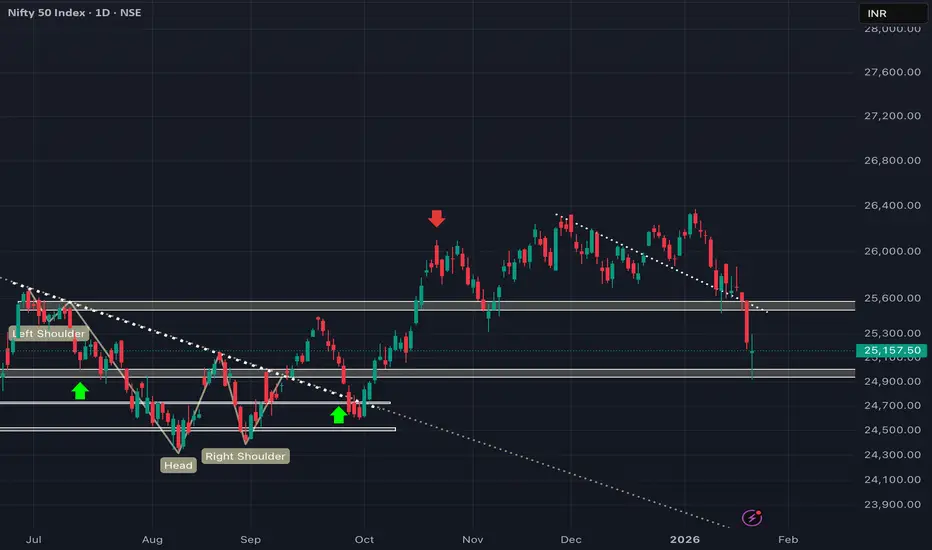
NIFTY failed to take support! Heading towards 24800 now! As we can see NIFTY failed to take support and broke its important demand zone and fell unidirectionally as that demand zone has been tested multiple times making it weaker. Hence, now that it has broken below, this support will now act as a resistance making our view to sell or every rise unless NIFTY manages to sustain and close itself above 25500 so plan your trades accordingly and keep watching everyone.
Chapter 17 — Stop-Loss RespectWhy SL mistakes are discipline failures, not technical errors.
( ETHUSD 1H chart attached)
Most traders think stop-loss problems are “technical”:
“My SL was too tight.”
“Wick hunted me.”
“Spread took me out.”
“The market is manipulated.”
That story feels logical. But it’s rarely the real cause.
The real cause is almost always the same:
Stop-loss mistakes are permission failures — not chart failures.
Because a stop is not a number.
A stop is a commitment to invalidation.
If your stop
REVERSAL tomorrow!??As we can see despite the weakness NIFTY managed to hold itself above our demand zone and managed to recover substantially and going by our analysis we can expect NIFTY to remain bullish until and unless it breaks below 25500 and sustains which is both a psychological and important demand zone. Hence until and unless NIFTY breaks below 25500 every dip can be bought for 26000, 26200 respectively so plan your trades accordingly and keep watching everyone.
Weakness in daily time frame but at SUPPORT in weekly TF!!As we can see NIFTY tried to recover after hitting demand zone multiple times but ended up forming an inverted hammer candle showing the dominance of seller but on the bigger time frame, it can still be seen trading above important demand zone and a doji kinda candle in weekly time frame so we may expect NIFTY to recover sharply if manages to sustain itself above 25900 so plan your trades accordingly and keep watching this important zones.
Will only short if NIFTY closes below 25500!!As we can see despite the weakness, NIFTY is holding itself above 25500 which shows bulls are still in control and can show short covering anytime sooner hence until and unless NIFTY manages to close and sustain itself below 25500, every dip can be bought so plan your trades accordingly and keep watching everyone.
Chapter 16 — Risk Is Decided Before Entry Why entry timing matters more than stop placement (Chart-Based Case Study: XAUUSD 4H)
This chart is the perfect example of a mistake many traders repeat:
They see bullish context and assume risk is “solved” by placing a stop.
But MARAL is showing something more professional:
The direction can be bullish while the execution environment is still high-risk.
That gap is where most losses are born.
1) What the chart proves: “Bullish context” is not “safe entry”
On your Context Board:
Direction: B
Triangle wedge analysis Clean read of your NIFTY 1H chart 👇
1) Primary Trend (Big Picture)
✅ Trend is bearish
Strong downmove from the top (~26370 area) to the low (~25473).
Structure shows Lower High + Lower Low → sellers are still in control.
So your context favouring bears is correct.
2) Current Structure (What is happening now?)
After the sharp fall, price is consolidating inside a triangle / wedge:
Pattern = Bearish Continuation Triangle
Upper trendline is sloping down → sellers pressing.
Lower trendli
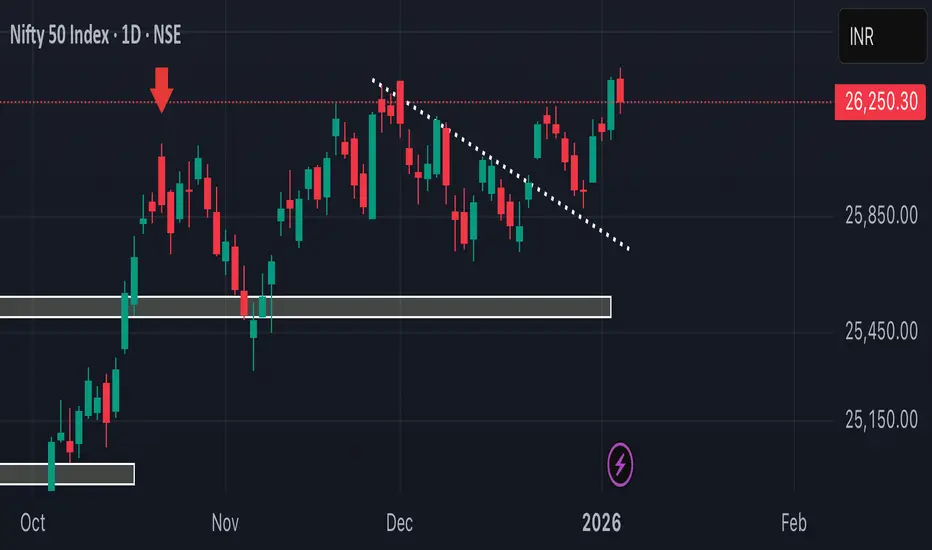
NIFTY is bullish as long as it is above 25500!As we can see NIFTY despite its try couldn’t hold itself above higher levels and fell but despite the fall it managed to close above the trendline and important demand zone hence standing by our analysis, we may see NIFTY showing signs of REVERSAL from here as long as it manages to sustain itself above 25500 so plan your trades accordingly and keep watching everyone.
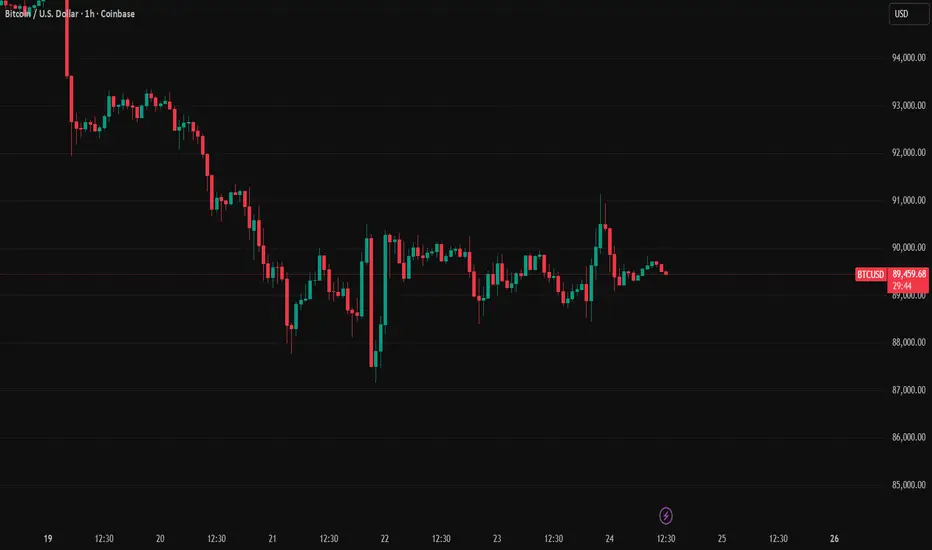
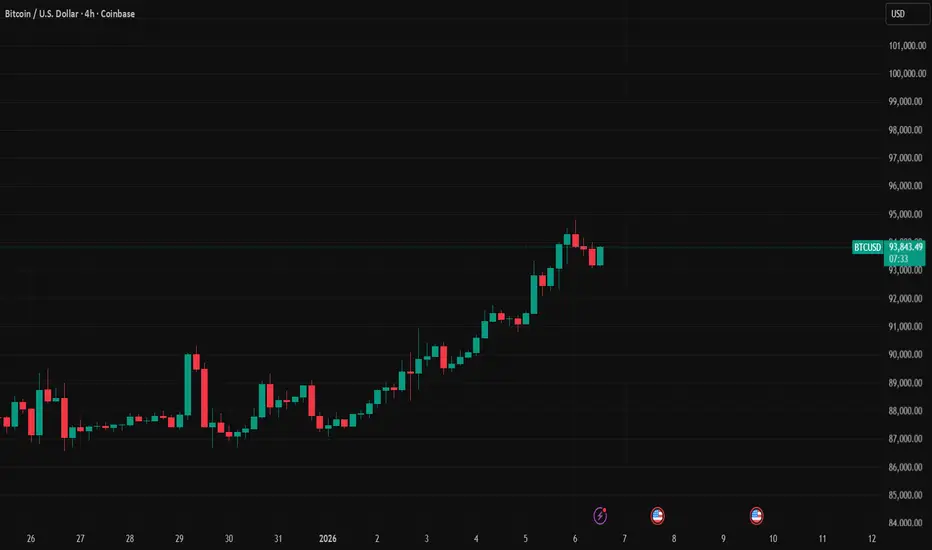
BTCUSD · 15M · SMC UpdateBuy-side liquidity above prior highs has been partially swept.
Rejection from supply shows acceptance failure in premium.
Market is now rotating back toward equilibrium.
LTF Structure
Impulsive move up completed.
Bearish response from supply with follow-through.
Current pullback is corrective, not impulsive.
Bias & Expectation
Favor shorts while price remains below the supply high.
Anticipate continuation lower toward:
Range low / EQ
Prior imbalance
HTF discount zone below
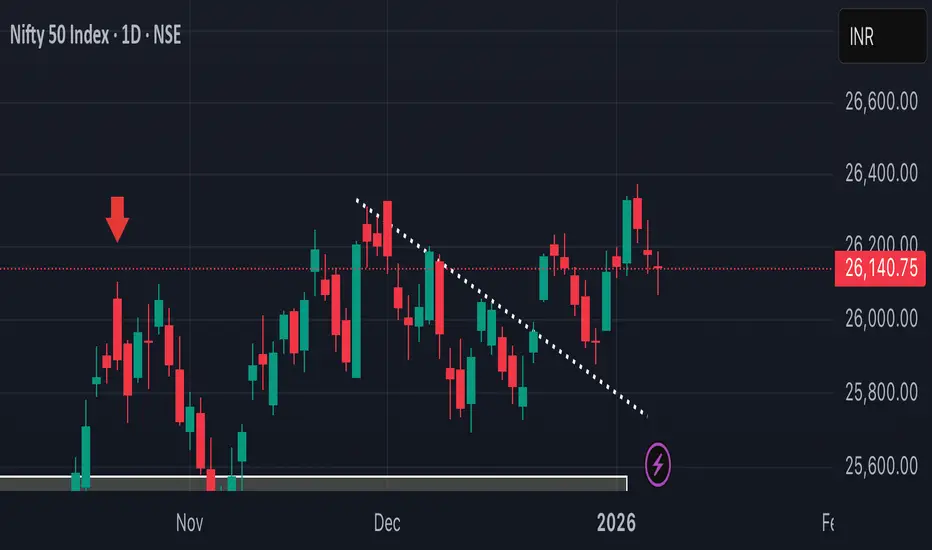
Strong BULLISH candle exactly as analysed from our level! As we can see NIFTY recovered almost 150 points from our demand zone and managed to close above our trendline support showing how well NIFTY follows its important zones it’s just that we have to believe in our analysis. Now that it managed to reverse from our demand zones with strong closing above trendline support, we may see NIFTY to continue its upmove towards 26000, 26200 respectively so plan your trades accordingly and keep watching everyone.
Chapter 15 — Confirmation AddictionHow waiting for “more confirmation” creates late entries (and worse trades)
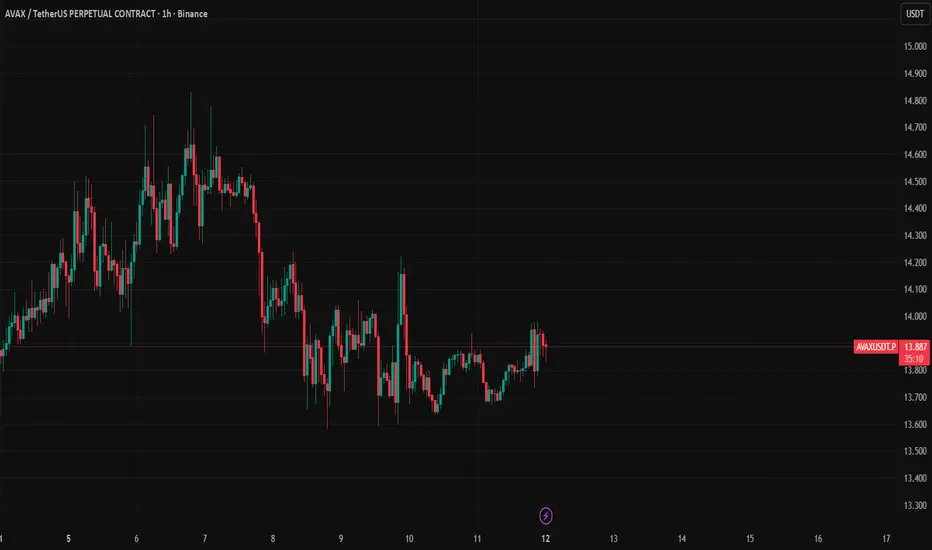
(AVAXUSDT.P — 1H chart reference attached)
Most traders don’t lose because they’re “wrong.”
They lose because they enter after the move has already paid the early participants.
That behavior has a name: Confirmation Addiction.
It sounds responsible (“I’m waiting to be sure”).
In reality, it’s often fear disguised as discipline — and it produces the same outcome again and again:
✅ you feel safe
❌ you enter late
❌ yo
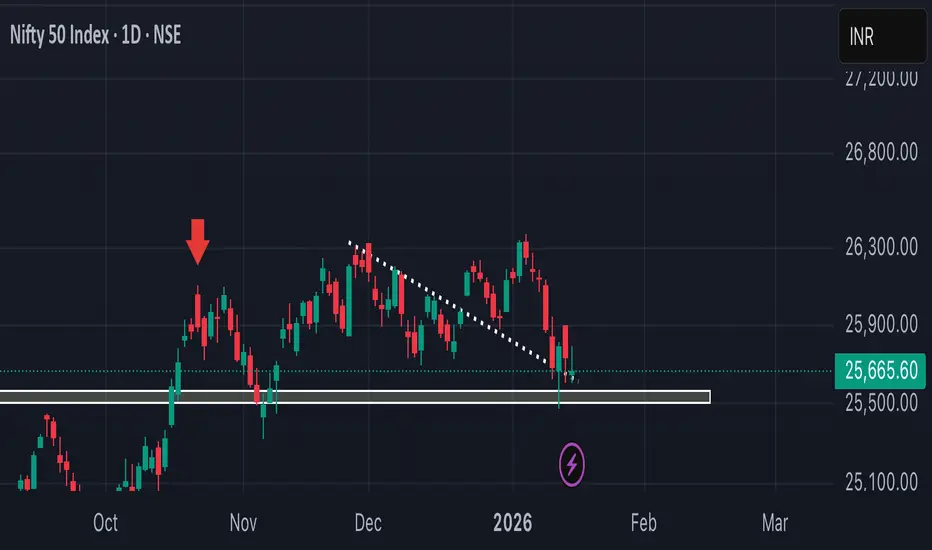
NIFTY might show REVERSAL from here!As we can see NIFTY finally has arrived at the trend line support which was very well anticipated and has been talking about it since its ATH. From its ATH NIFTY fell over 700++ points with proper conviction. Now, we may expect NIFTY to do short covering as this level is both an important support as well as important demand zone. So, one can book their short positions partially and trail their SL. plan your trades accordingly and keep watching everyone.
Chapter 14 — Range Is Not a Trend (Why most losses happen) Why most losses happen when traders trade chop like a trend.
(Chart: BNBUSDT 1H — HTF bullish + score A++… but Liquidity HIGH, Participation NEUTRAL, Risk State OVEREXTENDED, Risk Mode NEGATIVE, DIV NEG, Obstacle Ahead YES, Exit Pressure RISING → “trend-context / range-behavior” mismatch.)
1) The real problem: traders confuse bias with permission
Bias answers: “Where can price go?”
Permission answers: “Should I participate right now?”
In your snapshot, MARAL is basically saying:
Context: bulli
25900 is here! What’s next!?As we can see NIFTY did fell over 500++ points from our supply zone as analysed hitting or targets and now it can be seen trading at very important zone from where NIFTY reversed previously so we may expect NIFTY to show some minor short covering before finally heading towards our trendline support so plan your trades accordingly and keep watching everyone.
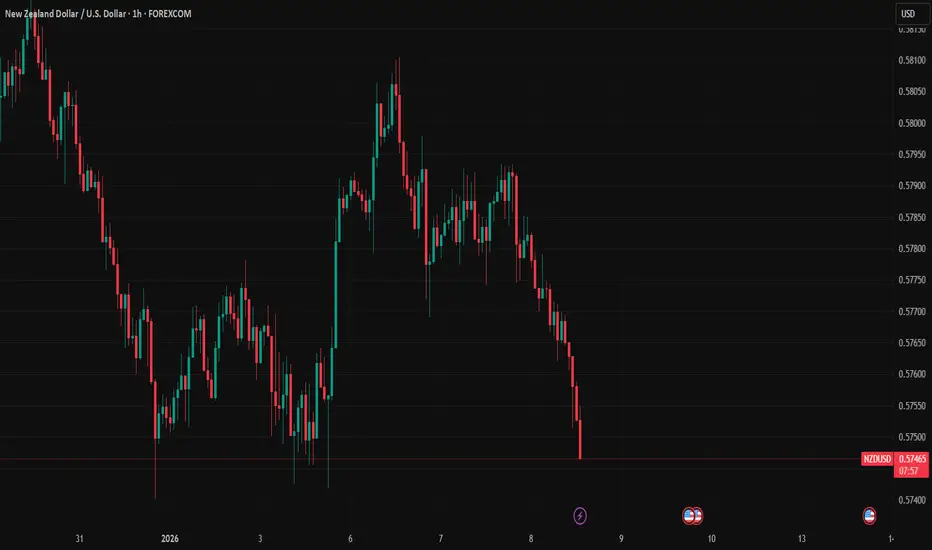
Chapter 13 — The First Entry IllusionWhy the “first entry” is rarely the safest entry (NZDUSD • 1H case study)
Retail logic says: “First touch = best price.”
Institutional logic says: “First touch = highest uncertainty.”
On the 1H, the first interaction with a zone is usually where liquidity is collected, not where clean continuation is guaranteed.
1) What “First Entry Illusion” really is
The illusion is thinking that a level is an entry.
But the market doesn’t pay you for finding levels.
It pays you for entering after the market
Chapter -12 The Waiting Skill (Why Waiting Is a Weapon)Chapter -12 The Waiting Skill (Why Waiting Is a Weapon)
Why inactivity is often more profitable than constant trading
Chapter 10 (Exit Intelligence & Trade Aging) proved something important: traders don’t actually need more signals — they need more control. The response i got (≈2.3K views + 131 Like) is the evidence: people are emotionally hungry for execution discipline and loss prevention, not “another buy/sell arrow.”
This chapter is the missing half of that story:
Exit Intelligence prote
Will remain short unless NIFTY breaks above previous high! As we can see NIFTY did show some rejection as analysed in our previous post and fell. We will stand by our analysis as Nifty is still trading in his supply zone and unless NIFTY sustains itself above previous swing every rise can be sold so plan your trades accordingly and keep watching everyone