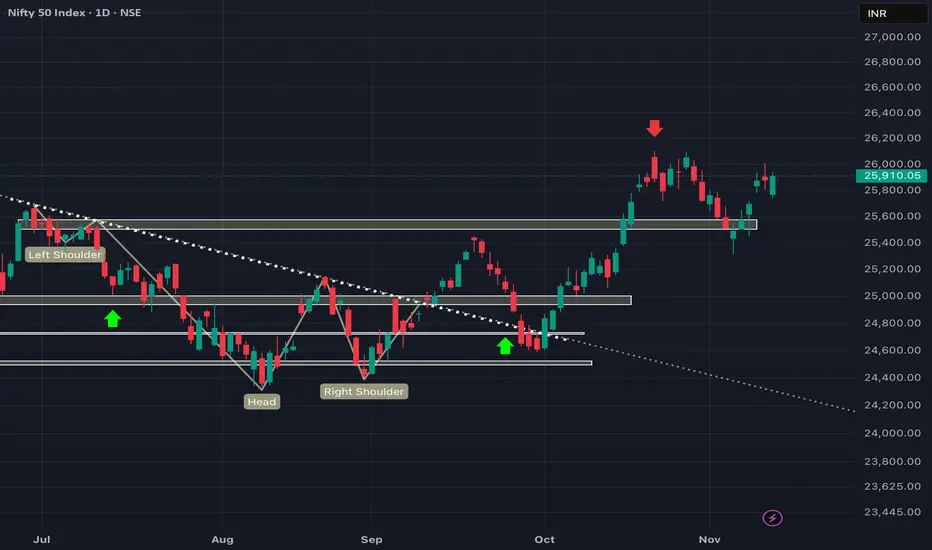
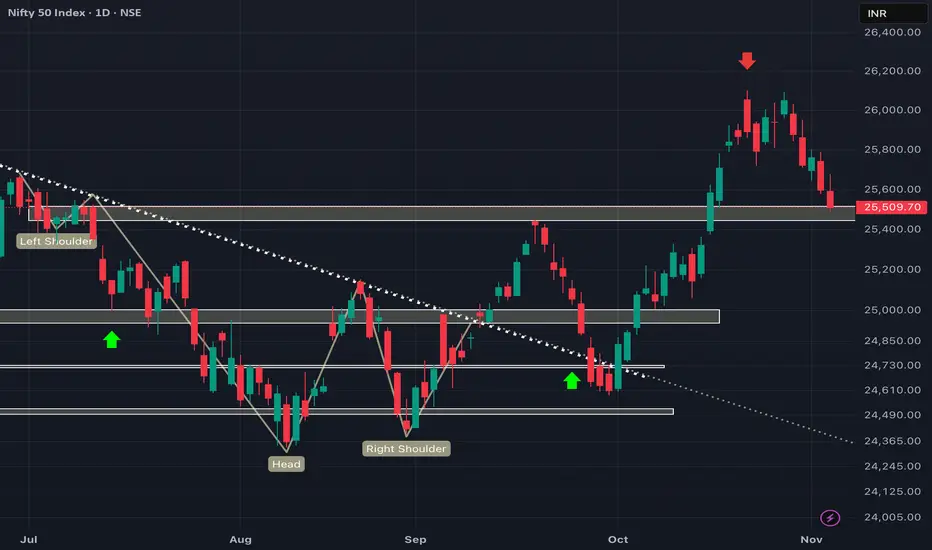
NIFTY got rejected from 26000! Weekly closing needed.As we can see NIFTY got rejected exactly from psychological level and important supply zone. Moreover, we can see it has been forming more like inverted head and shoulder pattern in bigger time frame. Any strong closing above 26000, can show strong upmove but until that we may see sideways to weak market so plan your trades accordingly and keep watching everyone .
Multiple Time Frame Analysis
Did NIFTY just turned bullish!? As we can see NIFTY managed to close itself above 26000 showing a bullish bias. Moreover, we can see NIFTY forming more like an inverted head and shoulders pattern in bigger time frame which is a strong bullish signal as this level has been tested multiple time making it weaker hence any closing above previous swing can show strong upmove! So plan your trades accordingly and keep watching everyone.
NIFTY looks WEAK as long as it doesn't closes above 26000!Following our analysis, NIFTY couldn't close itself above 26000 mark despite showing strong upmove which was induced by NDA winning over BIHAR which shows political stability in INDIA. On the other hand, despite the recovery, NIFTY couldn't close itself above 26000 mark which shows the lurking weakness which might come in coming trading sessions so plan your trades accordingly and keep watching everyone.
CERA – Demand Zone Confluence Supporting Bullish OutlookCERA has exhibited a notable price reaction from its Quarterly Demand Zone 📊, where price absorbed existing buy orders and initiated an upward movement 🚀. This reaction area coincides with the Yearly Demand Zone 🧭, thereby forming a strong confluence zone 🔗 that reinforces its structural significance.
On the Monthly timeframe 📅 , the active Demand Zone overlaps both the Monthly and Yearly Demand Zones . Such multi‑timeframe alignment ⚙️ typically represents a high‑probability suppo
Persistent Technical Analysis#Persistent Systems Limited - Technical Analysis
Chart Overview
**Timeframe:** Weekly (1W)
**Current Price:** 5,708.20
Technical Setup
Trend Analysis
The chart displays a compelling technical setup based on higher highs and higher lows pattern analysis. After a significant correction from previous highs, the stock has formed a strong base and is showing signs of trend reversal.
Key Observations
RSI Classic Divergence
The Relative Strength Index is displaying a classic bullish divergence
BankofIndia - Short to Long Term Investment BuyBank of India - Technical Analysis
Current Price: 129.77
Timeframe: Monthly Chart
Key Technical Observations
1. Currently, PSU banks are exhibiting bullish characteristics with positive sector support influencing the stock positively.
2. Cup and Handle Formation - The stock is displaying a gradually developing cup and handle pattern, a classic bullish continuation setup that suggests potential upside momentum.
3. Rising Channel Support - Bank of India is actively trading within and supported
EXACT rejection from 26000!! What's next!?As we can see NIFTY did achieve our target of 26000 as expected and got rejected exactly from there which was well analysed in our previous post about the possible rejection being both a psychological level and important supply zone. Now that we have seen strong rejection, we can expect NIFTY to remain negative in coming trading sessions unless it manages to sustain itself above 26000 levels so plan your trades cautiously.
26000 coming up again!!As we can see NIFTY showed strong upmove which was expect as it closed itself above previous candles high and met all our criteria's for confirming its strength. Moreover, we can see no immediate RESISTANCE that can cause NIFTY to reject. Hence sticking to our analysis, we may see NIFTY heading towards 26000 level being a strong supply zone and psychological level so plan your trades accordingly and keep watching everyone.
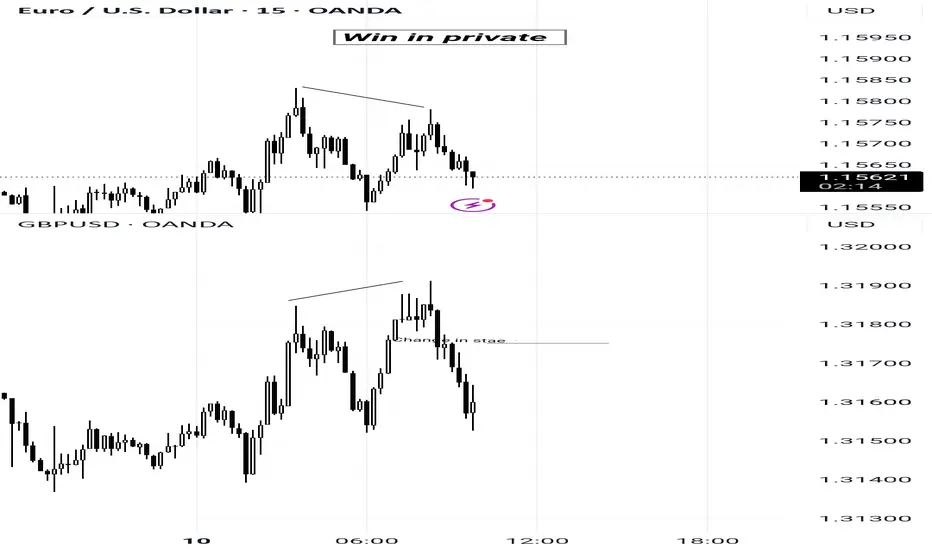
GU Shorts 12/11/2025As discussed earlier looking for price to move into the daily FVG on either EU or GU, there's SMT on Daily Time frame between these bros at the highs, and we're in a bearish orderflow, so I'm looking for a continuation setup in Newyork, selling from the bearish FVG if MY SETUP FORMS THERE.
There's also smt at the lows and if it invalidates the bearish FVG I'll not be taking any trades.
Thank you and manage your risk bois.
Keep Winning!
NIFTY just turned BULLISH!!As we can see NIFTY managed to close above previous swing and as per our analysis, its a sign of REVERSAL, moreover we can see it is getting rejected from a psychological level and a very strong demand zone hence we may now expect NIFTY to continue its bull run as long as it sustains itself above 25500.
EURUSD Trade Idea Shorts Tuesday/Wednesday WASUPPP LADSSS!
Yeah EU/GU are in a bhllish orderflow, I'm expecting them to continue higher but not before retracing back into the daily bullish Fair Value gap. So GU has printed a H4 Bearish FVG and there's smt between EU and GU on the Daily Time Frame. I'm expecting a second smt to push price lower into the daily fair value gap before continuing upwards, so short term i would be looking for sells.
So this is the plan, in London -
If price creates an smt divergence with DXY/GBP/USDCHF I would
NIFTY managed to close above 25500 but still looks weak!As we can see despite its close above 25500, Nifty can be seen forming more like an induction candle in daily time frame showing confusion and bearish power in the charts. Taking these in consideration, we can expect NIFTY to remain sideways to negative until it manages to close above previous candles high so plan your trades accordingly and keep watching everyone.
Trade Journal 4th trade -:10/11/25 - GBP SellWassup Lads!
So this was a trade I took which I exited at B.E., it was a risky sell - basically a counter trade in a bullish orderflow. I took it but exited it on a small profit because I was not feeling confident.
Anyway talking about the trade, this was totally a time based setup -
The reason for the trade -
1. SMT Divergence between EU and GU on the daily time frame
2. Second Stage SMT between EU and GU (London highs)
Two stage SMT confirmed the reversal but I didn't have much confidence c
How will 25500 act now! As a SUPPORT or RESISTANCE!?As we can see NIFTY showed strong recovery despite opening weak exactly as analysed bt failed to close above 25500 which could potentially make 25500 psychological level as STRONG DEMAND ZONE TURNED SUPPLY ZONE but will turn void if opens gap up and sustains itself above 25500! 25500 can be ascertained as a SUPPLY ZONE only if NIFTY despite opening strong fails to hold itself above 25500 and closes below so keeping all these important points in mind, plan your trades accordingly.
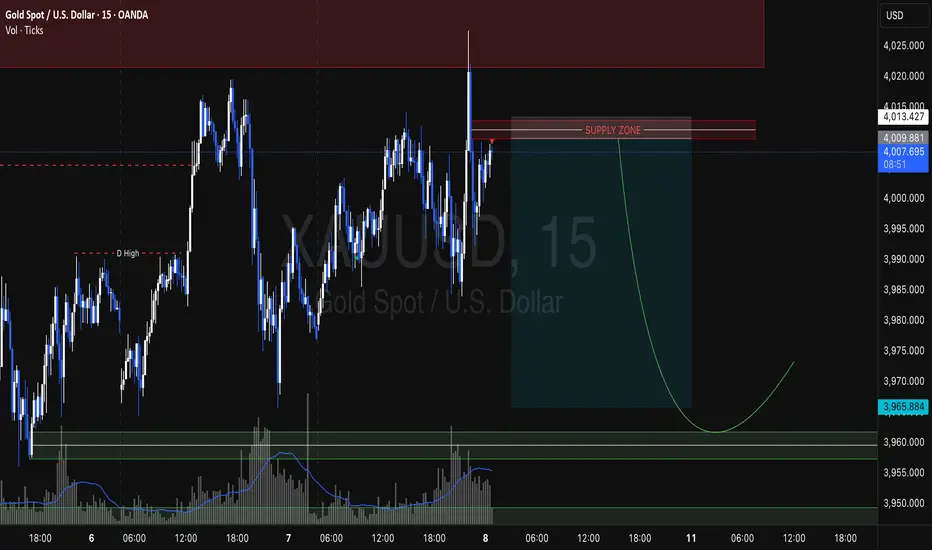
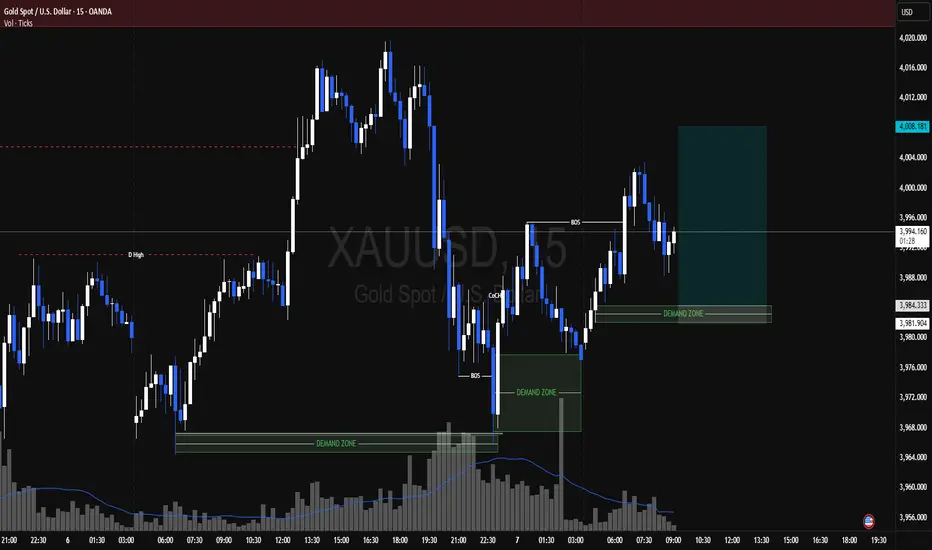
BTCUSDT Outlook 08/11/2025So right now, what I’m seeing on crypto today — honestly, it’s the weekend, and that’s never the best time to look for high-probability setups. But if we ignore the timing for a second and just focus on structure, I’m leaning bearish.
On the daily, the flow’s clearly bearish. ETH already cleared the daily FVG and showed SMT divergence with BTC, while Bitcoin couldn’t even take out the highs — basically an SMT sell setup between the two.
On the H4, you can spot the second stage of SMT divergenc
TARGET ACHIEVED!! Where are we heading next!? EXPLAINED We are finally at our target exactly as analysed and our patience and belief in oneself did paid off. Now, following the global cues, we can still expect NIFTY to open weak and fall but we have to look at tomorrow's closing as it is not just a day's closing but also closing for the week. Now we keep our bearish bias on following our analysis which is aligning with our analysis unless signs of reversal is seen around 25500 so plan your trades accordingly and keep watching everyone.
RBL Bank -Multi-Year #Breakout After 4 Years of ConsolidationRBLBANK has broken out of a multi-year resistance zone after a long accumulation phase since 2020.
This type of structure often leads to sustained upside momentum if the #breakout holds.
📌 Breakout Zone: ₹280 – ₹300
📌 Current Price: ~₹327
📌 Structure: Higher Highs & Higher Lows
📌 Volume: Strong accumulation visible
📌 Trend: Strong uptrend above long-term trendline & EMAs
Key Levels
Immediate Resistances ₹360
₹425 (Major long-term level)
Supports
₹300 – breakout retest zone
₹260 (major
Bajaj Consumer Care - Multi Year #BreakoutBAJAJCONSUMER has finally given a strong multi-year breakout after consolidating for almost 4+ years ✅
📌 Breakout Zone: ₹285 – ₹295
📌 Current Price: ~₹307
📌 Volume: Increasing – confirms accumulation
📌 Trend: Higher Highs & Higher Lows structure intact
📌 EMA Support: Riding above EMA – strong momentum
This kind of long-term range breakout often leads to multi-month / multi-year uptrends if sustained 🏆
Next Major Zones / Targets
₹330
₹360
₹400+ (Long-term)
Support Levels
₹288 – breako