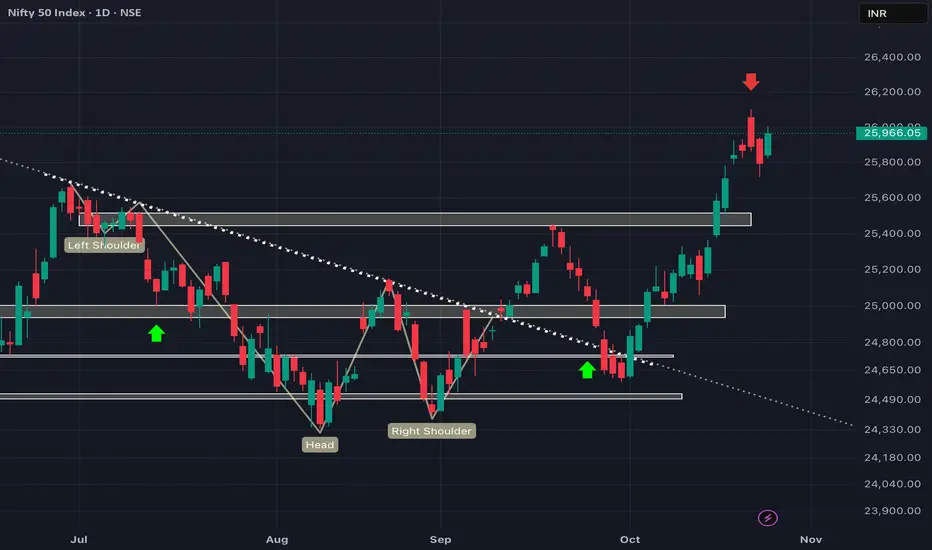
NIFTY getting closer to our target! What's next!?As we can see NIFTY fell more like unidirectionally exactly as analysed in our previous analysis and about to reach 25500 which had been our initial target. Now that it is about to reach our important demand zone, we may see NIFTY taking SUPPORT as this zone can act as a retest to the breakout and cam show substantial upmove from there if signs of REVERSAL is seen around the demand zone but if fails to take support and closes its candle below 25500 then that zone will act as a RESISTANCE which w
Multiple Time Frame Analysis
Protean eGov Technologies Ltd – Gap Fill Setup (Daily Chart)Protean eGov Technologies is showing early signs of base formation after a prolonged downtrend. The price is currently consolidating near the ₹850–₹880 zone, forming a potential accumulation structure that could lead to a gap-fill rally in the short to medium term.
The chart highlights two major unfilled gaps — a midway gap and a main gap — both acting as key upside targets once the current range breakout confirms.
🎯 Key Levels:
CMP: ₹866.80 (+2.25%)
Entry Zone: ₹850 – ₹880
Midway Gap Target:
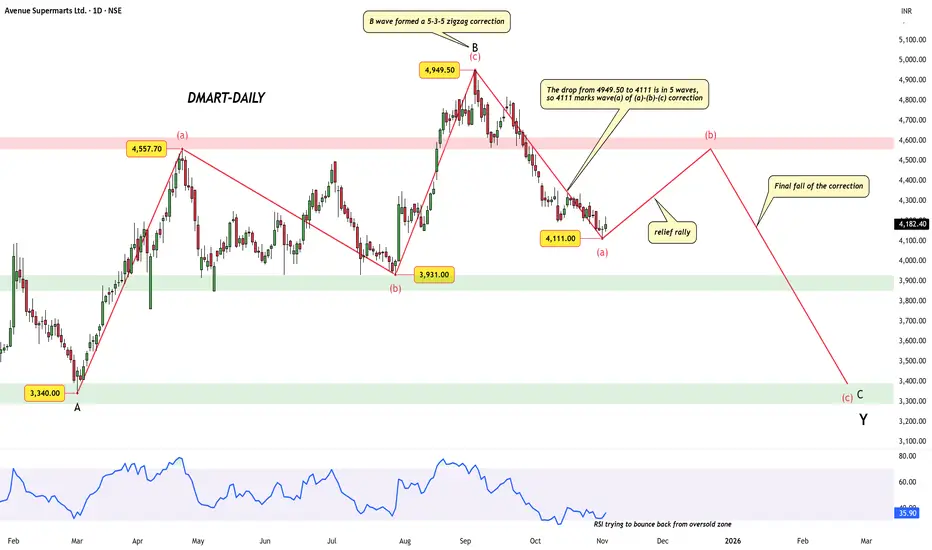
DMart(Avenue Supermarts Ltd) – A Correction Inside a CorrectionOn the daily chart, DMart(Avenue Supermarts Ltd) appears to be unfolding a clean (a)-(b)-(c) correction within the ongoing downtrend from ₹4,949.50.
The initial leg down to ₹4,111 unfolded in five waves, marking Wave (a) of the correction. A relief rally is likely next — an expected Wave (b) move that could face resistance around the ₹4,500–₹4,600 zone.
If this view holds, a final Wave (c) decline may complete the pattern near ₹3,300–₹3,400 — aligning with the previous demand area. RSI is tryin
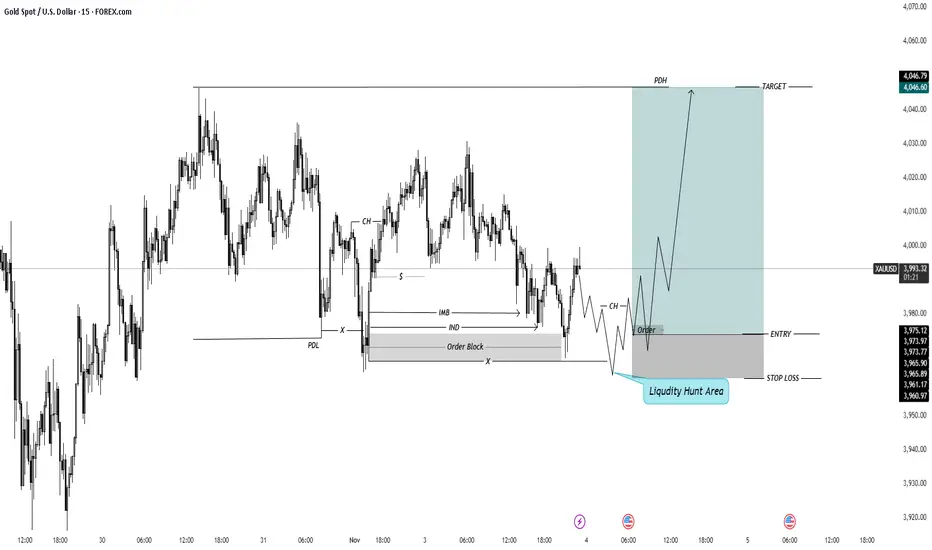
XUD/USD-Long-15MinInitially, the Previous Day High (PDH) and Previous Day Low (PDL) are marked on the Daily Time Frame. After that, we switch to the 4-Hour Time Frame to identify the Imbalance (IMB) candle for a potential entry setup. Once the IMB candle is identified, we move to the 15-Minute Time Frame, where the chart clearly highlights the Order Block and Liquidity Area.
The market then shows a clear Change of Character (CHOCH) indicating a shift from an uptrend. Following this, a liquidity hunt occurs as th
NIFTY still looks very weak!As we can see despite forming M pattern and breaking below, it still looks very weak looking at weekly candlestick which is aligning with our analysis since 26000 level! We will stick with our analysis until and unless NIFTY breaks above and sustains itself above 26000 and closes weekly keeping our first target intact at 25500. So plan your trades accordingly and keep watching everyone.
NIFTY might get weaker below 25700!!As we can see NIFTY has fallen exactly as analysed as it couldnt sustain itself above 26000 level. Now that it has closed below 26000, and also fomed M kinda pattern in bigger time frame which is a REVERSAL kinda pattern moreover we can see a strong bearish candle in WEEKLY time frame which can add fuel to fire hence sticking to our view, we will keep selling keeping target of 25500 in coming trading session so plan your trades accordingly.
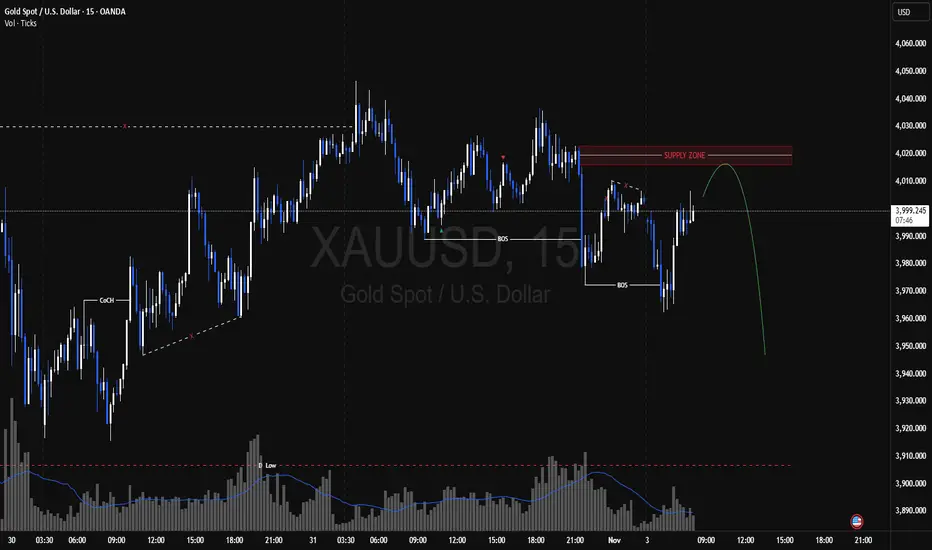
XAUUSDGold has been going down from the beginning of the week. There is possibility of retracement to the up side and take out Buy side liquidity.
Price slows down as it moves down.
Daily is closing bullish. Giving us Inside bar.
We can expect a sell side liquidity sweep and then reverse to target buy side liquidity.
Expect a pull back as price opens on Friday 31 Oct. then reverse to go up.
We are back below 26000!As said in previous analysis that it is too soon to confirm further upmove based on DAILY candle's closing above 26000 level as the weekly candle is yet to be formed. Since we have on more day to go, we may expect further bearish to volatile market so plan your trades accordingly and keep watching everyone.
Will only go LONG if weekly candle closes above 26000 level!As we can see NIFTY has shown unidirectional upmove and also managed to close above 26000 level but 2 more days is left to confirm its weekly closing above the resistance level. Till then we stand by our analysis, selling every rise for 25500 keeping stop loss above last swing and high of NIFTY that too closing basis so we must wait patiently to confirm NIFTY's direction keep watching everyone.
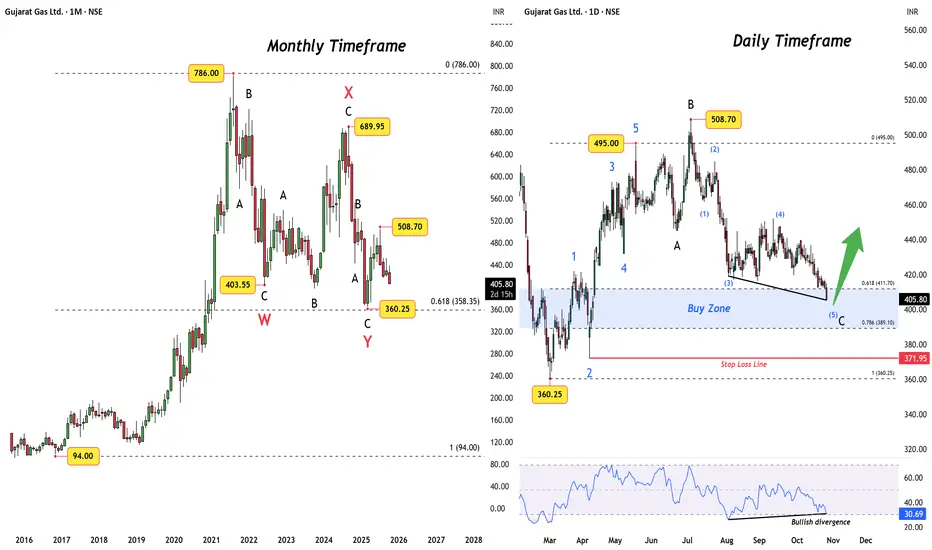
Gujarat Gas Ltd – A Major Correction Nears CompletionAfter a volatile two-year decline, Gujarat Gas Ltd (NSE: GUJGASLTD) may be approaching the final leg of a prolonged corrective structure — a setup that aligns beautifully across both monthly and daily timeframes.
The Bigger Picture – Monthly View
From the 2016 lows near ₹94 , Gujarat Gas advanced in an impressive impulsive manner , peaking around ₹786.
What followed has been a deep and time-consuming correction that unfolded as a double zigzag (W–X–Y) structure.
Wave W bottomed at ₹40
GLong
Will only gp long if sustains above 26000 level!As we can see NIFTY recovered sharply but managed to close below 26000 which is a strong supply zone. Moreover, we analysed in our previous post that we may see short term retracement towards upside and we did see that today. Now, we will only think of going long if sustains above 26000-26100 level until that every rise can be shorted for 25500 so plan your trades accordingly and keep watching everyone
Federal Bank: Wave 4 Triangle Near Completion, Wave 5 AheadAfter a clean five-wave impulse from the 2020 low near ₹35.70 to the 2024 peak at ₹220, Federal Bank appears to be transitioning into a larger corrective phase.
Weekly Outlook
The broader structure suggests the start of a 5-3-5 zigzag correction , marked as A–B–C .
Wave A is still unfolding — only Wave 4 of A appears complete, with Wave 5 expected next to finish the first leg of the correction.
Once Wave 5 concludes, price could rebound toward the lower channel trendline to form Wave B
SHREE CEMENT LIMITEDSSL (Sell-side Liquidity)
The chart shows a sweep below previous lows (SSL).
This indicates liquidity grab — where stops below that level were taken before price reversed.
This often signals the end of a bearish move and the beginning of a bullish structure shift.
FVG (Fair Value Gap)
A small imbalance (gap) formed after a strong bullish candle.
Price tends to revisit these gaps before continuing in the intended direction (in this case, upward).
BSL (Buy-side Liquidity)
Marked near the p
BTC USDTBitcoin is generating sell side liquidity. There is sign of rejections from top. Wait for Price to get into the supply zone and starting showing rejections in 4H, followed by 1H. Can take a deep retracement into supply. So I will wait till we have favourable sell conditions.
- Safe Entry. Wait for Daily rejection. Then wait fro 4H retracement. 4H rejection and we enter.