AARTI DRUGS technical analysisAarti Drugs Ltd. (NSE: AARTIDRUGS) is currently priced at INR 419.85. The company operates in the pharmaceutical sector, specializing in the manufacturing of bulk drugs, active pharmaceutical ingredients (APIs), and formulations.
Key Levels
Support Level: INR 302.50
Swing Level: INR 437.35
Possible Upside Levels: INR 586.30, INR 881.60, INR 1,036.45, INR 1,233.70
Technical Indicators
RSI: The Relative Strength Index (RSI) is currently at 51.01, indicating neutral momentum. RSI values between
Multiple Time Frame Analysis
Gold Bearish What do you guys think about this, I'm just waiting for the retracement and rejection to the strong resistance to take a short position, what I will be waiting is short pull back from the gold and reject to the MA50 and Fibonacci 50%-61.80% ( that I would plan to use later on my set up ).
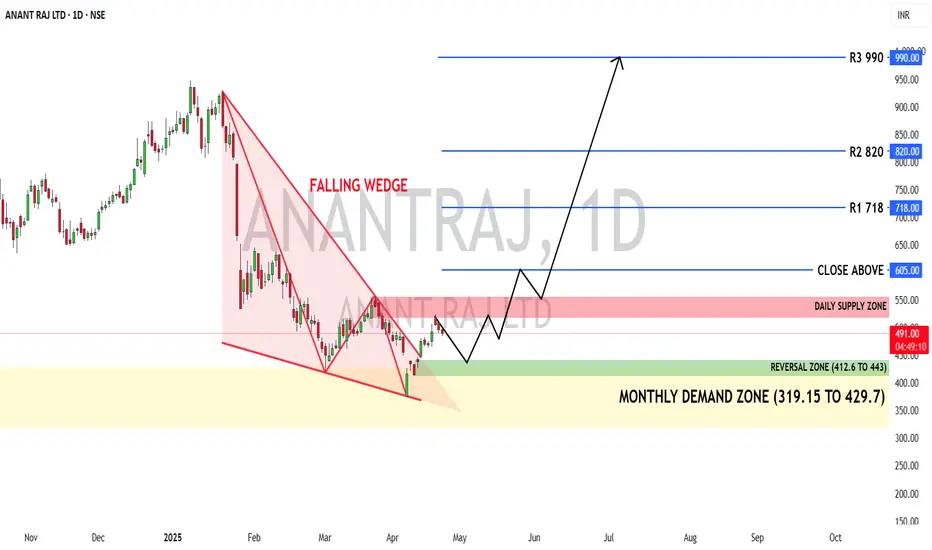
Anant Raj Ltd: Reversal in Sight with Strong Fundamentals🏢 Company Overview
Anant Raj Ltd is a leading real estate developer in India, focused on residential, commercial, and industrial infrastructure projects, primarily in the NCR. The company has consistently demonstrated strong execution, strategic land holdings, and diversified income streams.
📊 Fundamental Snapshot (FY 2023–24)
✅ Revenue & Profitability
Revenue: ₹1,961.91 Cr (+55% YoY)
Net Profit: ₹385.23 Cr (+72.65% YoY)
EPS: ₹11.27 (+68.29% YoY)
Operating Margin: 64.24%
Net Profit Ma
Bitcoin Scalping Strategy with 21/24 Trend Dashboard Title:
Bitcoin Scalping Strategy with 21/24 Trend Dashboard — Ultra-Clear Entry & Exit
Looking for clear, fast trade entries on BTC?
This scalping setup using the Trend Matrix Multi-Timeframe Dashboard by TechnoBlooms simplifies decision-making by compressing trend signals into one powerful grid.
⸻
Scalping Logic:
→ Enter a position when 21 or more out of 24 signals point in the same direction.
→ Exit the trade when 5 or more signals flip or diverge.
This rule-based setup is ideal for sca
Gold Scalping Strategy Using Trend MatrixTitle:
Gold Scalping Strategy Using Trend Matrix: Enter When 21/24 Signals Align!
Looking to scalp Gold (XAUUSD) with high conviction trades?
This setup based on the Trend Matrix Multi-Timeframe Dashboard by TechnoBlooms is built exactly for that!
⸻
Core Idea:
→ Enter the trade when 21 or more out of 24 signals show the same direction.
→ Exit when 5 or more signals start to diverge.
This makes it simple to trade with confidence — avoiding noise and fake moves.
⸻
Chart Setup:
• Asset: XA
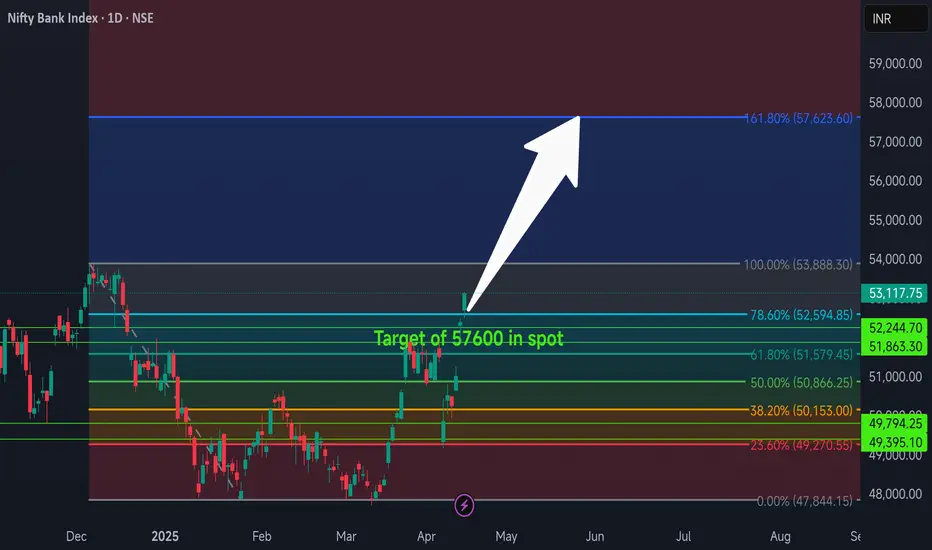
Clear upside direction in Banknifty for Indian Market. Soon ATHBanknifty has sustained above 50 sma and also has closed convincingly above the fibo channel of 78.6% on daily timeframe. Along with that long term trend and momentum indicators also have confirmed the bullishness. Once we see 50sma crossing above 200sma then the run will be extended and we will see an ATH after crossover happens on daily timeframe. The first target is 57600 and after that ATH
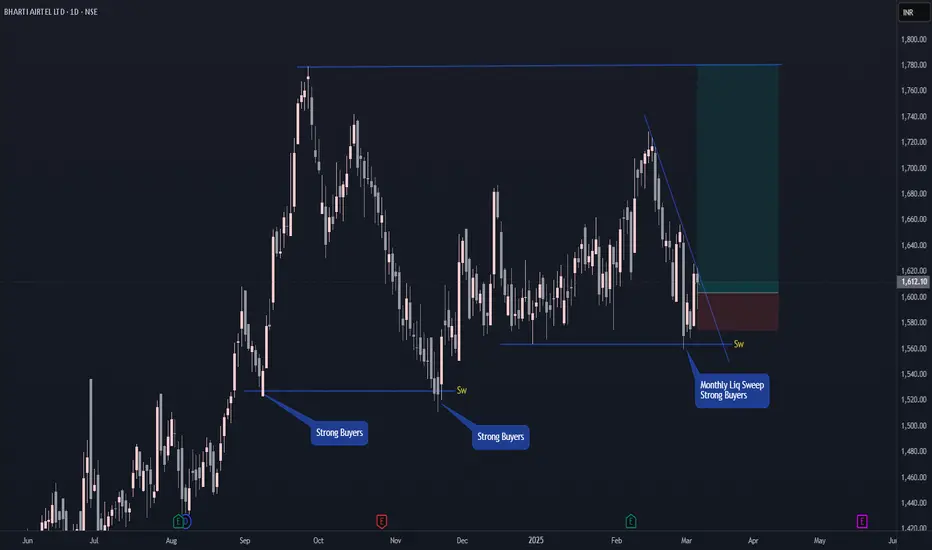
HINDUSTAN FOODS Swing Trade (Long)Strong buyers entered again trapping the sellers on monthly time-frame and making a liquidity pool.
On daily time-frame price is in up-trend and is going up by sweeping lows.
If Nifty holds current levels of 23000, (ie. if Nifty is not bearish) then there are high chances of
HINDUSTAN FOODS reaching the target levels.
1:5 Risk to Reward
Follow me for more such simple trade setups based on Trend and Liquidity.
Happy Trading!
ULTRACEMCO-4hr/1day Long tradeThe stock has corrected within the recent fall and fully recovered. Almost trading near ATH.
Current high has tested multiple times.
On next trading session it has to open above 11400 good opportunity for long, if gap down avoid.
Any confusion, feel free to drop msg. Happy to help :)
This is only for educational purpose, please manage your risk accordingly.
ETH Bull Week and Possibly the MonthBeautiful BULL cycle starting as of April 11, 2025. Hold every BUY position you have below the $1444.84. The 1477.29 LL has been broken. Marking the end of this Weekly Downtrend and sending the Long Buy Signal. Waiting on retest and going long Sunday April 13, 2025 at the
$1412-$1450. The LOWER, the better. I start with small leverage until the breakout is confirmed with the two daily candles. Don't miss out on the possible move! Be ready for a new week.
You're Welcome!! This is my analysis
SPX LONGLooking at the chart right here, as we can see the S&P 500 is bottoming, and we will see the same thing happened on 9 May 2022, so what I see or expect from the 2025 correction is rejection to the 50% fibonacci retracement which is around 20% or we can expect a deeper correction which is to the 61.80% and also with the rejection to the MA200 and hope it bounces back up, let me know what do you guys think about SP500 right now
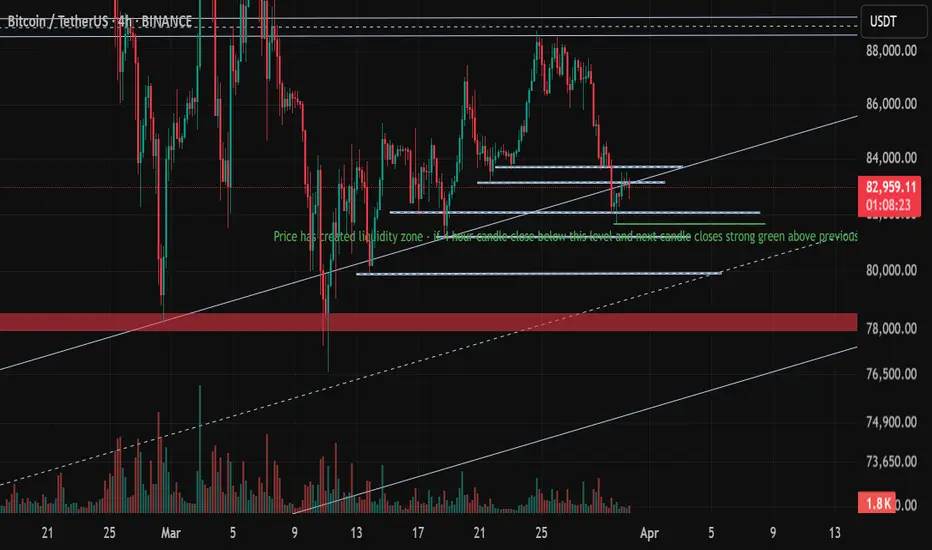
BTC for long on 4 hour - if condition metHere's the analysis of chart:
Bitcoin (BTC/USDT) 4-Hour Chart Analysis
1. Price Action & Trend
o The price is currently at $82,823.27, showing a minor decline of -0.35%.
2. Liquidity Zone & Key Support Levels
o A liquidity zone has been identified, as mentioned in the chart text.
Buying Condition - If a 4-hour candle closes below this level and the next candle forms a strong bullish reversal, it may signal a buying opportunity.
o The near support $81,000 is a significant support area, aligning
Waiting for bullish moveHere is the detailed analysis for a bullish trade setup on USD/JPY (4H timeframe):
Key Observations:
1. Resistance Zone (151.000-152.000)
- The price has rejected this level three times (as marked in red).
- This suggests strong resistance, and a breakout would indicate a strong bullish move.
2. Ascending Trendline Support
- The price has bounced off the trendline five times (marked in blue).
- However, a breakdown of this trendline could signal bearish movement.
PIRAMAL PHARMAStock Overview: Piramal Pharma, NSE, current price: ₹226.72. Piramal Pharma is a pharmaceutical company involved in the development, manufacturing, and distribution of pharmaceutical products.
Key Levels:
Support (yellow zone): ₹155.77
Swing zone (green zone): ₹188.29 to ₹229.93
Technical Indicators:
RSI (Relative Strength Index): The RSI is currently at 52.54, indicating a neutral momentum as it is near the midpoint of the scale (50).
Volume: The volume is 55.27M, showing significant tradin
Bajaj Holding Short Term Swing TradeBajaj holding has grabbed monthly and weekly liquidity while maintaining is uptrend.
If Nifty holds current levels ie. above 22400 then Bajaj Holding has high chances to move up and continue its trend.
Do like or follow for more Trading ideas like these. You can comment your views on this analysis.
GUJARAT FLUOROCHEM Swing TradeOn weekly time frame, a liquidity pool was formed and sellers got trapped two times in GUJARAT FLUOROCHEM forming a double bottom, which can fuel a good potential up move.
Also it has recently grabbed liquidity from previous day low so if Nifty holds above 23400 then there are good chances of GUJARAT FLUOROCHEM to reach T1 which will be a 1:4 RR trade.
AXIS BANKTechnical Analysis Report
Stock Overview: Axis Bank Ltd - NSE - Current Price: ₹1,097.85. Axis Bank Ltd is a prominent private sector bank in India, offering a wide range of financial services, including retail banking, corporate banking, and treasury operations.
Key Levels:
Support (Yellow Zone): ₹926.70 - ₹952.52
Swing Zone (Green Zone): ₹1,015.00 - ₹1,091.53
Technical Indicators:
RSI (Relative Strength Index): The RSI value is 52.62, indicating neutral momentum as it is close to the mid
23400 broken but 24000 is yet to be broken for confirmation !!As we can see NIFTY broke out of 23400 breaking all our expectation as we expected it to start retracement from this zone itself but showed unidirectional rally. now that it has rallied so much, we can see it heading towards another psychological level of 24000 which can act as a resistance so plan your trades accordingly and keep watching.
Abbott India Swing TradeOn weekly time frame, sellers are trapped badly in Abbott India which can fuel a good potential up move. Also it has recently grabbed liquidity from previous week low so if Nifty holds above 23000 then there are high chances of Abbott to reach T1 and T2 which will be a 1:5 RR trade.
TIME to get CAUTIOUS!! Save your MONEY !!As we can see despite the trendline break and strong reversal, we can see it trading around important SUPPLY zone which is around 23400-23500 levels which is also a psychological level hence any signs of reversal round these zones could show massive unidirectional fall the very same way it recovered so, unless NIFTY sustains itself above 23400-23500 levels no new long position should be made strictly and existing longs and can booked partially so nullify your losses in case if goes against your
Kalyani Steels trendline breakout - D timeframeKalyani Steels after achieving the target of 1179.50 exited parallel channel and held support at 700 range. Bullish reversal happened at 704.20 (mar 3) and bullish reversal confirmation at 721 (mar 17). Dec 17 '24 ATH to Mar 3 '25 precisely 44.86% fall as anticipated. Now price chart in daily timeframe showing double bottom with inverted hammer (Mar 19) along with RSI double bottom breakout. Weekly chart piercing line (i think) candlestick pattern along with RSI +ve divergence.
XAG/USD View For Weekend Analysis .Simmply we see the price in 4 H is bullish . If 1H candle close above High of Market as seen in chart after that you can plan long .
or If price reach in red box and after given candlestick confirmation on LFT then You can plan sell up to green box . then from green box plan buys