Multiple Time Frame Analysis
Swing Trade EntryProtecting your investment is your first priority
Based on higher time frame it is down trend and the lower time frame is showing signs for retracement/pullback. We have to avoid such entries but the target is wort the try with minimal stoploss.
- SL $4313
- Entry check 15min/5min/3min
- TP $4420
- Always place stoploss
- Reduce your trade quantity
Trade with caution and have a profitable trade.
Happy trading.
NIFTY heading towards 22800?As we can see NIFTY continued its weakness after a gap down opening, exactly as analysed. Now that we don't see any immediate support, we may expect NIFTY to continue its bearishness till its next demand zone, which can be seen around 22800 levels. SO, plan your trades accordingly and keep watching everyone.
GAP DOWN incoming but will it sustain?Following the global cues, we can expect NIFTY to open with big GAP down but we can see strong demand zone around 22800 and 22400 levels. Hence any signs of rejection around these levels can show strong short covering. However, if NIFTY manages to sustain itself above 22800 we might see 22400 in no time which is a next strong demand zone. So, plan your trades accordingly and keep watching everyone.
Trend Based Entry and ExitBased on ongoing trend in higher time frame and lower time frame we can say the price action is bearish.
- In 4H the price action has formed lower high
- In your preferred lower time frame 30m/15m/5m you can check for entry.
- Expected target $4395 by today or by tomorrow.
- Trade with caution, always have a entry plan and exit plan.
- Do place stoploss.
- Make sure your, first priority is to protect your capital.
We can only confirm NIFTY's bullishness above 23600As we can see NIFTY has shown significant short covering after opening weak, but we can only confirm NIFTY's bullishness if NIFTY manages to close itself above 23600 level as this a strong support turned resistance and hence we can expect NIFTY to get rejected from this area. Hence, until and unless NIFTY manages to sustain and close itself above 23600, every rise can be sold. SO, plan your trades accordingly and keep watching everyone.
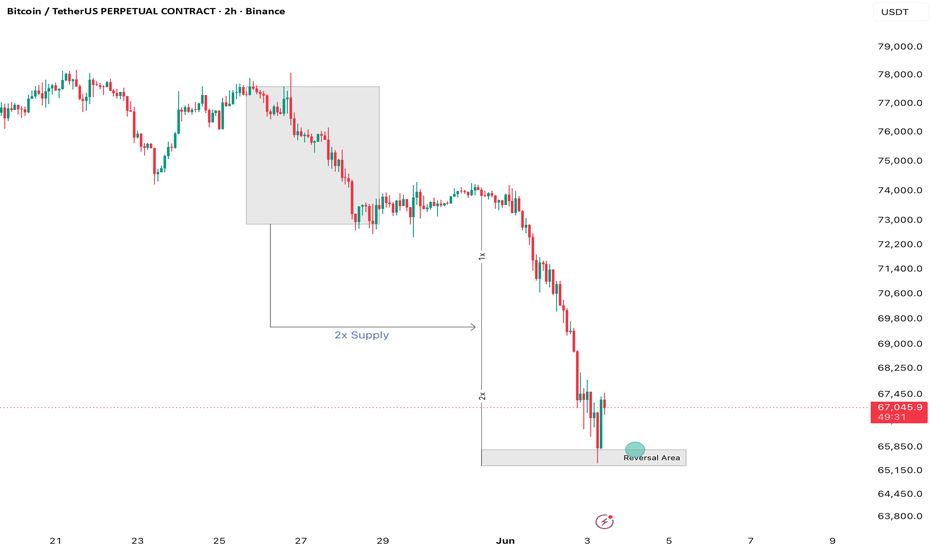
BTCUSDT: Massive 2x Measured Move Completed—Time to Buy?BTCUSDT has completed a massive 2x measured move downward from a premium supply zone and is currently testing a key historical Reversal Area between $65,000 and $65,650.
Market Overview & Structure
1. Supply Zone Distribution
The Premium Block: Price initiated a heavy sell-off from a well-defined distribution range between $77,000 and $78,000.
Institutional Imbalance: This zone represents an aggressive institutional supply imbalance that rapidly shifted market control to sellers.
2. The 2x Measured Move
The 1x Extension: The initial leg down established a definitive momentum benchmark.
The 2x Projection: Sellers completely exhausted the mathematical downside target at 2x Supply, plunging the market perfectly into the lower extreme.
Trading Setup: Long Position Potential
Execution Strategy
Entry Zone: Look for entries within the highlighted Reversal Area ($65,000 - $65,650). Wait for lower-timeframe validation (e.g., a bullish engulfing candle or a change of character on the 15m/1h charts).
Stop Loss (SL): Place strictly below $64,500 to protect against a liquidity sweep of the structural lows.
Take Profit 1 (TP1): $68,500 (Immediate structural resistance).
Take Profit 2 (TP2): $73,000 (Major mid-range supply block).
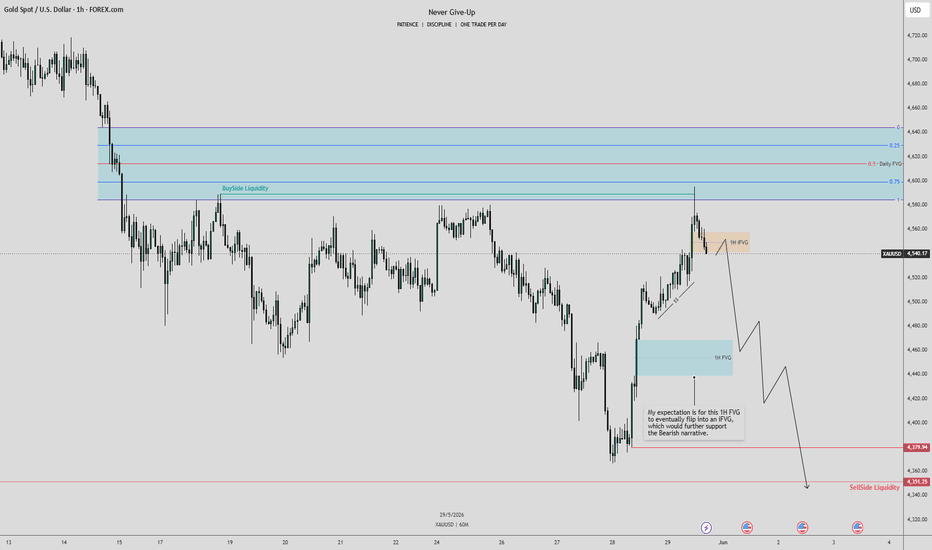
02/06/2026 XAU/USD ( Gold ) AnalysisFOREXCOM:XAUUSD
The reason for taking a short trade on Gold is that price has entered the OTE zone. Since Gold is currently in a downtrend, the probability of a sell-side liquidity sweep remains high.
I entered my initial position at Equilibrium. If Gold retraces deeper into the OTE range, around the 0.62 or 0.705 levels, I may consider adding to the position based on price action and market conditions.
NIFTY might show more of weakness from here As we can see NIFTY has closed below the trendline which makes NIFTY even weaker. Hence as long nifty manages to stay below the level, we can expect nifty to remain even weaker, because NIFTY can now act as a resistance. So until and unless we see closing above the trendline, ever rise can be shorted for bigger targets. So plan your trades accordingly and keep watching everyone.
BTCUSDT 02 JUNE 2026bitcoin is currently trading at a 4H support zone.
Huge Selling pressure seen at the bottom 5M candle low which got absorbed, but price is still under VWAP, once VWAP shifts lower and price breaks above we can look for longs.
Current scenario is range/consolidation till a clear upside or downside potential.
Will not short unless NIFTY breaches 23470As we can see NIFTY fell sharply in last 30 minutes largely due to MSCI rebalancing. Now we can see NIFTY trading at an important trendline support. So unless NIFTY beaches below 23450 level, it should not be shorted as we can expect NIFTY for some short covering subject to opening of Hormuz and us-Iran agreement. So plan your trades accordingly and keep watching everyone.
31/05/2026 XAU/USD AnalysisFOREXCOM:XAUUSD
This is my analysis for XAU/USD.
Gold could potentially reverse from its Daily FVG and move lower to sweep the sell-side liquidity. However, I believe it may take some time for that sell-side liquidity sweep to develop. Until then, I’ll continue to monitor price action and wait for confirmation before looking for short opportunities.
31/05/2026 EUR/USD AnalysisFOREXCOM:EURUSD
This is my analysis for EUR/USD.
EUR/USD is currently trading from its Daily FVG and has the potential to deliver a higher-timeframe market structure shift. On the lower timeframe (15M), price has already shown a market structure shift, indicating a possible change in order flow.
With that in mind, EUR/USD could move lower to sweep the remaining sell-side liquidity before continuing with its intended directional move.
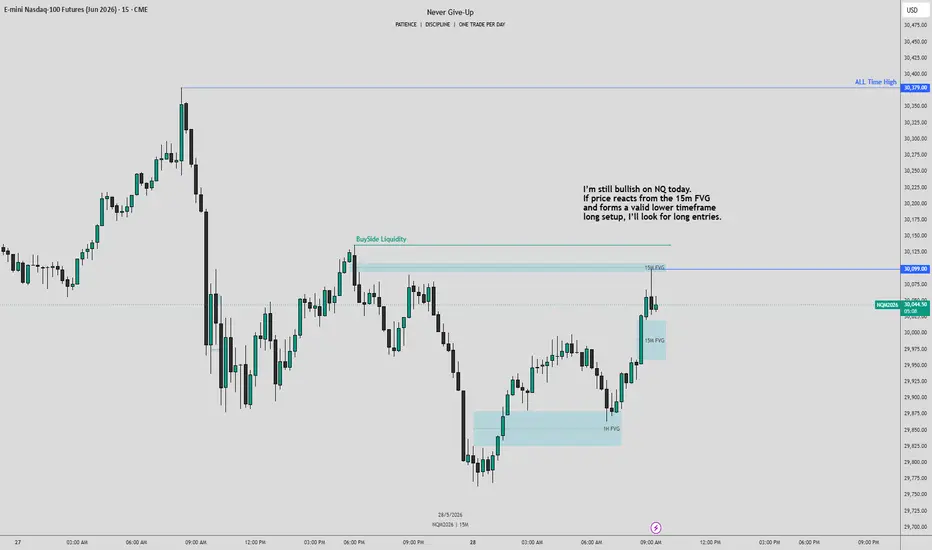
31/05/2026 NQ AnalysisCME_MINI:NQ1!
This is my NQ analysis for Monday.
My expectation is for NQ to retrace into its 4H FVG, engineer a liquidity sweep, and then continue higher into the buy-side liquidity.
However, if Sunday’s 6:30 PM ET open creates either a significant gap up or gap down, the scenario will be different. In that case, I’ll reassess the market conditions and adapt to the price action accordingly rather than sticking to a fixed bias.
IGB 10Y Monthly/Weekly UpdateSimilar to April Month, IGB 10Y yields traded in the range of 6.88%-7.15% during May month, closing flattish on MoM basis. 7.00% has been acting as a good resistance level in the recent times which I expect it to be continue, unless there are some positive developments wrt ongoing US-Iran War. RBI MPC outcome scheduled on June 5, and GDP release data on June 7 can act as a near term triggers for the market. High crude oil prices, and expectations of below normal monsoon aiding to the inflation concerns. FII outflows and depreciating rupee are further adding stress on the yields. Hence, RBI commentary is the important thing to watchout for during this month.
Let me know your thoughts. DYOR.
We are still above our demand zone.As we can see NIFTY despite the weakness, managed to close itself above the demand zone, showing strength. Hence, we can expect NIFTY to remain bullish until it manages to sustain itself above 23800 levels. The agreement to open Hormuz can act as a catalyst to further make NIFTY more bullish. So plan your trades accordingly and keep watching everyone.
We are bullish as long as we are above 23800 As we can see NIFTY strongly rejected but since since it is still above our demand zone, makes us still bullish now. Hence as long as NIFTY manages to sustain itself above 23800, every fall can brought technically! So plan your trades accordingly and keep watching everyone.
A respite in taxation in trading can make NIFTY more bullish!As we can see, NIFTY showed a strong recovery in the closing hours which was due to a hint in Finance minister's statement that could show respite in taxation. This respite in taxation is a big news as this could attract more investors and give existing investors more room to trade, which could create a positive sentiment, which could lead NIFTY to further upmove. Additionally, Technicallly, as long as NIFTY manages to sustain itself above 23850, every dip can be bought, sp plan your trades accordingly and keep watching everyone.
NIFTY might show strong upmove above 23850As we can see NIFTY had been testing 23850 levels multiple times now, making it weaker. The agreement made between US and Iran to open up Hormuz, can act as a catalyst to further fuel the upmove. Hence, we can expect NIFTY to show strong upmove above 23850 levels. It will be important now to see it NIFTY manages to hold itself above the level or not, else it could result in another trap that could result in strong fall. So, plan your trades accordingly and keep watching everyone.