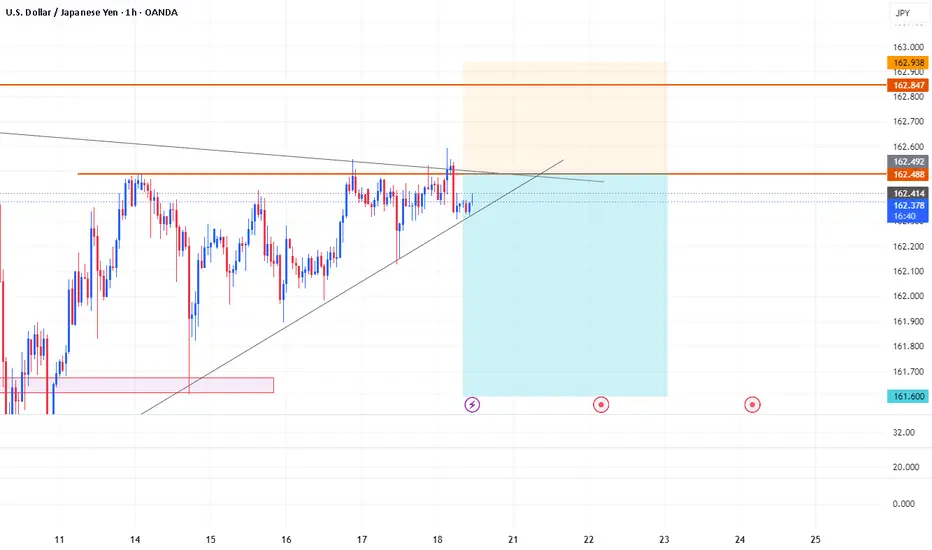
Long
Long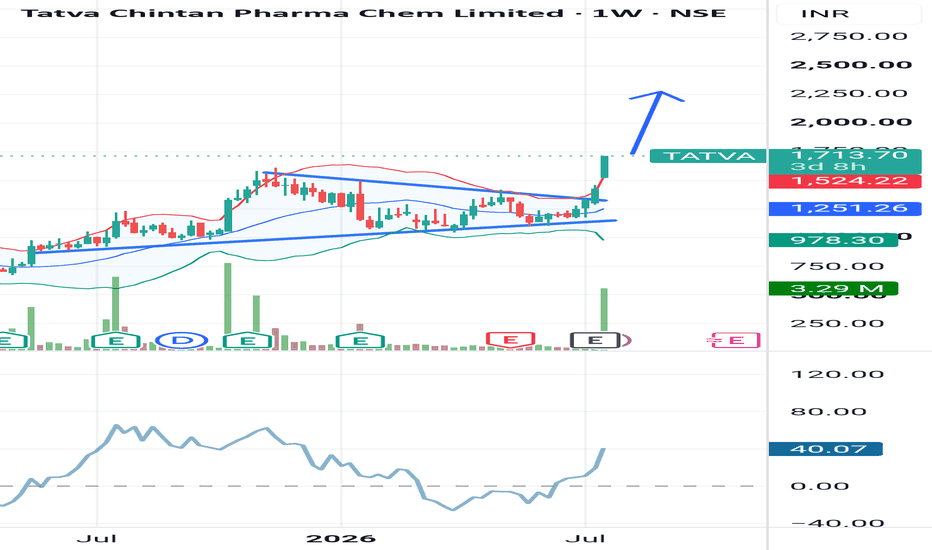
 Long
Long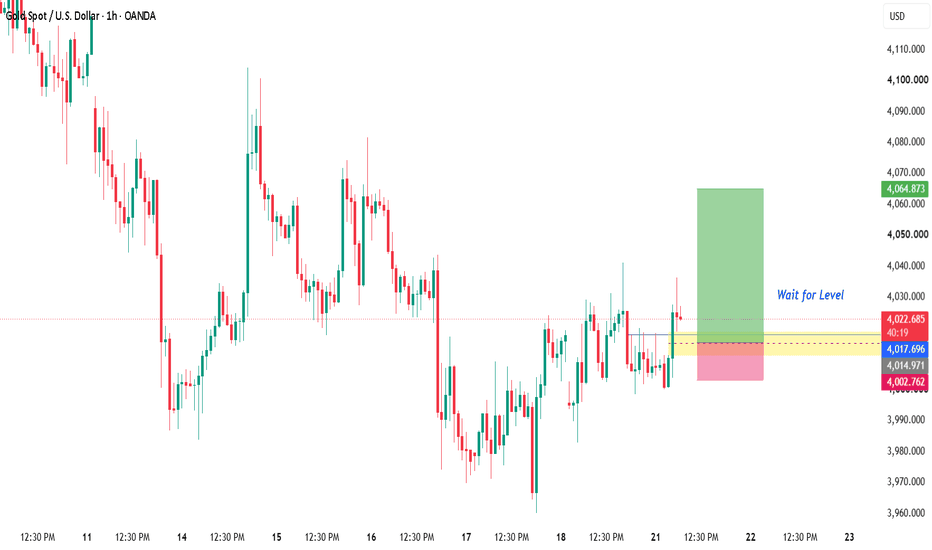
 Short
Short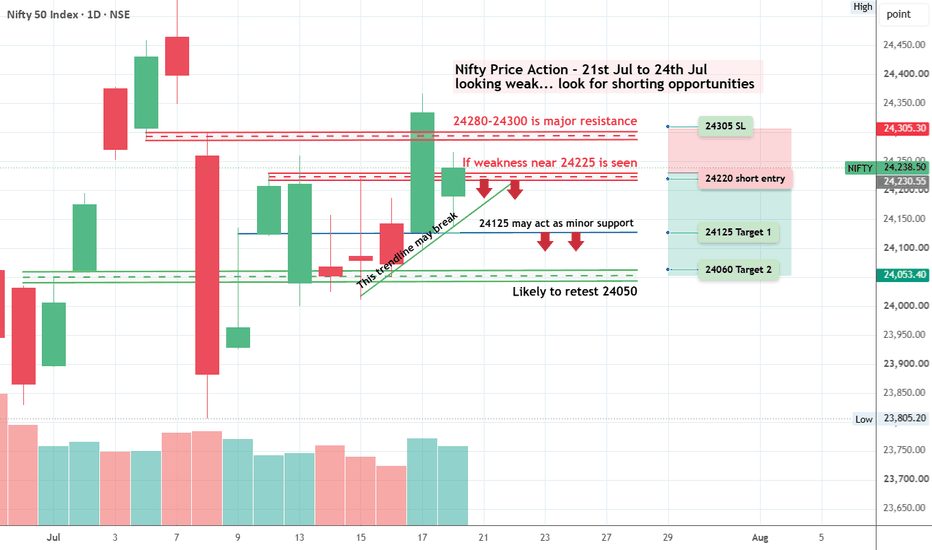
 Long
Long
SPX: Bearish Rejection & Potential Pullback to SupportSPX: Bearish Rejection & Potential Pullback to Support 📉
Description:
The S&P 500 (SPX) is showing signs of a bearish rejection at the upper supply zone on the 1-hour timeframe. After failing to sustain momentum above the recent high, the price has initiated a downward move, breaking below immediate structural support. We are now monitoring the development of this pullback as the index approaches the identified demand zones, which are likely to act as key support levels for potential stabilization or buyer intervention.
Key Structural Levels:
🔴 Major Resistance / Invalidation Zone: 7,560 – 7,585
📈 Current Reaction Level: 7,533
🔵 1st Support Objective: 7,460
🔵 2nd Support Objective: 7,348
Trading Perspective:
We are looking for a continuation of the current bearish flow toward the 1st Support zone. If the price fails to find significant demand at these levels, it could signal a deeper retracement. Traders should monitor price action closely as we approach these objectives to identify signs of absorption or reversal.
This analysis is based on technical structure and market behavior, not financial advice. Nifty Bank Trade Plan [21.07.2026: Tuesday]Probable Scenario Analysis and Trade Plan for the Nifty Bank Index NSE:BANKNIFTY for the 21st of July, 2026. The day is Tuesday.
🟢 Bullish Scenario
There is no observable bullish setup. The price must sustain above 58250. There might be a weak bearish move till 58500. The price will receive strong resistance at 58500. Next, if the price sustains above 58500, then a strong bullish move might emerge. The probable bullish target above 58500 would be 58750.
🔴 Bearish Scenario
There is no observable bearish setup. The price must decisively break down below 57500. Level 57500 is a strong support. Also, the monthly (July 2026) opening price is at 57573.35. Additionally, the weekly opening price is 57738.25. Therefore, the cluster around the zone of 57500 would act as strong support. It is not advisable to short unless there is a decisive breakdown below 57500. The probable bearish targets below 57500 would be - 57250 and 57000. Level 57000 would be a strong support. Next, if the price breaks down below 57000, then the probable bearish targets would be - 56750 and 56500.
🟡 No Trading Zone (NTZ): (58500 - 57500).
⏺ Range of Consolidation (ROC): (59000 - 57000).
Here, 58000 is the median of the ROC. The median works like an intraday sentiment evaluator. The price trading above the median would offer bullish sentiment, while the price trading below the median would trigger bearish sentiment within the ROC.
● Event
No high-impact event this week. One medium-impact event is the Euro Interest Rate Decision on 23rd July (Thursday). No holidays this week. There is Nifty 50 weekly expiry. Lastly, geopolitical issues are omnipresent.
● Intraday Bias
Establish intraday bias with respect to the opening price. If the price sustains above the opening price, then don't think of shorting. Look for bullish trades only. On the contrary, if the price sustains below the opening price, then don't think of going long. Look for bearish trades in that case.
● Chart Pattern Identified
"Rounded-Top" in the Weekly time frame. Maybe it is a sign of a trend reversal (bullish to bearish).
● Disclaimer + End Note
- All the analyses would fail in the case of a major gap up, gap down, or price structure anomaly. Thus, practice PRAGMATISM in the live session.
- Trade only if there is a set-up. Remember, not trading is an extension of the trading activity.
- Mark your points. Trade your points. Price is GOD. Anything can happen in the markets. Thus, trade what you see, not what you believe.
- Always PRACTICE RISK MANAGEMENT. Always PROTECT YOUR CAPITAL. Be RESPONSIBLE.
- Be Strategic. Be Courageous. Be Patient. Be Wise.
- Every day is a new day. Thus, do not carry the baggage of past successes or failures. Leave the gardens of winning and losing. Establish yourself in equanimity. Always think from a new perspective.
- Let the joy of trading drive your effectiveness, not greed or fear. Believe in Possibilities.
Happy Trading!  Long
Long
 Long
Long
 Long
Long
 Long
Long
Long 
BRIAN XAUUSD – GOLD REBOUNDS, BUT SELLERS STILL CONTROL HIGHER BRIAN XAUUSD – GOLD REBOUNDS, BUT SELLERS STILL CONTROL HIGHER VALUE
Gold is recovering slightly from the monthly low area, but this bounce is not strong enough to confirm a bullish reversal.
The market is still trading under pressure as US-Iran tensions and energy-driven inflation concerns keep the USD supported. With the Fed narrative turning more hawkish again, gold remains vulnerable whenever price moves back into higher supply.
This is why I do not see the current rebound as a clean buy trend. It looks more like a value rotation before sellers test the market again.
Volume Profile structure
On the 2H chart, gold has reacted from the Buy Reaction Base around 3,995 - 4,000 and is now moving towards the POC Reclaim Zone near 4,028 - 4,035.
This zone is important because it represents the next value test. If price cannot reclaim and hold above it, the rebound becomes weak and sellers may return from this area.
The Upper Value Target around 4,075 - 4,080 remains the higher liquidity zone. Gold can still reach it if buyers build acceptance above the POC Reclaim Zone, but without that confirmation, the upside remains limited.
Important zones
Buy Reaction Base: 3,995 - 4,000
Lower value support where buyers reacted from the recent low.
POC Reclaim Zone: 4,028 - 4,035
Main decision zone and preferred sell-reaction area.
Upper Value Target: 4,075 - 4,080
Higher resistance if gold reclaims value strongly.
Highest peak of gold: 4,103
Major upside reference if momentum expands.
Trading scenario
Sell reaction from POC Reclaim Zone 4,028 - 4,035
Entry:
Look for sell positions only if price rebounds into 4,028 - 4,035 and shows clear rejection.
Stop Loss:
Above the POC Reclaim Zone or above the local rejection high.
Take Profit:
TP1: 4,000
TP2: 3,980 - 3,985
TP3: Trail lower only if sellers break the lower value base
This setup is based on the idea that gold is rebounding into value resistance, not building a confirmed bullish trend yet.
Final view
Gold can still bounce from the low, but sellers remain active at higher prices.
The key area is 4,028 - 4,035. If gold fails there, the current recovery may turn into another sell opportunity.
If buyers reclaim this zone with strength, then the next target becomes 4,075 - 4,080.
For now, I prefer waiting for price to test the POC Reclaim Zone and react.
Is this rebound real strength, or just another move into supply?
Long 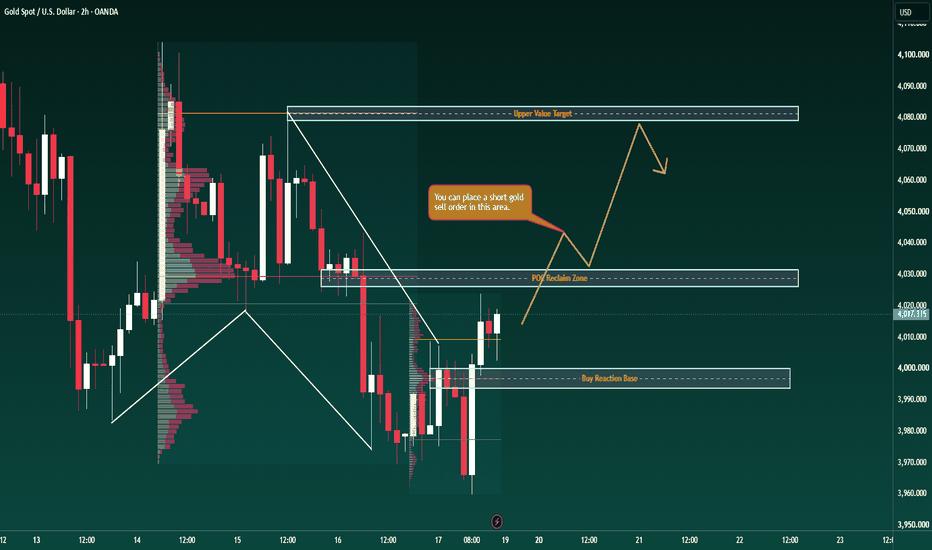
XAUUSD (M30) | Will Gold Sweep Demand Before the Next Expansion?Gold remains trapped beneath a well-respected descending trendline, keeping the broader intraday order flow tilted to the downside. Despite the recent recovery, price has yet to reclaim the previous swing high, suggesting buyers are still struggling to regain control.
From an ICT / Smart Money perspective, price is currently reacting around a bullish Order Block near 4,000-4,005, while a stronger First Demand rests around 3,985-3,990. A liquidity sweep into these zones would be consistent with institutional accumulation before any meaningful expansion.
Overhead, the Premium FVG around 4,030-4,035 aligns with the descending trendline and remains the primary supply area. Unless this confluence is decisively broken, rallies may continue to serve as liquidity collection rather than confirmed bullish continuation.
Trading Scenarios
Bullish: A sweep into 4,000-3,990, followed by a strong MSS/CHOCH, could open the path toward 4,030, then 4,060.
Bearish: Failure to defend the Order Block would expose the deeper demand below 3,990, extending the corrective decline.
With a relatively light U.S. economic calendar today, price action may remain technically driven. Watch for liquidity grabs around the marked institutional zones rather than chasing impulsive moves.
Key Levels
🟢 Demand: 4,000-4,005
🟢 Major Demand: 3,985-3,990
🔴 Premium FVG: 4,030-4,035
📉 Bias: Neutral-to-Bullish above demand, bearish below 3,985.
This analysis is for educational purposes only and reflects an ICT/Smart Money framework, not financial advice. Long 
XAUUSD: Wave 5 bearish trend continues.Gold is still trading under short-term bearish pressure after failing to hold above the recovery trendline. From Kelly’s view, the current structure suggests that price may be preparing for another downside continuation, with wave 5 still open towards the lower Fibonacci target zones.
The key idea is simple: gold may retest resistance first, but the bearish structure remains valid while price stays below the sell zone.
⟡ Market structure
The chart shows gold attempted to recover from the lower area, but the rebound lost strength near the 4,020–4,030 region. Price is now trading around 4,004 and reacting below the broken uptrend line.
This is important because the trendline that previously supported the recovery is now acting as a retest area. If gold cannot reclaim this line with strength, the current bounce may only be a correction before the next bearish leg continues.
The nearest sell-test area is around 4,005–4,012, while the stronger sell zone wave 4 sits near 4,020–4,030. As long as these zones hold, sellers still have the technical advantage.
➤ Key levels
◌ 4,005–4,012: sell-test trendline zone
◌ 4,020–4,030: sell zone wave 4 and main resistance
◌ 4,004: current price reaction area
◌ 3,982: first buy scalping reaction level
◌ 3,959: next support checkpoint
◌ 3,938–3,945: Fibonacci 1.618 target area
◌ 3,855–3,865: possible wave 5 completion zone
◌ Above 4,030: area where the bearish setup starts to weaken
⌁ Elliott Wave view
From an Elliott Wave perspective, gold appears to be developing the final part of a bearish 5-wave sequence.
Wave 1 started the downside move after the recovery failed.
Wave 2 created a short rebound but could not break the structure.
Wave 3 pushed price lower with stronger selling pressure.
Wave 4 is now likely forming as a retest into the trendline and sell zone.
If this resistance holds, wave 5 may continue towards 3,938–3,945 first, then 3,855–3,865 if momentum expands.
This is why Kelly would not treat the current bounce as a bullish reversal yet. The market is still below the key resistance and the Elliott structure still supports one more downside leg.
▸ Trading scenario
Preferred scenario: wait for price to retest the sell-test trendline or the sell zone wave 4 and show bearish confirmation.
Sell zone: 4,005–4,030 if rejection appears
Stop loss: above the confirmed rejection high or above 4,030
Take profit 1: 3,982
Take profit 2: 3,959
Take profit 3: 3,938–3,945
Take profit 4: 3,855–3,865 if wave 5 extends strongly
Alternative scenario: if gold breaks above 4,030 and holds with strong acceptance, the bearish wave 5 setup weakens. In that case, price may move into a larger corrective recovery before the next direction becomes clear.
⌁ Kelly’s view
For Kelly, this is still a sell-the-retest structure. Gold has not fully reversed yet, and the current reaction is happening under the broken trendline and wave 4 resistance.
The cleaner plan is to wait for confirmation near resistance, not chase price while it is already close to support.
Gold remains vulnerable below the sell zone.
If sellers defend 4,005–4,030, wave 5 may continue towards the Fibonacci targets below.
Share your view below. Short 


 Long
Long
 Short
Short