Long
Long

 Short
Short
 Short
Short
 Short
Short
Nifty 50 Weekly Trade LevelsMarket Analysis
The Nifty 50 weekly chart indicates a bearish market bias, with price trading below the major resistance zone of 24,600–24,700. Recent price action suggests rejection from higher levels, formation of lower highs, and weakness in the overall market structure.
The RSI is below 50, indicating weak momentum and increasing selling pressure. Price is currently positioned between the marked resistance and support zones, making it important to wait for confirmation before entering any trade.
Important Support & Resistance Levels
Major Resistance Zone: 24,600–24,700
This zone acts as an important supply area. A sustained breakout and weekly close above this resistance may indicate a shift toward bullish momentum.
Major Support Zone: 22,200–22,600
This is the key demand zone. A bullish reversal from this area may provide an opportunity for a long trade, while a decisive breakdown may open the possibility of further downside.
Bearish Trade Setup – Short
Market Bias: Bearish
Entry Zone: 23,600–24,000
Stop-Loss: 24,750
Target 1: 22,600
Target 2: 22,200
Target 3: 21,800
Support Reversal Setup
Entry Zone: 22,600–22,800, after bullish confirmation
Stop-Loss: 22,000
Target 1: 23,400
Target 2: 24,000
Breakout Setup
Entry Zone: 24,700–24,800, after a confirmed breakout and successful retest
Stop-Loss: 24,300
Target 1: 25,300
Target 2: 25,800–26,000
Final Market View
The current weekly structure favors a bearish bias below the 24,600–24,700 resistance zone.
Preferred Strategy: Sell on rise after confirmation.
Major Downside Support: 22,200–22,600.
Bullish Confirmation: Sustained breakout above 24,700.
Bearish Confirmation: Decisive breakdown below 22,200.
Trade only after confirmation. The market can change direction at any time.
DISCLAIMER :
This content is created by Logic Trade Room for educational and informational purposes only.
It is not financial advice, investment advice, trading advice, or a recommendation to buy or sell any security, index, futures contract, or options contract.
Trading and investing in the stock market involve substantial risk, including the risk of losing your entire invested capital. Past performance does not guarantee future results.
The entry, stop-loss, and target levels mentioned are illustrative chart-based levels and may change with market conditions. No trade setup or market prediction is guaranteed to be accurate.
Always conduct your own research, verify live market prices, and consult a qualified financial advisor before making investment decisions.
Trade with logic. Risk with discipline.
Logic Trade Room  Short
Short
 Long
Long
 Long
Long
 Long
Long
 Long
Long
AAPL: Monthly Ascending Channel & Resistance Breakout1. The Macro Perspective: The Secular Ascending Channel
I am taking a LONG bias on Apple Inc. (AAPL) on the monthly (1M) timeframe.
When analyzing pure market structure on a mega-cap tech leader, long-term trend channels dictate the primary narrative. Look at the structural development on this chart. Since the pandemic crash in early 2020, AAPL has been flawlessly respecting a massive ascending parallel channel. This channel acts as a mechanical roadmap: the lower boundary consistently serves as a deep-value accumulation floor, while the upper boundary acts as a profit-taking zone. Following the most recent test of the channel's lower support line in early 2026, institutional buyers aggressively stepped in, launching the stock back toward the top half of the structure. Fundamentally, this fierce momentum aligns perfectly with Apple's recent blockbuster Q2 2026 earnings report, where the company delivered $111.2 billion in revenue and announced a massive new $100 billion share repurchase authorization.
www.investing.com
2. The Educational Setup: Clearing Horizontal Resistance
To understand the technical validity behind this recent thrust, look at how the price interacted with key horizontal levels within the channel:
The 251.93 Support Base: During the mid-channel chop, sellers tried to push the price lower but repeatedly failed at the 251.93 structural support. This established a critical, unbreakable higher low.
The 282.22 Resistance Ceiling: The main obstacle preventing AAPL from reaching the channel top was the solid black horizontal resistance line drawn at 282.22. This marked a major historical pivot where supply previously capped rallies. By chopping tightly beneath this line while the moving averages caught up, the stock built the necessary kinetic energy for a major breakout.
3. Current Price Action: Volatility Expansion and Channel Top
Look at the most recent monthly candle on the far right of the chart. The structural pressure cooker has exploded. Buyers have seized absolute control, printing a massive, full-bodied green expansion candle that has decisively shattered the 282.22 resistance ceiling. The stock has surged to fresh highs near the 311.40 mark, driven by major positive catalysts such as the upcoming CEO transition to John Ternus and Apple's continued dominance in the premium consumption market. Furthermore, this aggressive move has pushed the price directly into the upper boundary of the macro ascending channel.
www.perplexity.ai
4. The Trade Plan: Entries, Targets, and Risk Management
Entry Strategy: Momentum is incredibly strong, but the stock is currently running directly into the upper resistance line of the multi-year channel. Buying blindly at the absolute top of a channel carries a severe risk of a mean-reversion pullback. The highest-probability, lowest-risk entry strategy involves stepping down to the weekly timeframe and waiting for a structural cooling-off period. Look to scale into long positions on a healthy pullback that perfectly retests the broken 275.00 to 285.00 zone. Letting the 282.22 historical resistance prove itself as a concrete new support floor offers a phenomenal risk-to-reward ratio.
Take Profit (Targets): If AAPL can establish the 282.22 level as support, the primary objective is a continued grind along the upper channel boundary, projecting a structural macro target zone of 340.00 to 350.00 over the coming quarters.
Invalidation (Stop Loss): The bullish continuation thesis is severely damaged if the price fails to hold the mid-channel support and collapses back below the breakout zone. A hard stop loss should be placed safely below the 251.93 swing low, around the 240.00 to 245.00 level. A definitive monthly close completely below 240.00 would act as a major warning sign of structural failure and a break of the macro channel.
5. Time Horizon:
Because this technical setup is engineered on a 1-Month chart capturing a secular channel and a major horizontal breakout, this is a longer-term position trade designed to capture sustained macro markup over the coming months and quarters. Let the mega-cap trend run!  Long
Long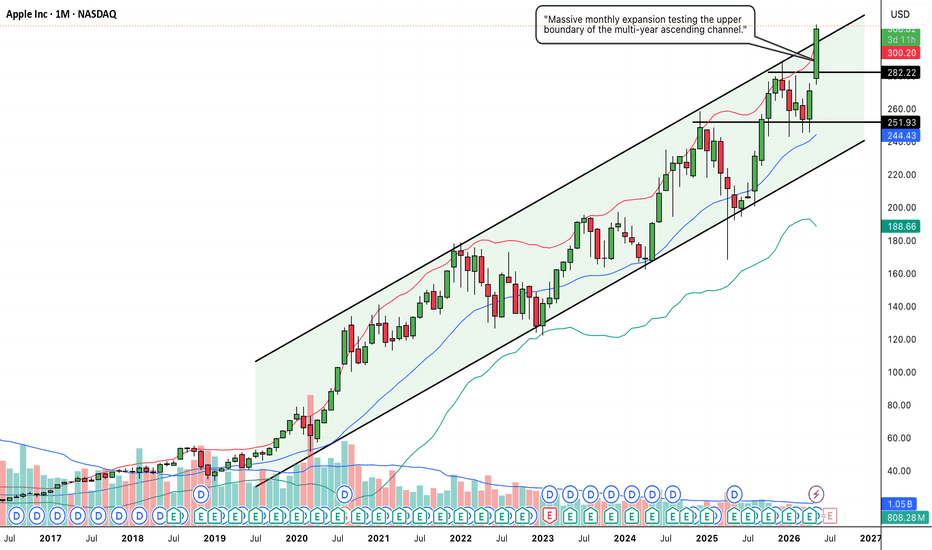
Short 
The 5% Threshold : When Bonds Challenge StocksFor years, the comparison between bonds and stocks was relatively simple: bonds offered lower returns with lower risk, while equities offered greater upside in exchange for greater uncertainty. But when the U.S. 10-year Treasury yield moves toward 5%, that comparison starts to look very different.
The important part isn't the number 5% itself. It's what happens to the choices available to investors when a relatively low-risk asset begins offering a more meaningful return. At that point, owning equities isn't just a question of whether stocks can rise. Investors also have to ask whether the expected return is high enough to justify taking the additional risk.
The flow is simple:
Yield ↑ → Risk-free return ↑ → Opportunity cost ↑ → Valuations face more pressure
That doesn't mean stocks must fall. That's where the analysis becomes more interesting.
A higher Treasury yield can pressure equity valuations through the discount rate, but strong earnings growth can offset part of that effect. If companies can grow profits quickly enough, investors may still be willing to pay a premium for equities. The market is therefore constantly balancing two competing forces: the return available from safer assets and the growth available from riskier ones.
This is where the 5% level matters.
It changes the conversation. When Treasury yields were significantly lower, investors had fewer attractive alternatives for capital that needed income. As yields rise, the opportunity cost of holding an expensive asset becomes harder to ignore.
Think of it this way:
Higher bond yield
→ more attractive alternative
→ higher return required from stocks
→ greater scrutiny of valuations
→ greater importance of earnings growth
But there is another side to the equation.
If yields rise because the economy is strengthening and corporate earnings are improving, stocks can potentially absorb higher rates. If yields rise because inflation expectations, fiscal concerns, or supply shocks are becoming more severe, the same move in yields can carry a much more negative message for risk assets.
Same yield. Different reason. Different market reaction.
That's the part that often gets missed when traders reduce the relationship to “yields up = stocks down.”
The better question is not whether 5% is automatically bullish or bearish for stocks. The better question is what that 5% represents, what investors were previously expecting, and whether corporate earnings can justify the valuation being paid for them.
The 5% threshold isn't a signal. It's a comparison.
It forces investors to compare the return they can earn from a relatively low-risk asset with the return they expect from taking equity risk.
And once that comparison changes, the entire valuation conversation changes with it.  Education
 Long
Long
 Long
Long
ASML: Daily Ascending Triangle Breakout1. The Macro Perspective: The Secular Tech LeaderI am taking a LONG bias on ASML Holding N.V. (ASML) on the daily (1D) timeframe.When analyzing pure market structure on a mega-cap technology leader, periods of horizontal digestion are essential before the next major leg up. Following a strong rally in early 2026, the stock entered a multi-month consolidation phase. Rather than collapsing, institutional buyers stepped in at progressively higher prices, establishing a clear sequence of higher lows. Fundamentally, this technical strength aligns with recent news that UBS raised its price target on ASML, citing rising demand for AI chips and predicting a prolonged investment cycle extending into 2028. Additionally, the company recently announced a strategic partnership with Tata Electronics to advance India's semiconductor manufacturing ecosystem, reinforcing ASML's global dominance. 2. The Educational Setup: The Ascending TriangleTo understand the absolute technical validity behind this setup, look at the key components forming the accumulation structure:The Rising Support Floor: Notice the diagonal trendline starting from the mid-March lows. Buyers consistently defended the daily 20 SMA (the middle blue line of the Bollinger Bands), carving out a sequence of higher lows. This indicates that institutional accumulation was becoming increasingly aggressive.The 1,529.24 Resistance Ceiling: While the lows were getting higher, the highs were being capped by a massive horizontal resistance line drawn at 1,529.24. The price action compressed tightly between the rising trendline and this rigid ceiling, forming a textbook Ascending Triangle. This pattern represents a volatility squeeze, where demand systematically overpowers supply until the ceiling breaks.3. Current Price Action: Volatility Expansion and BreakoutLook at the recent cluster of daily candles on the right side of the chart. The structural pressure cooker has exploded. Buyers have stepped in with undeniable conviction, printing a powerful sequence of green expansion candles that decisively shattered the 1,529.24 horizontal ceiling. The stock is currently trading around the 1,632.90 level, up 2.57% on the session. By closing cleanly above this multi-month resistance block, the price has transitioned out of the ascending triangle compression phase and into a high-volatility markup trend.4. The Trade Plan: Entries, Targets, and Risk ManagementEntry Strategy: Momentum is currently very strong, with the stock trading out in the open above the breakout line. Chasing an extended daily move carries a short-term mean-reversion risk. The highest-probability, lowest-risk entry strategy involves waiting for a minor structural cooling-off period. Look to scale into long positions or place limit orders to catch a potential pullback that retests the broken 1,520.00 to 1,540.00 neckline zone. Letting old historical resistance prove itself as a concrete new support floor offers a phenomenal risk-to-reward ratio.Take Profit (Targets): We use a classical measured move strategy based on the depth of the ascending triangle pattern. By taking the maximum depth of the pattern (roughly 290 points from the ~1,240 base up to the 1,529.24 ceiling) and projecting it upward from the breakout point, our primary structural target sits comfortably in the 1,800.00 to 1,820.00 zone over the coming weeks.Invalidation (Stop Loss): An ascending triangle breakout thesis is invalidated if the price fails to hold its newly claimed structural floor and collapses back below the rising trendline. A hard stop loss should be placed safely below the daily 20 SMA cushion and the recent higher low, specifically around the 1,410.00 to 1,430.00 level. A definitive daily close completely back below 1,400.00 would act as a severe warning sign of a failed macro breakout and a major bull trap.5. Time Horizon:Because this technical setup is built on a 1-Day chart capturing a classic structural continuation pattern and a clear horizontal breakout, this is a high-alpha swing trade designed to capture a rapid momentum markup phase over the coming weeks. Let the trend run!  Long
Long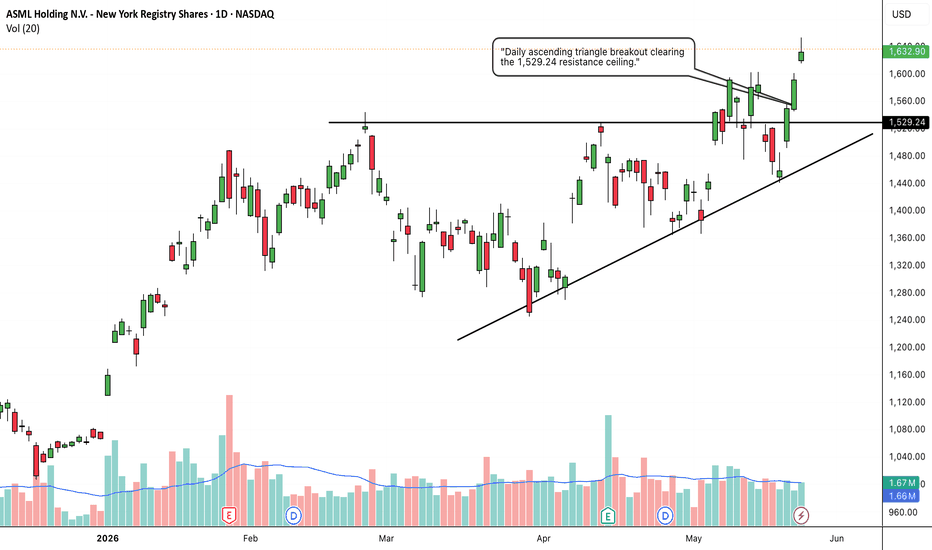
NIFTY — Intraday Buy Setup Near 23,353Overview
Nifty is trading at 23,375, consolidating after yesterday's sharp move up to a high of 23,592.85. Price has pulled back and is holding above a short-term support zone near 23,353, setting up a fresh intraday buying opportunity.
Trade Setup
Buy near: 23,353
Stop Loss: 23,300
Target 1: 23,410
Target 2: 23,460
Target 3: 23,520
Target 4: 23,580
Key Levels
Support: 23,353
Stop Loss: 23,300
Resistance: 23,600
Beginner's Lesson
Using small, staged targets every 50–60 points instead of one big target lets you book partial profits along the way, locking in gains as the move develops rather than risking it all on a single distant target.
Conclusion
Nifty holding above 23,353 keeps the bias bullish for an intraday move toward 23,410–23,580. A break below 23,300 would invalidate this setup.
This is for educational purposes only and not investment advice. Please do your own research or consult a financial advisor before making any trading decisions. Long 
PANW: Monthly Macro Momentum Breakout1. The Macro Perspective: The Structural Shift
I am taking a LONG bias on Palo Alto Networks, Inc. (PANW) on the monthly (1M) timeframe.
When analyzing pure market structure on a mega-cap tech leader, the strongest secular trends are built upon solid foundational bases. Look at the structural development on this chart. The stock previously spent a significant period digesting below the major 144.99 structural baseline. After a decisive breakout above that level, rather than executing a vertical, unsustainable run, PANW entered a prolonged, high-level consolidation phase over the last several months. This secondary accumulation block absorbed profit-taking and allowed the moving averages to act as a rising cushion. Fundamentally, this technical strength aligns with PANW's robust financial performance, highlighted by a recent Q2 2026 earnings beat, strong Next-Generation Security ARR growth, and their continuous platformization push in cybersecurity.
public.com
2. The Educational Setup: High-Level Squeeze and Dynamic Defense
To understand the absolute technical validity behind this macro continuation, look at how the price behaved during the recent digestion phase:
The Dynamic Cushion: Notice how the deep corrective pullbacks within the high-level base were consistently defended near the rising monthly 20 SMA (the middle blue line of the Bollinger Bands, currently near 139.06). Strong-handed institutional portfolios stepped in to defend this moving average, creating a sequence of structural higher lows.
The Volatility Compression: The price chopped tightly beneath the historical resistance ceiling near the 215.00-220.00 zone. This high-level compression acts like a coiled spring, storing immense kinetic energy as demand methodically overpowers floating supply.
3. Current Price Action: Entering Pure Price Discovery
Look at the most recent monthly candle on the far right of the chart. The structural pressure cooker has exploded. Institutional buyers have stepped in with undeniable conviction, printing a massive, full-bodied green expansion candle that has surged up to 260.58 (+45.32%). This vertical thrust has decisively obliterated the previous historical supply zone on a noticeable volume expansion. The price has violently pierced the upper Bollinger Band, confirming a textbook shift out of a low-volatility accumulation phase and into a highly explosive, high-volatility secular markup trend into blue-sky territory. This coincides with major positive fundamental catalysts, including the recent launch of their Idira identity security platform built specifically for the AI enterprise.
investors.paloaltonetworks.com
4. The Trade Plan: Entries, Targets, and Risk Management
Entry Strategy: Macro momentum is exceptionally strong right now with the stock pushing hard into uncharted territory. Because the monthly candle is heavily extended and riding outside the upper Bollinger Band, chasing the price immediately carries a short-term, lower-timeframe mean-reversion risk. The highest-probability, lowest-risk entry strategy involves stepping down to the weekly timeframe and waiting for the initial vertical excitement to cool off. Look to scale into long positions on a potential pullback that perfectly retests the broken 215.00 to 225.00 prior resistance zone. Letting old historical resistance prove itself as a concrete new support floor offers a phenomenal risk-to-reward ratio.
Take Profit (Targets): Because the stock is breaking out of a massive high-level structure to launch into pure price discovery, we use a measured move strategy based on the depth of the consolidation range. Projecting the depth of the recent structure upward from the breakout point, our primary structural macro target sits comfortably in the 310.00 to 320.00 zone over the coming quarters.
Invalidation (Stop Loss): An explosive macro breakout thesis is completely invalidated if the price fails to hold its newly claimed structural floor and collapses back inside the core of the base. A hard stop loss should be placed safely below the recent weekly swing lows, specifically around the 170.00 to 180.00 level. A definitive monthly close completely back below 175.00 would act as a severe warning sign of a failed macro breakout and a major bull trap.
5. Time Horizon:
Because this technical setup is built on a 1-Month chart capturing a massive structural phase transition and an all-time high breakout, this is a longer-term position trade designed to capture a secular markup phase over the coming months and quarters. Let the macro trend run!  Long
Long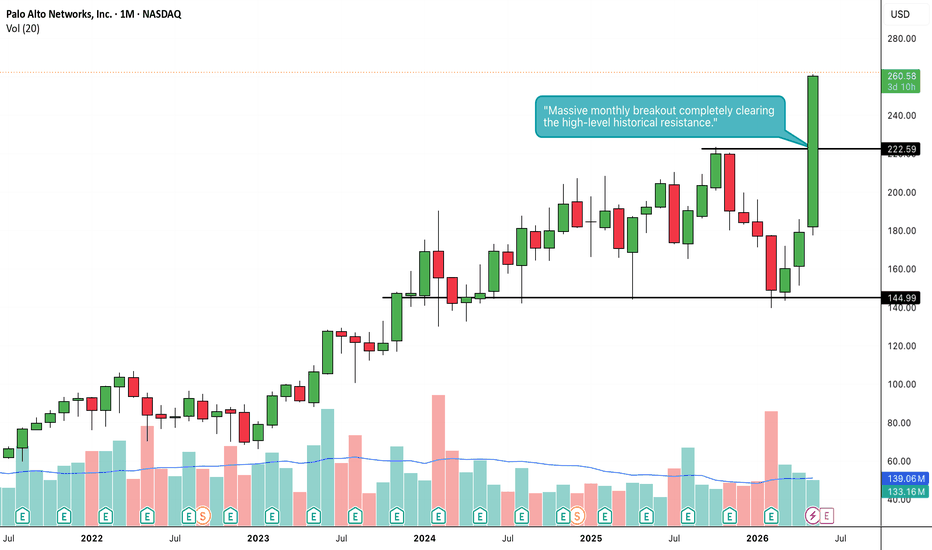
CRWD: Monthly Macro Momentum Breakout1. The Macro Perspective: The Multi-Month Accumulation Box
I am taking a LONG bias on CrowdStrike Holdings, Inc. (CRWD) on the macro monthly (1M) timeframe.
When analyzing pure market structure on a high-growth tech leader, the most lucrative trends emerge from deep, prolonged high-level consolidation phases. Following its massive secular run-up through early 2025, CRWD entered a highly necessary structural digestion cycle. The stock was tightly bounded by a structural floor near the 382.60 pivot and a formidable overhead resistance ceiling at 554.46. This multi-month horizontal accumulation range acted as a massive pressure cooker, successfully exhausting weak retail hands while institutional capital quietly absorbed liquidity and reset the technical structure.
2. The Educational Setup: Dynamic Support and Resistance Clearance
To understand the sheer technical validity behind this massive breakout, look closely at how the price interacted with its core boundaries right before launching:
The Dynamic Cushion: Notice how the deep corrective pullbacks within the high-level base were heavily defended. During the consolidation phase, institutional buyers repeatedly stepped in to protect the structural floor, eventually allowing the rising monthly moving averages to catch up and act as a dynamic launchpad.
The 554.46 Resistance Ceiling: The definitive line in the sand for a bullish continuation was the solid black horizontal resistance line drawn at 554.46. As the price climbed back to this line, it compressed heavily against the resistance, coiling the spring with immense kinetic energy beneath the surface.
3. Current Price Action: Entering Pure Price Discovery
Look at the most recent monthly candle on the far right of the chart. The structural pressure cooker has officially exploded. Institutional buyers have seized total control of the tape, printing a massive, full-bodied green expansion candle that has vertically surged to fresh highs above 660.00. This explosive thrust has decisively obliterated the 554.46 multi-month ceiling. Furthermore, the price has violently pierced the upper Bollinger Band, confirming that the asset has officially transitioned out of low-volatility accumulation and into a highly explosive, high-volatility secular markup trend, entering pure price discovery territory with zero historical overhead supply.
4. The Trade Plan: Entries, Targets, and Risk Management
Entry Strategy: Macro momentum is exceptionally strong with the stock trading vertically out in the open. Because the monthly candle is heavily extended and riding outside the upper Bollinger Band, chasing the price immediately carries a minor risk of a short-term, lower-timeframe mean-reversion pullback. The highest-probability, lowest-risk entry strategy involves stepping down to the weekly timeframe and waiting for the initial vertical excitement to cool off. Look to scale into long positions or place limit orders to catch a potential pullback to perfectly retest the broken 530.00 to 560.00 prior resistance zone. Letting old historical resistance prove itself as a concrete new support floor provides an unmatched risk-to-reward ratio.
Take Profit (Targets): Because the stock is clearing a major multi-month structure to launch into uncharted sky territory, we use a measured move strategy based on the depth of the accumulation base. By taking the absolute depth of the range (roughly 170 points from the 382.60 floor up to the 554.46 ceiling) and projecting it upward from the breakout point, our primary structural macro target sits comfortably in the 720.00 to 730.00 zone over the coming quarters.
Invalidation (Stop Loss): An explosive macro breakout thesis is completely invalidated if the price fails to hold its newly claimed structural floor and collapses back inside the core of the base boundaries. A hard stop loss should be placed safely below the recent weekly swing lows, specifically around the 450.00 to 470.00 level. A definitive monthly close completely back below 440.00 would act as a severe warning sign of a failed macro breakout and a major bull trap.
5. Time Horizon:
Because this technical setup is built on a 1-Month chart capturing a massive structural phase transition and an all-time high breakout, this is a longer-term position trade designed to capture a secular markup phase over the coming months and quarters. Let the macro trend run!  Long
Long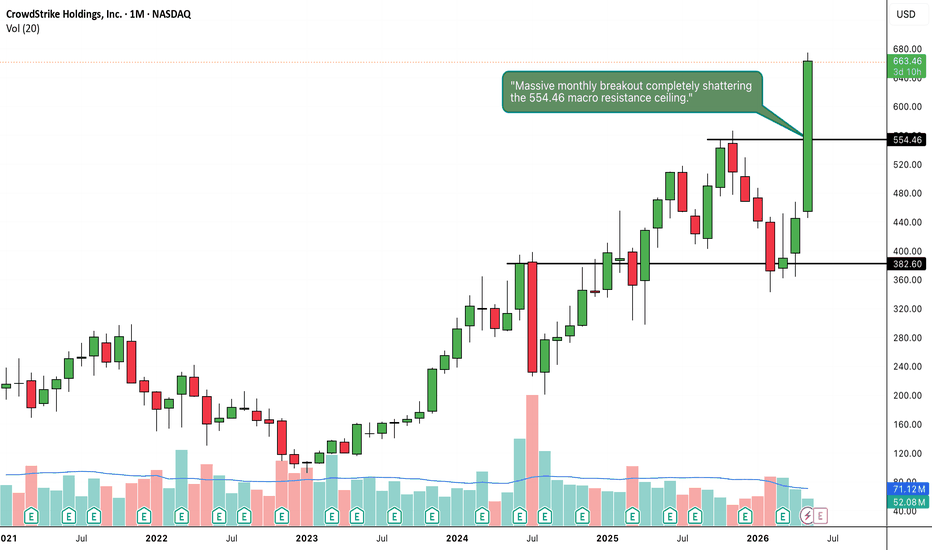
NEPHROPLUS: Massive Box Accumulation and Explosive Weekly Breako1. The Macro Perspective: The Post-Listing Washing Machine
I am taking a LONG bias on Nephrocare Health Services Limited (NEPHROPLUS) on the weekly (1W) timeframe.
When analyzing pure market structure, massive momentum runs require heavy accumulation phases. Look at the structural development on this chart. After its initial run-up, the stock naturally exhausted itself and needed to digest its gains. Instead of suffering a catastrophic markdown phase, institutional buyers established a massive horizontal consolidation zone (a Box). For months, the price chopped violently between the solid black floor at 490.40 and the solid black ceiling at 603.45. This sideways action is the ultimate "washing machine"—it frustrates impatient retail traders into selling, allowing heavy institutional capital to quietly absorb shares without driving the price up prematurely.
2. The Educational Setup: Conquering the Mid-Level Pivot
To understand the sheer strength of this current breakout, look at the mechanics inside the box leading up to the launch:
The Structural Floor: Notice how cleanly the stock defended the 490.40 baseline. Sellers tried to break it, but buyers immediately absorbed the supply, establishing a concrete foundation.
The Squeeze: Look at the dashed 572.60 line. The stock used this as a mid-level pivot. Once it reclaimed this dashed line, it refused to drop back to the floor. By chopping tightly between the 572.60 pivot and the 603.45 ceiling, the stock acted like a high-level pressure cooker, storing immense kinetic energy for the final move.
3. Current Price Action: The Lid Blows Off and the Pause
Look at the most recent weekly candles on the far right. The pressure cooker has absolutely exploded. Buyers effortlessly shattered the 603.45 box ceiling with a massive, full-bodied green momentum expansion candle. Furthermore, look at the current active candle (the small red one). After a massive vertical thrust, the stock is taking a healthy, necessary breather. To amateur traders, a red candle looks like a failed rally. To structural traders, this is a textbook "Continuation Pause" or inside bar holding well above the breakout level. NEPHROPLUS has officially left the box and entered "Blue Sky Territory" (pure price discovery).
4. The Trade Plan: Entries, Targets, and Risk Management
Entry Strategy: Momentum is exceptionally strong right now near 649.70. Chasing a massive vertical expansion candle carries the risk of agonizing drawdowns as the stock naturally breathes. We are currently getting that breather. The highest-probability, lowest-risk entry involves stepping down to a daily timeframe and placing limit orders to catch a potential minor structural pullback to perfectly retest the top of the box in the 600.00 to 610.00 zone. Letting that old, heavy box resistance prove itself as a new, indestructible support floor offers a phenomenal risk-to-reward ratio.
Take Profit (Targets): Because the stock is in pure price discovery, we use measured structural targets based on the depth of the consolidation box. By taking the depth of the box (roughly 113 points from the 490.40 floor to the 603.45 ceiling) and projecting it upward from the breakout line, our primary structural macro target sits perfectly in the 715.00 to 720.00 zone. The massive 700.00 century mark will act as the immediate psychological magnet.
Invalidation (Stop Loss): A box breakout thesis is only valid if the stock refuses to fall back into the trap. A hard stop loss should be placed safely below the dashed mid-level pivot, around the 550.00 to 560.00 level. A definitive weekly close completely back inside the lower half of the box (below 572.60) would act as a massive warning sign of a failed breakout and a severe bull trap.
5. Time Horizon:
Because this technical setup is built on a 1-Week chart capturing an explosive breakout from a multi-month consolidation box, this is a medium-to-longer-term position trade designed to capture the violent momentum thrust into new highs. Let the new trend run!  Long
Long
 Long
Long
GKSL: Explosive Multi-Level Breakout Completing the Macro Recove1. The Structural Perspective: The Great Recovery
I am taking a LONG bias on Gujarat Kidney & Super Speciality Ltd. (GKSL) on the daily (1D) timeframe.
When analyzing a chart, the historical price action sets the narrative. Looking at the far left of this chart, we see a massive, violent gap-down and selloff. However, instead of bleeding out, the stock began a long, methodical process of accumulation. Over the past several months, it carved out a beautiful rounding bottom (or U-shaped recovery), slowly absorbing overhead supply and grinding higher. Today, that recovery phase officially transitioned into a high-momentum breakout phase.
2. The Educational Setup: Conquering the Double Ceiling
What makes this specific breakout so powerful is how it handled its historical resistance levels:
Level 1 (114.89): Notice how the stock previously struggled at the 114.89 mark. It pulled back, formed a higher low, and then decisively sliced through it, flipping that old ceiling into a new support floor.
Level 2 (120.88): After clearing the first hurdle, the price briefly paused before launching a massive, full-bodied green candle directly through the ultimate macro resistance line at 120.88. Clearing two major structural ceilings in such quick succession demonstrates overwhelming institutional buying pressure.
3. Current Price Action: The Bollinger Band Expansion
To truly understand the momentum here, look at the Bollinger Bands. The recent price action hasn't just broken horizontal lines; it is actively riding and pushing the upper red Bollinger Band violently outward. In technical analysis, when a stock rides an expanding upper band on a daily timeframe after a long rounding bottom, it signals extreme volatility expansion. Buyers are hitting the ask relentlessly, ignoring the premium because they anticipate much higher prices.
4. The Trade Plan: Entries, Targets, and Risk Management
Entry Strategy: The stock is currently experiencing extreme upside velocity near 125.22. Chasing extended daily candles always carries a higher risk of immediate drawdown. The highest-probability, lowest-risk entry would involve placing limit orders to catch a potential minor daily pullback to retest the 120.88 breakout zone. Letting that old heavy resistance prove itself as a new launchpad offers a phenomenal risk-to-reward ratio.
Take Profit (Targets): With the stock breaking out of a massive rounding base and clearing all immediate structural resistance, it enters a void of overhead supply. The first major psychological milestone is 135.00. If the volatility band continues to expand and volume supports the move, 145.00 to 150.00 becomes the next logical swing target.
Invalidation (Stop Loss): A trade thesis is only valid if the new market structure holds. A hard stop loss should be placed safely below the 114.89 intermediate support and the 20-SMA dynamic support (the blue middle band), around the 110.00 to 112.00 level. A daily candle closing completely back below 114.89 would indicate a severe loss of momentum and a potential failed breakout.
5. Time Horizon:
Because this technical setup is built on a 1-Day chart capturing an explosive momentum transition, this is a short-to-medium-term swing trade designed to play out over the coming days to weeks. Let the daily candles dictate the trend.  Long
Long