LTM Looks Interesting || 4,784 is The Key Level To Watch ||A Classic Elliott Wave Reversal Setup. 🌊
LTM has once again bounced from a strong multi-year demand zone, the same level that has repeatedly attracted aggressive buying in the past. From an Elliott Wave perspective, the ongoing correction appears to be approaching completion, making this an interesting chart to monitor.
🔍 Elliott Wave Perspective
The chart suggests that LTM has completed a Double Three (W-X-Y) corrective pattern.
Wave (W): First corrective decline into the major support zone.
Wave X: Recovery rally before the next corrective phase.
Wave (Y): Final corrective leg, once again ending at the same historical demand area.
The repeated defense of this support increases the probability that the larger correction may be complete.
📌 Strong Historical Demand Zone
One of the strongest observations on this chart is how consistently buyers have defended the same support.
✅ Major reversal in 2022.
✅ Another strong reversal during 2025.
✅ Current price has once again reacted positively from the same demand zone.
When price repeatedly respects the same level over several years, that area becomes technically very significant.
✅ First Bullish Confirmation
Although the support looks promising, confirmation is still required.
The first bullish signal will be a decisive breakout above ₹4,784.
Until then, this remains a recovery attempt rather than a confirmed uptrend.
Once this level is reclaimed, market structure begins to shift in favor of the bulls.
🎯 Potential Upside Roadmap
If ₹4,784 is successfully reclaimed and sustained, the next important levels become:
₹6,400 Zone: Previous swing resistance where sellers have repeatedly entered the market.
₹7,300–₹7,600 Supply Zone: A major long-term resistance area that has rejected price multiple times in the past.
This upper zone is likely to witness profit booking and could become a strong obstacle before any larger breakout.
❌ Invalidation
After a confirmed breakout above ₹4,784, the bullish Elliott Wave count remains valid as long as price holds above ₹3,528.
A sustained move below this level would invalidate the current bullish scenario and require a fresh wave count.
📈 Trading Plan
Bullish Confirmation: Above ₹4,784
Invalidation: Below ₹3,528 (after confirmation)
Resistance 1: Around ₹6,400
Resistance 2: ₹7,300–₹7,600
The chart is currently at an attractive location from a risk-reward perspective. However, support alone is not enough—confirmation is essential. Let the market prove its strength before expecting a sustained rally.
Warning ⚠
This analysis is for educational purposes only and represents an Elliott Wave interpretation, not financial advice.
#LTM #ElliottWave #DoubleThree #TechnicalAnalysis #PriceAction #SwingTrading #PositionalTrading #TradingView #StockMarket #NSE #SupportAndResistance #WaveAnalysis #Investing #ChartAnalysis #DIVISLAB #ElliottWave #RunningTriangle #TriangleBreakout #SwingTrading #PositionalTrading #StockMarket #NSE #TechnicalAnalysis #TradingView #PriceAction #WaveAnalysis #Investing #ChartAnalysis #TradingView #Forex #PriceAction #NikhilKanal #iElliottician #IndianEW #EWinHindi #XAUUSD #Gold #ElliottWave #BNF #NIFTY  Long
Long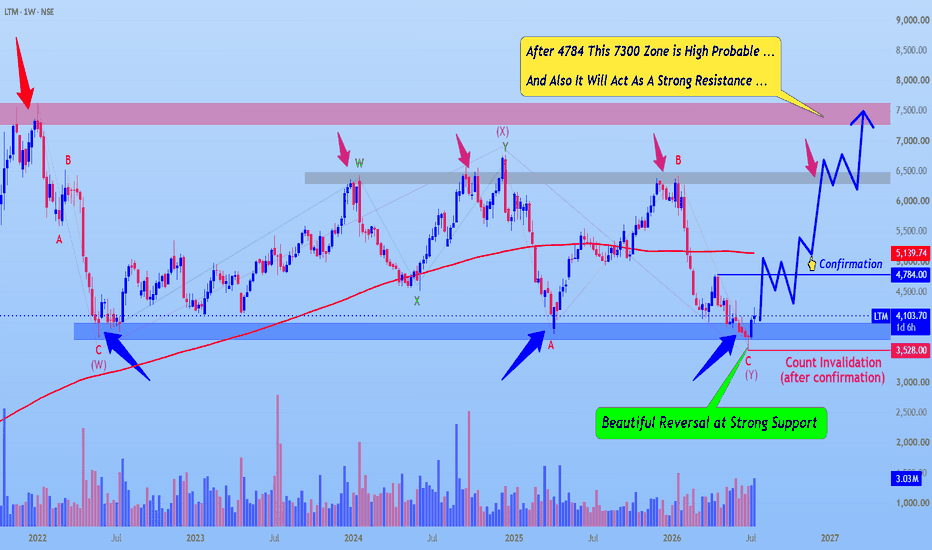
 Long
Long
 Long
Long
GBPUSD: The Current Rally Now Has to Prove Its StrengthGBPUSD has reached a point where the current rally needs to prove it still has enough strength to continue. After a strong recovery from lower levels, price has entered a major resistance zone clearly marked on the chart. This is where I become more cautious, because fast rallies often begin to lose momentum when they revisit areas that previously attracted significant selling pressure.
Simply reaching resistance is not a sell signal for me. What matters is how the market reacts. If price pushes slightly higher but then shows clear rejection, smaller bullish candles, or fails to establish acceptance above the resistance zone, it would suggest that buying pressure is fading. In that case, the current rally could turn into nothing more than a short-term distribution phase before sellers regain control.
If that scenario develops, I'll be watching for a correction toward 1.33850. This target becomes much more convincing if price leaves the resistance zone with clear signs of increasing selling pressure. On the other hand, if buyers manage to break decisively above the resistance and hold that level, the bearish outlook would no longer be valid.
This is simply my personal interpretation of the current market structure and should not be considered financial advice. I prefer to wait for market confirmation rather than react too early, and I always make risk management my highest priority. BRIAN XAUUSD – GOLD RECLAIMING FROM LOWER VALUE BEFORE CPI BRIAN XAUUSD – GOLD RECLAIMING FROM LOWER VALUE BEFORE CPI
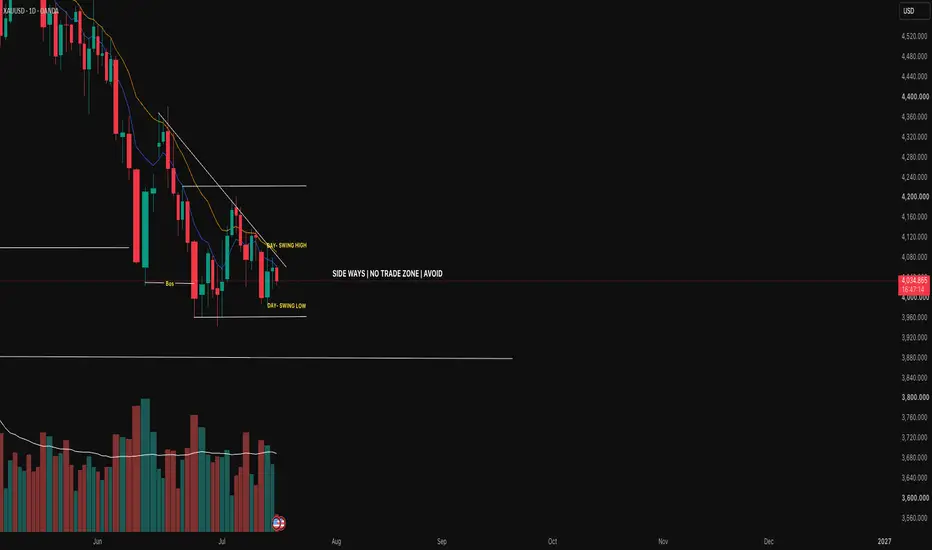
Gold is starting to recover from the lower value area after reacting around the buyside liquidity zone near 3,995 - 4,002. The move is not strong enough to confirm a full reversal yet, but price is no longer trading with clean downside continuation.
Today’s CPI release can become the main trigger for the next move. Headline inflation is expected to soften due to lower gasoline prices, but the real focus will be on core CPI. That number matters more because it shows whether underlying inflation is still sticky.
At the same time, Fed Chair Kevin Warsh’s first official monetary policy testimony may influence rate expectations and short-term USD direction. For gold, this creates a clear risk event: price can expand quickly once the market receives confirmation.
Technical structure
On the H1 chart, gold has reacted from the lower liquidity base and is now pushing back towards the POC Reclaim Zone around 4,055 - 4,060.
This is the key area I am watching. If price breaks and holds above this zone, buyers can start to rebuild acceptance and open the path towards the golden peak of last week near 4,137.
However, if gold fails at the POC Reclaim Zone, the rebound remains weak and price may rotate back towards the buyside liquidity area.
Important zones
Buyside liquidity: 3,995 - 4,002
Lower reaction zone where buyers stepped in.
POC Reclaim Zone: 4,055 - 4,060
Main value area buyers need to reclaim.
The golden peak of last week: 4,137
Next upside target if price accepts above POC.
Weekly High Resistance: 4,175 - 4,180
Major resistance if CPI triggers stronger bullish momentum.
Trading scenario
Buy reaction after POC reclaim 4,055 - 4,060
Entry:
Look for buy positions only if price breaks and holds above 4,055 - 4,060, then retests this zone with clear bullish rejection.
Stop Loss:
Below the POC Reclaim Zone or below the local swing low.
Take Profit:
TP1: 4,100
TP2: 4,137
TP3: 4,175 - 4,180 if CPI supports further upside
This setup is based on gold reclaiming value after reacting from lower liquidity. Without acceptance above the POC zone, the buy setup remains incomplete.
Final view
Gold is trying to recover before CPI, but the real confirmation is still at 4,055 - 4,060.
If buyers reclaim this POC zone, gold can continue towards 4,137 and possibly 4,175.
If price fails there, the market can rotate back towards 4,000 and the rebound becomes only a weak reaction from liquidity.
Today is not the day to chase candles. Let CPI confirm direction. Let price reclaim value. Then trade the reaction.
 Long
Long
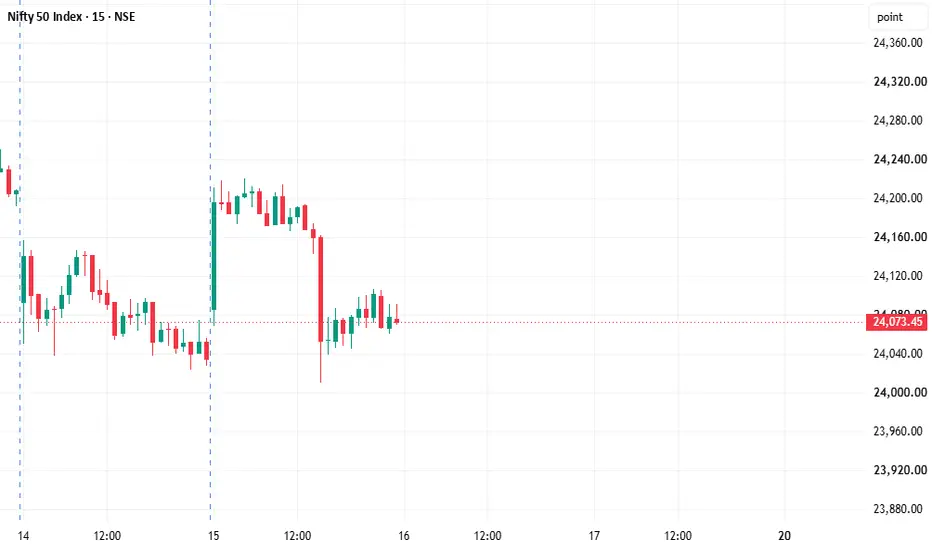
Nifty Intraday Outlook 16-07-2026
NIFTY 15 Min: Support Hold or Breakdown?
NIFTY is trading near 24,070, holding above the important 24,010–24,000 support zone.
The chart is weak after rejection from higher levels, but price is still above support. Bulls need to reclaim 24,105–24,120 for recovery.
Key Levels
Resistance: 24,100–24,120
Target 1: 24,160
Target 2: 24,250–24,260
Support: 24,010–24,000
Demand Zone: 23,940
Lower Target: 23,860
Trade Plan
Bullish above 24,120
Targets: 24,160 / 24,250 / 24,260
Bearish below 24,000
Targets: 23,940 / 23,900 / 23,860
Support bounce near 24,000 only if bullish rejection appears.
View
NIFTY is not bullish yet. It is in a decision zone.
Above 24,120 → buyers active
Below 24,000 → sellers active
Inside range → wait patiently
Educational view only. Trade with strict risk management. Reliance Industries Ltd - Intraday Bearish View (15-M)As highlighted in the chart, price is approaching the upper resistance zone after consolidating in a range. A descending trendline is clearly visible, suggesting potential rejection and downward move.
Key Levels:
Resistance Levels:
Immediate Resistance: ₹1,300 – ₹1,305
Major Resistance: ₹1,310 – ₹1,315 (Strong supply zone + upper green area)
Support Levels:
Immediate Support: ₹1,285 – ₹1,280
Lower Support: ₹1,270 – ₹1,265
Bearish Setup:
Price is likely to touch the resistance zone (₹1,300–₹1,315) and face selling pressure
Descending trendline reinforces the bearish structure
Expected move: Rejection from resistance followed by downside continuation
Trading Strategy (Intraday):
Sell on approach or breakdown below ₹1,295 – ₹1,300
Stop Loss: Above ₹1,310 (tight) or ₹1,317 (aggressive)
Target 1: ₹1,280 – ₹1,285
Target 2: ₹1,270
Extended Target: ₹1,260 if momentum accelerates
Risk Management: Use proper stop-loss above resistance. Wait for confirmation candle rejection at resistance before entering. Keep position size small due to current range-bound nature.
Conclusion: Bearish as long as price remains below ₹1,305. Watch for strong rejection at the upper zone for high-probability downside trade.
Disclaimer: This is for educational and technical analysis purposes only. Intraday trading involves high risk. Always do your own research and trade responsibly  Long
Long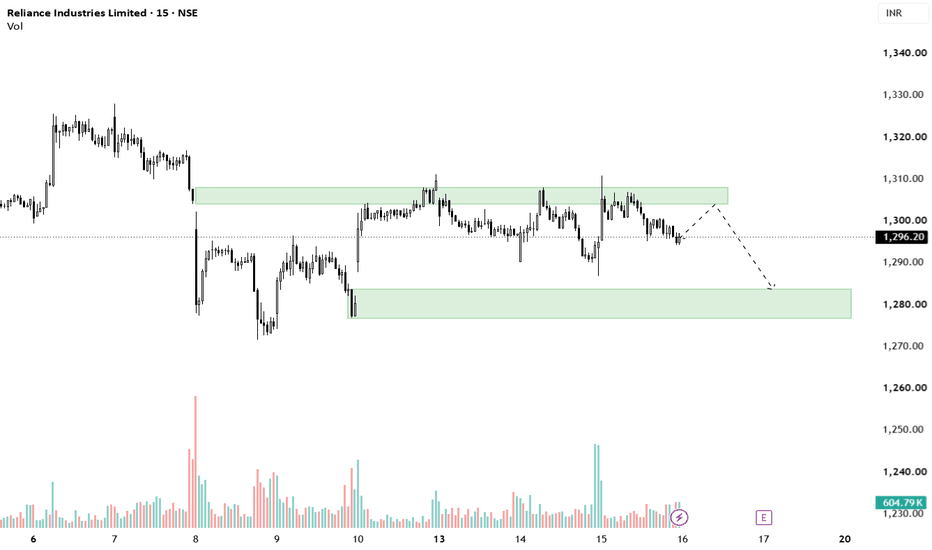
#NIFTY Intraday Support and Resistance Levels - 16/07/2026Nifty is expected to witness a flat opening, indicating a balanced start between buyers and sellers. The index is currently trading near the crucial 24050–24100 support zone, making this level important for today's intraday direction. Traders should avoid taking aggressive positions at the opening and wait for confirmation before entering fresh trades.
The immediate support is placed at 24050–24100. If Nifty sustains above this zone and attracts buying interest, traders can consider long positions with targets of 24150, 24200, and 24250. A decisive breakout above 24250 will confirm stronger bullish momentum and may extend the rally towards 24350, 24400, and 24450+.
On the downside, if Nifty slips below 23950, traders can consider short positions with targets of 23850, 23800, and 23750. A sustained breakdown below 23950 will strengthen the bearish trend and may trigger further selling pressure toward lower support levels.
Overall, a flat opening is expected. As long as Nifty holds above the 24050 support zone, buying on dips remains the preferred strategy. Fresh short positions should only be considered after a confirmed breakdown below 23950, with strict stop-losses and disciplined profit booking at each target level. #BANKNIFTY Intraday PE & CE Levels(16/07/2026)Bank Nifty is expected to witness a flat opening, indicating a balanced start between buyers and sellers. The index is currently trading near the 57550–57600 support zone, making this level crucial for today's intraday direction. Traders should wait for confirmation before initiating fresh positions rather than reacting to the opening move.
The immediate support is placed at 57550–57600. If Bank Nifty sustains above this zone and attracts buying interest, traders can consider CE positions with targets of 57750, 57850, and 57950. A decisive breakout above 58050 will confirm stronger bullish momentum and may extend the rally towards 58250, 58350, and 58450.
On the downside, if Bank Nifty slips below 57950–57900 and faces rejection from higher levels, traders can consider PE positions with targets of 57750, 57650, and 57550. A sustained breakdown below 57450 will strengthen the bearish trend and may push the index towards 57250, 57150, and 57050.
Overall, a flat opening is expected. As long as Bank Nifty holds above the 57550 support zone, buying on dips remains the preferred strategy. Fresh short positions should only be considered after a confirmed breakdown below 57450 or a rejection from the 57950–58000 resistance zone, with strict stop-losses and disciplined profit booking at each target level. XAUUSD: Breakout Started, But 4,061 Must Hold XAUUSD: Breakout Started, But 4,061 Must Hold
Market Context
Gold is recovering toward the 4,050 area after softer US inflation data increased expectations that the Fed may take a less hawkish stance. This gives buyers short-term support, especially as the US Dollar loses some pressure after the CPI release.
But the market is not fully bullish yet. Gold has broken out of the short-term downtrend channel, but a breakout alone is not enough. Buyers now need to hold structure and reclaim the next liquidity zone before the recovery becomes stronger.
The main story is simple: gold has escaped the downtrend channel, but 4,045 - 4,061 decides whether this becomes a real recovery or another failed bounce.
Technical Structure
Gold is trading around 4,039 after breaking out of the descending channel. The breakout is a positive sign, but the price has not yet confirmed a strong bullish continuation.
The short-term decision zone is 4,045 - 4,061. If buyers reclaim and hold this area, gold may extend toward the First Sell Reaction zone around 4,110 - 4,120.
The nearest support is the Buy Reaction Zone around 4,020 - 4,030. As long as this area holds, the short-term rebound remains valid.
If gold loses 4,020, the breakout becomes weak and price may retest the weak low area around 3,980 - 3,990. Above the market, the bigger resistance remains the Premium Supply zone around 4,150 - 4,180.
Key Levels
Current Price: 4,039
Buy Reaction Zone: 4,020 - 4,030
Reaction Base: 4,045
Internal Liquidity: 4,061
First Sell Reaction: 4,110 - 4,120
Premium Supply: 4,150 - 4,180
Weak Low Area: 3,980 - 3,990
Bullish Confirmation: Above 4,061
Bearish Risk: Below 4,020
Trading Plan
Buy Scenario: Breakout Continuation
Entry: Above 4,061 after breakout and retest
Stop Loss: Below 4,020
TP1: 4,080
TP2: 4,110
TP3: 4,120
Conditions: Price must reclaim 4,045 - 4,061 with strength, hold the retest, and continue forming higher lows. Buyers need to defend the 4,020 - 4,030 reaction zone. This setup is stronger if gold stays above the broken channel and does not fall back inside the old downtrend.
Buy Pullback Scenario
Entry: 4,020 - 4,030 after bullish confirmation
Stop Loss: Below 3,990
TP1: 4,045
TP2: 4,061
TP3: 4,110
Conditions: Price pulls back into the Buy Reaction Zone and shows a clear bullish rejection. This is a support reaction setup, so confirmation is important. Avoid buying if price breaks below 4,020 with strong bearish momentum.
Sell Scenario: Failed Breakout
Entry: Below 4,020 after breakdown and retest
Stop Loss: Above 4,045
TP1: 3,990
TP2: 3,980
TP3: 3,960
Conditions: Price loses the Buy Reaction Zone, retest fails, and bearish momentum returns. This would confirm that the channel breakout was weak and buyers failed to protect the recovery structure.
Alternative Sell Scenario: Sell From Resistance
Entry: 4,110 - 4,120 after bearish confirmation
Stop Loss: Above 4,150
TP1: 4,061
TP2: 4,045
TP3: 4,020
Conditions: Price reaches the First Sell Reaction zone but fails to continue higher. Bearish rejection appears, buyers lose momentum, and price starts forming lower highs again. This is a reaction sell only unless gold later breaks below 4,020.
Overall Bias
Gold has started to recover after breaking out of the short-term downtrend channel, supported by softer US inflation data and expectations of a less hawkish Fed.
However, the recovery still needs confirmation. The key area is 4,045 - 4,061. A clean hold above this zone can open the way toward 4,110 - 4,120. If gold loses 4,020, the breakout becomes weak and sellers may drag price back toward 3,980 - 3,990.
Best approach: wait for confirmation around 4,061 or a clean reaction from 4,020 - 4,030. Do not chase the breakout before buyers prove control.
Will buyers reclaim 4,061, or will this breakout turn into another trap?
Long 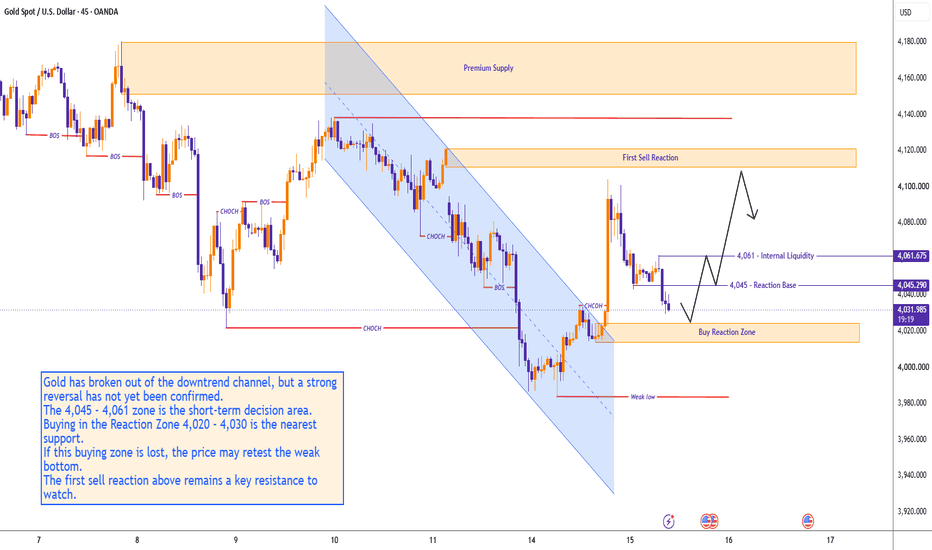
 Long
Long
SENSEX Trading Plan — 16th July 2026 | Expiry Day Special 📈
Hello Traders! 👋 Here's your detailed, educational trading roadmap for SENSEX covering all three opening scenarios — Gap Up, Flat, and Gap Down (300+ points). Since tomorrow is SENSEX Weekly Expiry, expect premium decay to work aggressively and volatility to spike in the last hour. Read the full plan carefully before executing any trade. 🎯
🔑 Key Levels to Watch
🔸 Major Resistance Zone → 78,007.00 (extended upside target)
🔸 Last Intraday Resistance → 77,617.00
🔸 Opening Resistance (No-Trade Orange Zone) → 77,380.00
🔸 Opening Support Zone (Gap Down Case) → 76,798 - 76,880
🔸 Last Intraday Support → 76,583.00
🔸 Extended Downside Level → 76,071.00
📌 Chart Color Guide: 🟠 Orange Line = Sideways/No-Trade Zone | 🟢 Green = Bullish/Long Bias | 🔴 Red = Bearish/Short Bias | Dashed Lines = Possible continuation zone (trend "may or may not" sustain — lower confidence, always trail SL)
📌 Expiry Day Note: Since tomorrow is SENSEX expiry, option premiums will decay rapidly, especially after 1:00 PM. Avoid option buying in the second half unless the trend is very clear. Time decay is the biggest enemy of buyers on expiry day. ⏰
🟢 SCENARIO 1: GAP UP OPENING (300+ points → Open above ~77,380-77,450)
📚 Understanding the Setup: A strong gap-up opening of 300+ points signals very positive overnight sentiment — possibly driven by strong global markets or positive domestic news. However, gap-ups on expiry day frequently invite aggressive profit booking within the first hour. Confirmation before entry is absolutely essential.
🟢 Trading Action Plan:
🔹 If SENSEX opens above 77,380 and the first 15-min candle closes above this level with healthy volume, bullish strength is confirmed. Look for buying opportunities via Call Options (CE) on minor dips near 77,380-77,420.
🔹 First target on sustained momentum → 77,617 (Last Intraday Resistance).
🔹 On a strong breakout above 77,617 with volume support and candle confirmation, the extended target zone opens towards 78,007 (dashed green zone — since this is an unconfirmed projection, trail your stop-loss actively rather than holding blindly).
🔹 If price gaps up but fails to sustain above 77,380 and starts showing sharp rejection/reversal patterns (as visible in orange zig-zag near the top), treat it as exhaustion — avoid fresh buying. Wait for price to retreat back to 77,380 (Opening Resistance/No-Trade Zone) for a fresh directional signal.
🔹 Stop-Loss for long positions → Below 77,380 on 15-min closing basis.
⚠️ Expiry Day Risk Tip: On expiry day, OTM call premiums inflate massively at gap-up open. Avoid chasing premiums in the first 15 minutes — IV crush can wipe out gains even if direction is right. Wait for confirmation and enter on dips only.
🟠 SCENARIO 2: FLAT OPENING (Open between 76,880–77,380 range / ±150-200 points)
📚 Understanding the Setup: A flat opening indicates market indecision — no clear winner between buyers and sellers. This zone between opening levels is effectively the No-Trade Zone (orange zone) where options buyers typically burn money due to time decay on expiry day. Patience is your best strategy here.
🟠 Trading Action Plan:
🔹 If SENSEX opens flat within the 76,880-77,380 range and continues consolidating sideways, strictly avoid directional option buying 🚫 — theta decay on expiry day will erode premiums rapidly, eating into your capital even if direction eventually moves in your favor.
🔹 A confirmed breakout above 77,380 with volume and 15-min candle closure → Shift to the Gap Up bullish playbook (CE buying, targets 77,617 → 78,007).
🔹 A confirmed breakdown below 76,880 with volume and 15-min candle closure → Shift to the Gap Down bearish playbook (PE buying, target 76,798 → 76,583).
🔹 Experienced traders may consider defined-risk selling strategies like Iron Condors or Short Strangles with strict hedges during this flat zone — expiry day premium decay heavily favors sellers, but only enter with proper risk-defined setups.
⚠️ Expiry Day Risk Tip: Flat markets on expiry day are brutal for option buyers — premiums lose 40-60% value even when price barely moves. Discipline trumps FOMO here. Wait for a clean breakout/breakdown candle before committing capital.
🔴 SCENARIO 3: GAP DOWN OPENING (300+ points → Open below ~76,880-76,800)
📚 Understanding the Setup: A sharp gap-down opening of 300+ points typically reflects strong negative global cues or heavy domestic selling pressure. However, gap-downs on expiry day can either extend into panic selling (favoring PE buyers) or attract aggressive institutional dip-buying (causing sharp short covering). Confirmation is the key differentiator.
🔴 Trading Action Plan:
🔹 If SENSEX opens below 76,880 and sustains weakness with a 15-min candle closing below the Opening Support Zone (76,798), bearish momentum is confirmed. Look for shorting opportunities via Put Options (PE) on pullback rallies toward 76,880-76,920.
🔹 First bearish target → 76,583 (Last Intraday Support).
🔹 On a decisive break below 76,583 with strong volume, extended downside opens toward 76,071 (dashed red zone — trend continuation "may or may not" happen, so trail SL diligently as this is an unconfirmed projection).
🔹 If price gaps down but immediately shows sharp reversal/recovery (dashed green recovery pattern on chart) and reclaims 76,880, avoid fresh short positions — this signals strong dip-buying interest and possible V-shaped recovery. Wait for confirmation above 77,380 for potential long-side entries.
🔹 Stop-Loss for short positions → Above 77,380 on 15-min closing basis.
⚠️ Expiry Day Risk Tip: Gap-down opens on expiry day often witness a violent "short squeeze bounce" within the first 30 minutes. Never short impulsively at the open — wait for a retest and rejection near resistance before entering PE positions for a favorable risk-reward setup.
🛡️ Risk Management Tips for Expiry Day Options Trading
🔸 Always enter with a predefined Stop-Loss — never average into a losing options position, especially on expiry day.
🔸 Limit risk per trade to 1-2% of total capital — expiry day volatility can wipe out positions within minutes; capital protection is non-negotiable.
🔸 Avoid option buying during the first 10-15 minutes of market open — IV crush and inflated premiums hurt buyers the most at open.
🔸 Book partial profits (50%) at first target and trail SL to breakeven — expiry day reversals are swift and brutal.
🔸 Avoid holding option buying positions after 2:30 PM unless trend is extremely clear — theta decay accelerates exponentially in the last 90 minutes.
🔸 Prefer hedged spread strategies (debit spreads) over naked option buying on expiry day to offset theta decay risk.
🔸 Cross-verify technical levels with OI data, PCR ratio, India VIX, and global market cues before major entries.
🔸 Consider reducing position size by 50% compared to normal trading days — expiry day demands extra caution due to erratic price swings.
🔸 Maintain a trading journal — expiry day patterns repeat, and self-analysis is your best teacher over time.
📝 Summary & Conclusion
Tomorrow's structure revolves around three critical decision zones: 77,380 (Opening Resistance/No-Trade Zone), 76,798-76,880 (Opening Support), and 76,583 (Last Intraday Support).
✅ Gap Up (300+ pts): Sustained close above 77,380 → CE buying on dips, targets 77,617/78,007. SL below 77,380.
✅ Flat Opening: Stay out between 76,880-77,380; act only after confirmed breakout/breakdown with volume.
✅ Gap Down (300+ pts): Sustained close below 76,798 → PE buying on pullbacks, target 76,583/76,071. Watch for recovery above 76,880 to exit shorts.
Expiry Day Reminder: 💡 Theta decay is your biggest enemy as a buyer and your biggest ally as a seller on expiry day. Trade with half your normal position size, define your max loss before entering, and avoid overtrading. Consistent small wins beat occasional big losses. Trade your plan, not your emotions! 💪📈
⚠️ Disclaimer
I am not a SEBI registered analyst. This content is shared strictly for educational purposes only to help traders understand technical analysis concepts, support-resistance levels, options expiry dynamics, and risk management frameworks. This is not financial advice or a buy/sell recommendation. Please conduct your own research (DYOR) and consult a certified financial advisor before making any investment or trading decisions. Trading in equities and derivatives, especially on expiry day, involves substantial risk of capital loss and may not be suitable for all investors. Past performance is not indicative of future results. 🙏📉📈  Short
Short
NIFTY - Trading Levels and Plan for 16-Jul-2026Hello Traders! 👋 Here's your complete educational trading roadmap for NIFTY, covering all three opening scenarios — Gap Up, Flat, and Gap Down (100+ points). This plan is designed around key support-resistance zones visible on the chart, with practical insights for options trading. Read the entire plan carefully before executing any trades. 🎯
🔑 Key Levels to Monitor
🔸 Major Resistance Zone → 24,462.00 (extended target)
🔸 Intermediate Resistance → 24,326.00
🔸 Last Intraday Resistance → 24,205.00
🔸 Opening Resistance (No-Trade Orange Zone) → 24,134.00
🔸 Opening Support Zone (Gap Down Case) → 23,964 - 23,988
🔸 Last Intraday Support → 23,901.00
🔸 Buyer's Support Zone → 23,681 - 23,746
📌 Chart Color Guide: 🟠 Orange Line = No-Trade/Sideways Zone | 🟢 Green = Bullish/Long Bias | 🔴 Red = Bearish/Short Bias | Dashed Lines = Below chart = Possible continuation (trend "may or may not" sustain — lower confidence, trail SL actively)
🟢 SCENARIO 1: GAP UP OPENING (100+ points → Open above ~24,205-24,230)
📚 Understanding the Setup: A strong gap-up opening of 100+ points indicates positive overnight sentiment or favorable global cues. However, such openings often attract profit booking from early buyers, so patience and confirmation are crucial before entering longs.
🟢 Trading Action Plan:
🔹 If NIFTY opens above 24,205 and the first 15-min candle closes above this level with volume support, it confirms bullish strength. Look for buying opportunities via Call Options (CE) on minor dips near 24,205-24,220.
🔹 First target on sustained momentum → 24,326 (intermediate resistance level).
🔹 If 24,326 breaks with strong volume and candle confirmation, next extended target zone opens towards 24,462 (dashed green zone — since this is below-chart projection, trend "may or may not" sustain, so trail stop-loss aggressively).
🔹 If price opens with a gap up but fails to sustain above 24,205 and starts showing weakness/rejection patterns (as visible in orange zig-zag on chart), avoid fresh long entries — this signals exhaustion. Wait for price to retreat back to 24,134 (Opening Resistance/No-Trade Zone) for fresh directional confirmation.
🔹 Stop-Loss for long positions → Below 24,134 on 15-min closing basis.
⚠️ Options Risk Tip: At gap-up opens, option premiums are typically inflated due to IV spike. Avoid impulsive buying right at open — wait for first 15-min candle confirmation to spot realistic premium levels.
🟠 SCENARIO 2: FLAT OPENING (Open between 24,134–24,205 range / ±50-70 points)
📚 Understanding the Setup: A flat opening signals market indecision — both bulls and bears are in equilibrium. This white zone between opening levels is essentially a No-Trade Zone where price action lacks clear direction.
🟠 Trading Action Plan:
🔹 If NIFTY opens flat within the 24,134-24,205 range and continues consolidating sideways, avoid directional option buying 🚫 — time decay (theta) works against buyers in ranging markets.
🔹 Watch for a decisive breakout above 24,205 with volume and 15-min candle closure → Then deploy the Gap Up bullish strategy (CE buying, targets 24,326 → 24,462).
🔹 Watch for a decisive breakdown below 24,134 with volume and 15-min candle closure → Then wait for further breakdown of 23,988 (Opening Support upper band) before considering short positions or shift to Gap Down bearish strategy.
🔹 Range-bound traders with experience may consider defined-risk strategies like Bull Call Spreads or Bear Put Spreads within this zone, but only with proper hedging and position sizing.
⚠️ Options Risk Tip: Flat/sideways markets are where most option buyers lose money due to premium erosion even when direction eventually moves. Discipline to wait for clear breakout/breakdown is the edge.
🔴 SCENARIO 3: GAP DOWN OPENING (100+ points → Open below ~23,988-23,960)
📚 Understanding the Setup: A gap-down opening below the opening support zone (23,964-23,988) typically reflects negative sentiment or heavy overnight selling pressure. Such moves can either extend into panic selling or attract institutional dip-buying — confirmation is the differentiator.
🔴 Trading Action Plan:
🔹 If NIFTY opens below 23,988 and sustains weakness with a 15-min candle closing below 23,964 (lower band of Opening Support), it confirms bearish momentum. Look for shorting opportunities via Put Options (PE) on pullback rallies toward 23,988-24,010.
🔹 First bearish target → 23,901 (Last Intraday Support zone).
🔹 On sustained break below 23,901, extended downside opens toward 23,746-23,681 (Buyer's Support Zone). This is a dashed red zone below chart — trend continuation "may or may not" happen, so trail SL diligently.
🔹 If price gaps down but immediately shows strong reversal/recovery (as shown in dashed green recovery pattern below chart) and reclaims 23,988, avoid fresh shorts — this indicates strong dip-buying interest. Wait for confirmation above 24,134 for potential long-side entries using the breakout strategy.
🔹 Stop-Loss for short positions → Above 24,134 on 15-min closing basis.
⚠️ Options Risk Tip: Gap-down opens often witness a "reflex bounce" or dead cat bounce. Never short impulsively at the open — wait for retest and rejection near resistance before entering PE positions for better risk-reward.
🛡️ Risk Management Guidelines for Options Trading
🔸 Always define your Stop-Loss before entry — never exit based on hope or average down on losing positions.
🔸 Limit risk exposure to 1-2% of total capital per trade — options are leveraged instruments where capital preservation is priority #1.
🔸 Avoid option buying during the first 5-10 minutes of market open due to inflated premiums and high volatility.
🔸 Book partial profits (50%) at first target and trail SL to breakeven — protect gains from sudden reversals.
🔸 Avoid overnight holding of option buying positions unless backed by strong conviction — theta decay accelerates overnight.
🔸 Prefer spread strategies (debit/credit spreads) over naked buying/selling to control risk during choppy sessions.
🔸 Cross-verify technical levels with open interest data, PCR ratio, and India VIX for additional confirmation before major entries.
🔸 Maintain a trading journal to track what works and what doesn't — self-analysis is the best teacher.
📝 Summary & Conclusion
Today's structure centers around three critical decision zones: 24,134 (No-Trade/Opening Resistance), 23,964-23,988 (Opening Support), and 23,901 (Last Intraday Support).
✅ Gap Up (100+ pts): Sustained close above 24,205 → CE buying, targets 24,326/24,462. SL below 24,134.
✅ Flat Opening: Stay out between 24,134-24,205; act only after confirmed breakout/breakdown.
✅ Gap Down (100+ pts): Sustained close below 23,964 → PE buying, target 23,901/23,746. Watch for recovery above 23,988 to exit shorts.
Trading success is a marathon, not a sprint. Discipline, patience, and mechanical execution of your plan separate consistent traders from the rest. Trade what you see, not what you hope! 💪📈
⚠️ Disclaimer
I am not a SEBI registered analyst. This content is strictly for educational purposes only to help traders understand technical analysis concepts, support-resistance levels, and risk management frameworks in options trading. This is not financial advice or a buy/sell recommendation. Please conduct your own research (DYOR) and consult a certified financial advisor before making any investment or trading decisions. Trading in equities and derivatives involves substantial risk and may not be suitable for all investors. Past performance is not indicative of future results. 🙏📉📈  Short
Short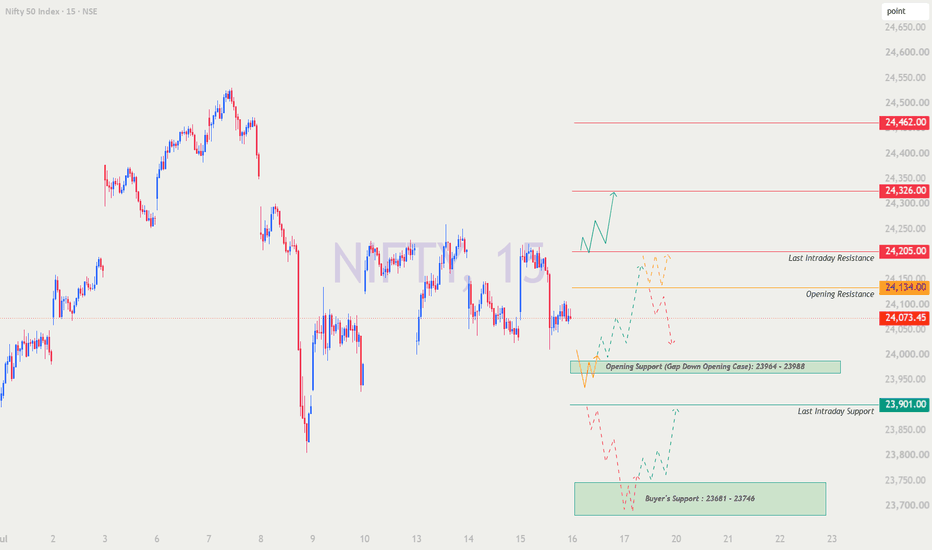
XAUUSD: Is the Pullback an Opportunity for Sellers to Return?XAUUSD is showing signs of a technical rebound from the support zone around $4,000. However, the H4 structure remains largely unchanged, as the price continues to trade below the downtrend line and has failed to break through the $4,083–$4,093 resistance zone.
Notably, selling pressure emerges quickly whenever gold approaches the downtrend line, creating a clear series of lower highs. This indicates that sellers remain in control of the primary trend, while the current upward movement is merely a corrective phase following the previous decline.
Fundamentally, gold remains under pressure as US bond yields stay elevated. Meanwhile, the market awaits further PPI data and statements from the Federal Reserve to gauge the interest rate trajectory. Reuters also reports that rising oil prices have reignited inflation concerns, fueling expectations that the Fed will maintain a tight monetary policy for longer, thereby dampening gold's appeal.
If the price rallies to the $4,083–$4,093 zone but fails to close above the downtrend line, selling pressure could intensify, pushing XAUUSD back down to test the $3,933 support level.
Suggested Strategy: Prioritize SELL positions if signs of rejection appear around the $4,083–$4,093 zone. Target: $3,933. Short 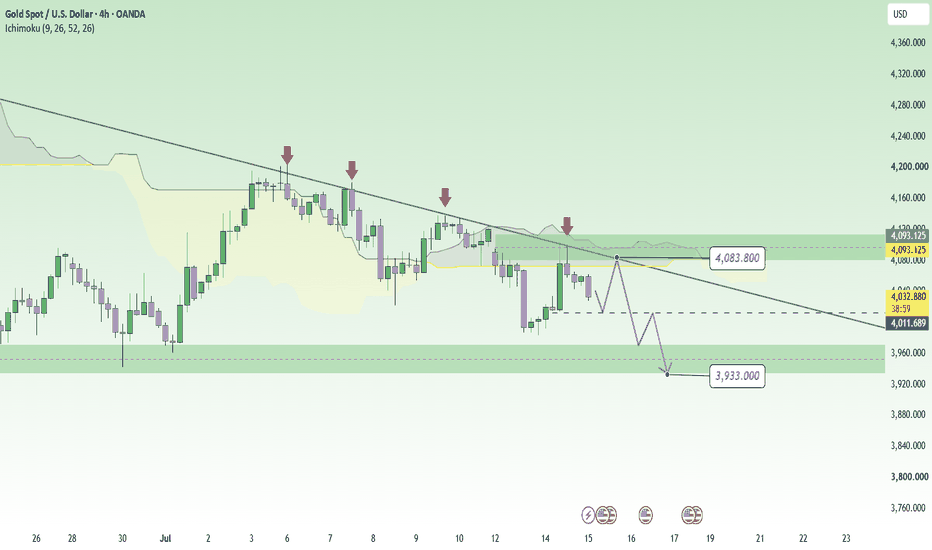
 Long
Long